Observational Study
. 2021 Feb;22(2):128-139.
doi: 10.1038/s41590-020-00830-z. Epub 2021 Jan 4.

Broadly effective metabolic and immune recovery with C5 inhibition in CHAPLE disease

Affiliations
Observational Study

Broadly effective metabolic and immune recovery with C5 inhibition in CHAPLE disease

Ahmet Ozen et al. Nat Immunol. 2021 Feb.

Abstract

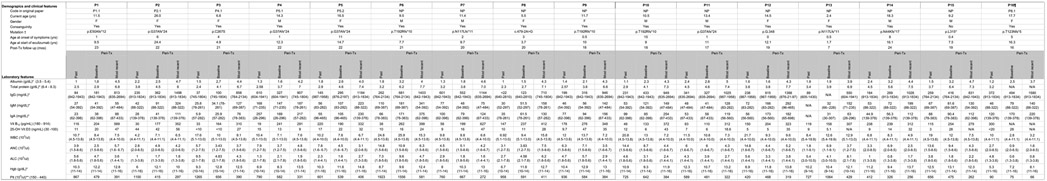
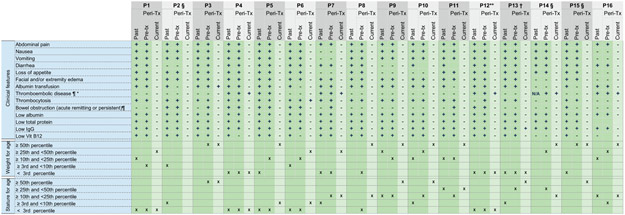
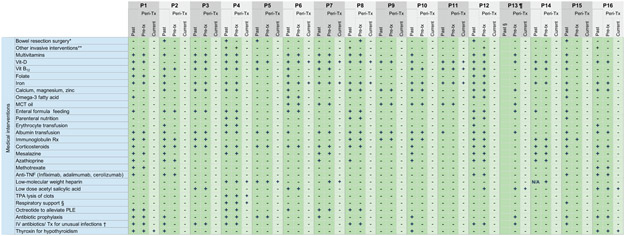
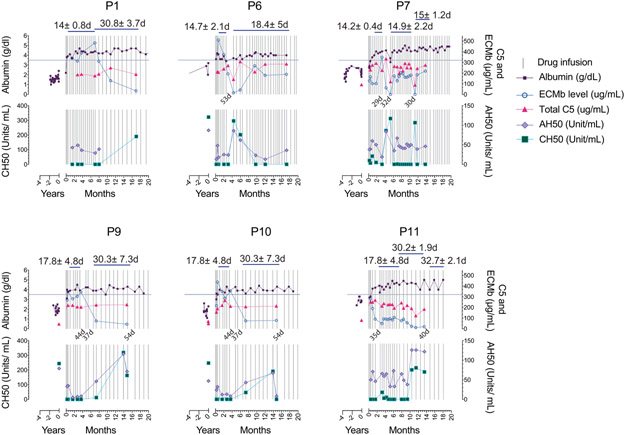
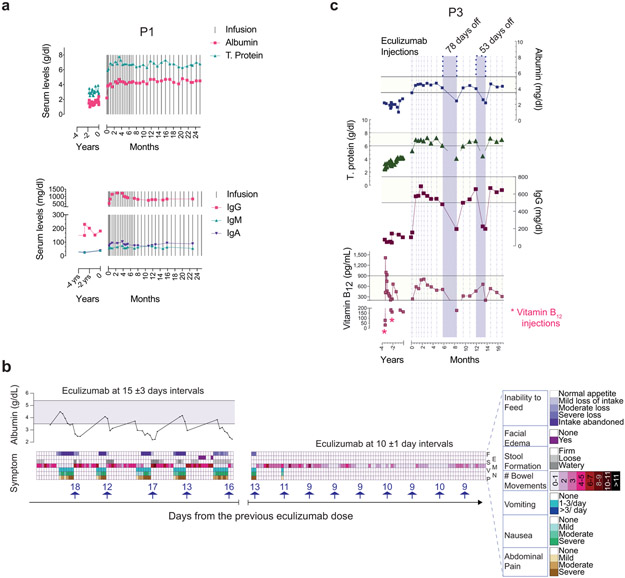
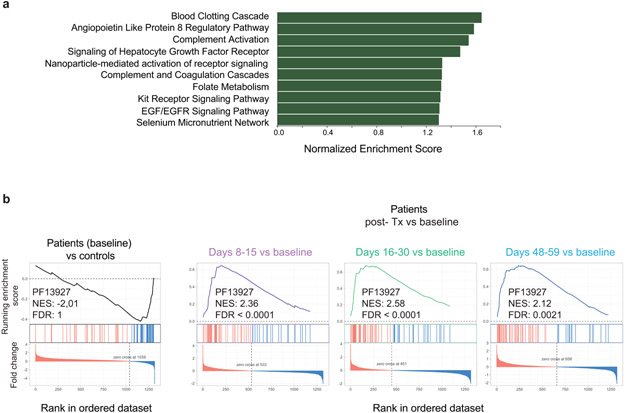
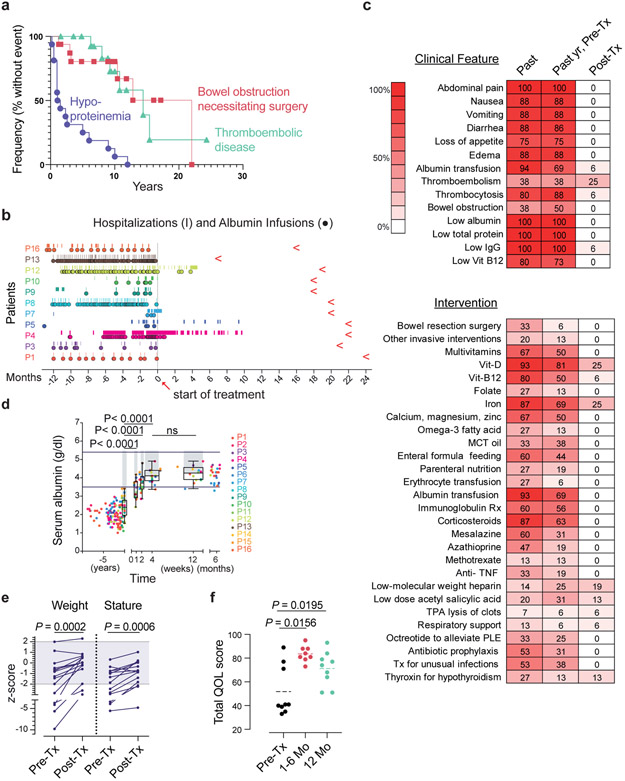
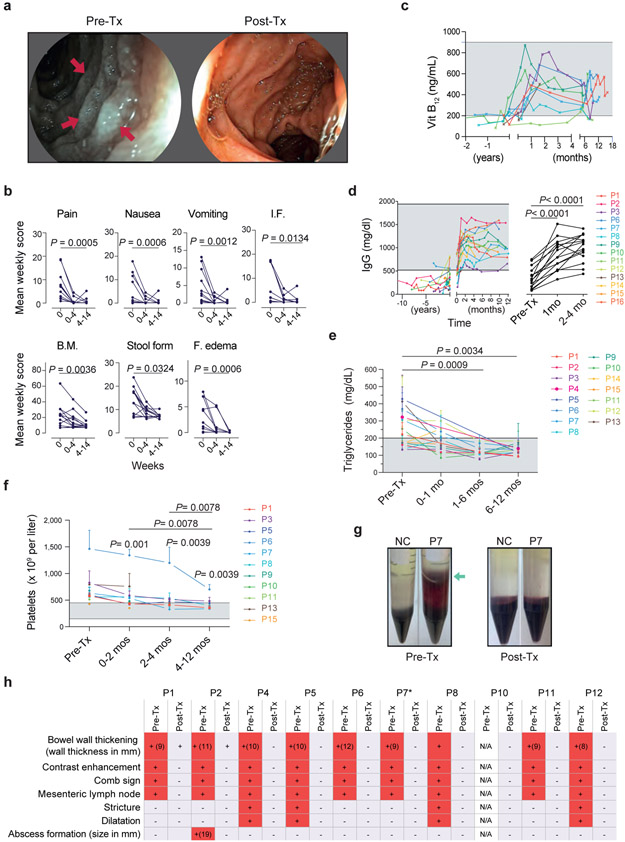
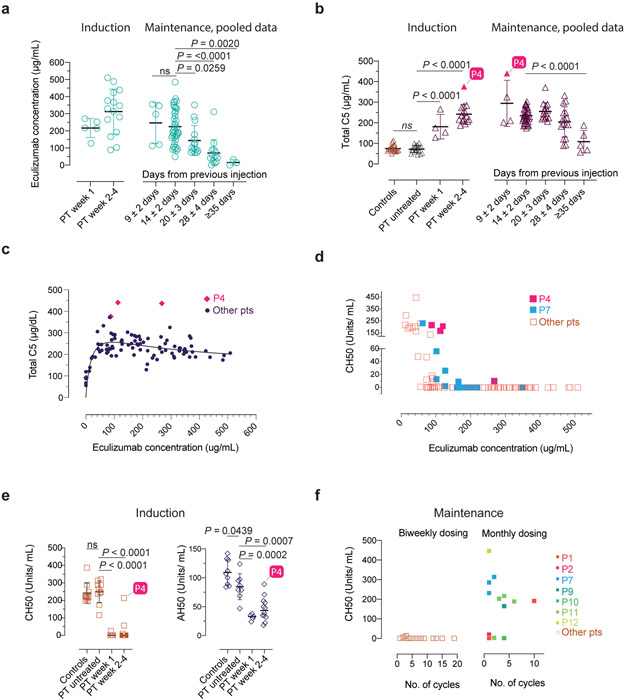
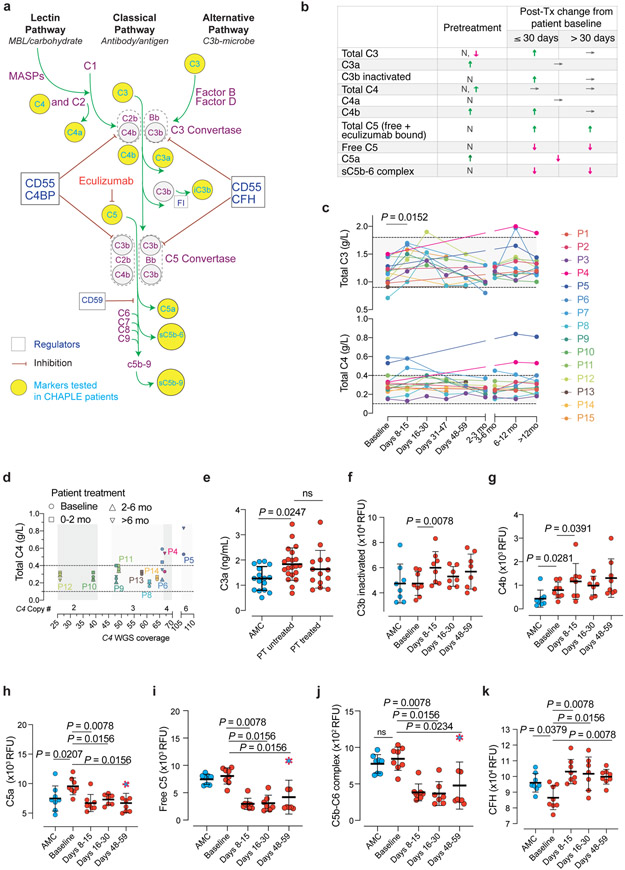
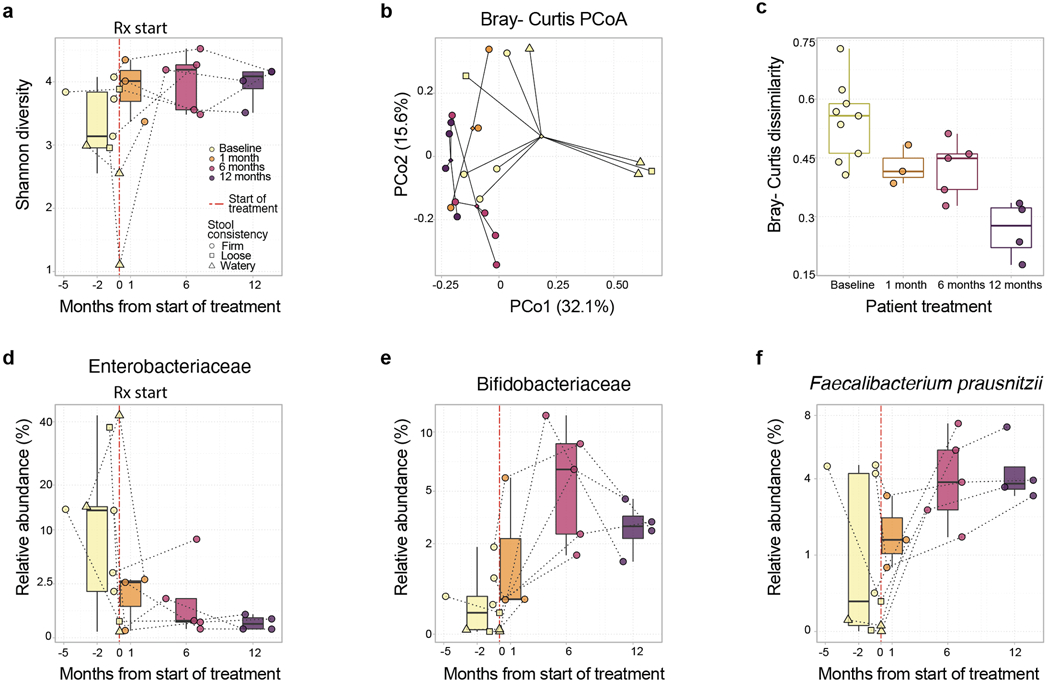
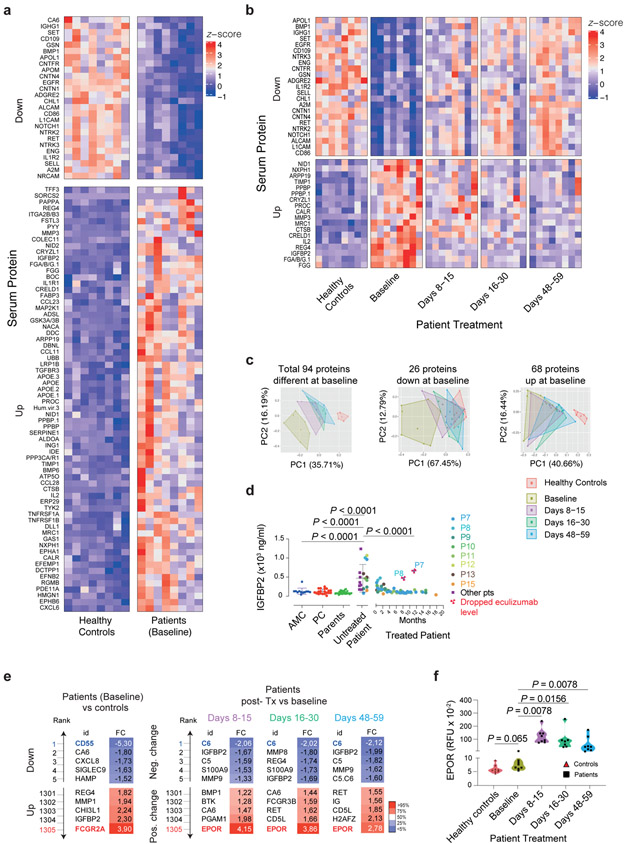
Complement hyperactivation, angiopathic thrombosis and protein-losing enteropathy (CHAPLE disease) is a lethal disease caused by genetic loss of the complement regulatory protein CD55, leading to overactivation of complement and innate immunity together with immunodeficiency due to immunoglobulin wasting in the intestine. We report in vivo human data accumulated using the complement C5 inhibitor eculizumab for the medical treatment of patients with CHAPLE disease. We observed cessation of gastrointestinal pathology together with restoration of normal immunity and metabolism. We found that patients rapidly renormalized immunoglobulin concentrations and other serum proteins as revealed by aptamer profiling, re-established a healthy gut microbiome, discontinued immunoglobulin replacement and other treatments and exhibited catch-up growth. Thus, we show that blockade of C5 by eculizumab effectively re-establishes regulation of the innate immune complement system to substantially reduce the pathophysiological manifestations of CD55 deficiency in humans.


Conflict of interest statement

Competing Interests Statement

The authors M.J.L. and A.O. have a pending patent on C5 inhibitor treatment of CHAPLE. B.S. is a former SomaLogic, Inc. (Boulder, CO, USA) employee and a company shareholder. O.H., Y.G.N., M.D.W., and K.D.N. are employees of Regeneron Pharmaceuticals Inc., a biopharma company. There are no conflicts of interest to report for the remaining coauthors.

Figures

Extended Data Fig. 1
Extended Data Fig. 1. Demographic, clinical and laboratory characteristics of the patients with CHAPLE disease enrolled in the study.
Reference ranges are indicated in parenthesis. NA: Not assessed, NP: New patient, WBC: White blood count, ANC: Absolute neutrophil count, ALC: Absolute lymphocyte count lymphocyte count, Hgb: Hemoglobin, Plt: Platelet count. † CD55 NCBI Reference Sequence: NM_000574. * the lowest values in the past (more than 1 year before therapy) are indicated in the "past" columns. ** the highest values in the past (more than 1 year before therapy) are indicated in the "past" columns. ¶ The serum immunoglobulins compared to age-matched serum immunoglobulin reference ranges of Turkish children (Ref ). Peri-Tx: peri-treatment, referring to the past 12 months before the start of eculizumab until the end of the observation period
Extended Data Fig. 2
Extended Data Fig. 2. Clinical symptoms, laboratory findings and growth percentiles of CHAPLE patients prior to and on eculizumab treatment.
Past: In the lifetime of the patient. Peri-Tx: Peri-treatment, referring to the past 12 months before the start of eculizumab until the end of the observation period. Current refers to the most recent measurement or the observation period when a particular patient has been on regular eculizumab Tx. + present, − absent, N/A: Not assessed * We detected a recanalization of the narrowed segment in the thrombotic vessel in P5 during the follow up exam on eculizumab. However, there was no documented recovery of any of the thromboembolic complications in other patients during the indicated periods of follow up. ** P12 had ischemic gliotic foci in brain imaging. ¶ As identified by appropriate imaging including abdominal ultrasonography (USG) and/or doppler USG, and/or vascular imaging using a computed tomography or magnetic resonance imaging. § Growth percentiles not presented in certain columns; P2 was an adult during the peri-Tx period, and data not available in P14 and P15 for respective periods. † Abdominal pain cannot be assessed in P13 due to verbal immaturity and corresponding assessment was made for discomfort and abnormal crying behavior.
Extended Data Fig. 3
Extended Data Fig. 3. Medical interventions received by CHAPLE patients prior to and during eculizumab treatment.
Past: In the lifetime of the patient. Peri-Tx: Peri-treatment, referring to the past 12 months before the start of eculizumab until the end of the observation period. Current refers to the most recent measurement or the presence of a finding during the observation period when a particular patient has been on regular eculizumab Tx. *A repeat bowel surgery had been planned in P8 prior to eculizumab. Likewise, P3 had been planned to undergo bowel surgery before eculizumab. P15 underwent 2 separate bowel resection surgeries and received 39 days of intensive care support during the postoperative period, including mechanical ventilation. ** "Other invasive intervention" includes placement of a central access device in P8 to deliver frequent albumin transfusions; intracardiac blood clot removal surgery, chest tube placement to drain pneumothorax and a cranial surgery to alleviate brain hemorrhage in P4; a percutaneous endoscopic gastrostomy port to support enteral nutrition in P12; a transjugular intrahepatic portosystemic shunt (TIPS) to relieve portal hypertension in P16. † P8 received intravenous (IV) antibiotics for sepsis and metronidazole for Giardia lamblia enteritis in the past. P4 and P12 experienced cardiovascular problems during the induction period of eculizumab, leading to dose skipping or termination of treatment, respectively. Eculizumab Tx was restarted in P12 after a period off-therapy, with no recurrence of similar manifestations. Fecal assessment during diarrheal episodes revealed Cryptosporidium parvum in P1 and P13 prior to eculizumab, who were treated with nitazoxanide uneventfully. ¶ The column for past medication before 1 year prior to eculizumab is blank for P13 due to young age and onset of symptoms during the past year. § Respiratory support refers to mechanical ventilation and/or oxygen treatment. PLE: Protein-losing enteropathy.
Extended Data Fig. 4
Extended Data Fig. 4. The effect of dose spacing between injections on albumin, trough eculizumab concentration, and complement markers during the maintenance therapy.
Blood samples were obtained prior to each injection. The horizontal line on left y axis shows lower range for albumin. Calculated mean ± S.D. values for dose intervals during the indicated time spans, or between two consecutive injections are presented in days. ECMb: eculizumab.
Extended Data Fig. 5
Extended Data Fig. 5. Variable dose spacing or interrupted therapy.
a, Normal serum protein levels sustained when switching from biweekly doses to monthly eculizumab injections in P1. Timing of eculizumab doses in relation to serum albumin and total protein concentrations for P1 in top panel, and immunoglobulin isotypes IgG, IgM and IgG in the bottom panel. b. Timeline plotting the incidence and severity of the indicated symptoms in P4 in relation to timing of eculizumab injection at various dosing intervals. Serum albumin levels plotted at the top of the figure with the horizontal bar showing normal range. Each arrow above the x-axis shows an eculizumab injection with the accompanying numbers illustrating days from the previous dose. The top line shows inability to feed (F) ranging from normal appetite (white) to intake completely abandoned (dark purple). The second line shows the presence (purple) or absence (white) of facial edema (E) in purple whereas the third line shows stool formation (S) on a scale from firm (white) to watery (dark grey). The fourth line quantifies the number of bowel movements (M) from 0-1 (white) to >11 (black). The fifth and sixth lines show the incidences of vomiting (V) from none (white) to >3 times per day (dark blue) and severity of nausea (N) from none (white) to severe (green), respectively. The last line shows severity of abdominal pain (P), ranging from none (white) to severe (dark brown). c. Serum albumin, total protein (T. protein), immunoglobulin G (IgG), and vitamin B12 concentrations for P3 before and after treatment at t = 0. Horizontal yellow bars for indicated parameters show normal range. Vertical dashed lines show eculizumab injections and purple bars dose skipping periods with the indicated numbers showing intervals between two consecutive injections.
Extended Data Fig. 6
Extended Data Fig. 6. Biological significance of proteomic changes in serum.
a, Top ranking pathways (Wikipathways) plotted against normalized enrichment score (Ref, ). Note, the enrichment of the pathways did not reach adjusted statistical significance level of false discovery rate (FDR) <0.05. b, Enrichment plots from pre-ranked analysis of log2 fold changes (FC) in protein abundances of patients with respect to age matched controls, showing rank-based ordering of proteins belonging to immunoglobulin Pfam domain PF13927 at baseline. Similar plots are generated for indicated Post-treatment (Post-Tx) time points using log2 FC in protein abundances calculated with respect to patient baseline values. PF13927, found to be enriched in the STRING analysis (Ref ), was added to the Wikipathways gene set to compute the normalized enrichment score (NES) and FDR.
Fig. 1 ∣
Fig. 1 ∣. The treatment effect of eculizumab in CHAPLE disease.
a, A Kaplan- Meier plot showing cumulative frequency of being without hypoproteinemia (purple), bowel obstruction (red), and thromboembolic disease (green) vs. time (years)(n = 16). b, Timeline of hospitalizations (vertical line) and albumin infusions (circles) for 11 patients pretreatment (pre-Tx)(−) and post-treatment (post-Tx)(+) time (months). Red leftward arrowheads indicate the end of the observation period. c, Heatmaps of the prevalence (% of patients, n = 16) in the study population of the indicated clinical parameter or therapeutic intervention, respectively, over the patient lifetime (past), past year pre-Tx, and the post-Tx observation period when a particular patient has been on regular eculizumab treatment. d, Serum albumin concentration before and after treatment beginning at t = 0. Horizontal bars show normal range; gray bars indicate statistical comparison range using mixed-effects analysis with Tukey’s multiple comparisons correction (n = 16). The statistical comparison of 4 vs 12 weeks revealed an adjusted P value of 0.3905 (ns = not significant). For each time point, the box plot shows the median, interquartile range, minimum and maximum values. e, Plots of weight and height (stature) z-scores compared to population averages pre-Tx and after 20 months of treatment using a paired t-test (n = 12). Gray region indicates the normal range. Z-scores were calculated using an online calculator (https://peditools.org/growthpedi/index.php) that uses CDC data tables as chart source. f, Total quality of life (QOL) score of patients using the KINDLR questionnaire (n = 9 for pre-Tx and 12 months’ assessments; n = 8 at 1-6 months). The statistical comparisons were made by Wilcoxon matched- pairs signed rank test. All P values are two-sided.
Fig. 2 ∣
Fig. 2 ∣. The gastrointestinal, circulatory, hematologic and metabolic manifestations of CHAPLE disease with or without eculizumab.
a, Duodenal endoscopy images pretreatment (pre-Tx) showing white lymph globules due to lymphangiectasia (red arrows) and lymph leakage imparting a grayish color to the mucosa and after 14 months of treatment showing lymphangiectasia replaced by normal mucosa. b, Mean total weekly scores as defined in the Methods for the indicated parameters in each patient during the pre-Tx (0), 0-4 weeks and 4-14 weeks post-treatment (post-Tx) are plotted. Statistics used the Friedman test and Dunn’s multiple comparisons test (two-sided P value; n = 13 patients at each time point). I.F. = inability to feed, B.M. = number of bowel movements. c, Vitamin B12 concentration in serum before and after treatment beginning at t = 0 (n = 9). d, Serum immunoglobulin (IgG) concentration before and after treatment beginning at t = 0 (n = 15 for pre-Tx and 2-4 months’ assessments; n = 13 for 1-month assessment). e, Calculated mean and standard deviation for intra-patient repeated measurements of fasting blood triglyceride concentrations during pre-Tx periods or the indicated number of months Post-Tx for each patient (n = 15). In d and e statistical comparisons were made by mixed effects analysis and Dunnett’s multiple comparisons test (two-sided P value). f, Mean and standard deviation values for multiple platelet count measurements obtained in each patient during the pre-Tx period or the indicated number of months Post-Tx. Two-sided P values are calculated from Wilcoxon matched-pairs signed-rank test, based on the calculated means of multiple measurements for a given interval (n = 11 patients). g, Photographs of representative pre-Tx samples from P7 or normal control (NC) showing erythrocytes abnormally infiltrating the supernatant (green arrows) during Ficoll gradient separation of PBMCs and disappearance of this phenotype post-Tx. h, Summary of radiological features before and after treatment. Red (+) shows presence of the sign and light blue (−) indicates absence. N/A means radiological studies not available. *P7 had voluminous abdominal fluid before therapy that resolved following treatment (not shown). Shaded areas in c-f show normal range.
Fig. 3 ∣
Fig. 3 ∣. Serum eculizumab concentration, total C5 and functional complement inhibition during the induction and maintenance phases of treatment.
a-b, Eculizumab and total C5 concentrations with respect to timing of therapy during the indicated periods. The respective exact P values comparing 9±2 vs. 14±2 days was 0.9803 (ns = not significant) in a, and controls vs untreated patients was 0.9926 (ns = not significant) in b. c-d, Pooled analyses of patient samples showing total C5 and CH50 levels across the range of eculizumab concentrations. e, CH50 and AH50 levels with respect to timing of therapy during the indicated periods. f, CH50 values with respect to number of cycles on the standard biweekly dosing intervals or the modified monthly-dosing regimen in selected cases. Error bars indicate mean and S.D. values. Multiple group comparisons were made by ordinary one-way ANOVA test. During post hoc analyses, Dunnett's multiple comparisons test analyzed differences between the standard 14 ± 2 days group with others in the maintenance pooled analyses in a and b, and patient (PT) untreated values with other groups in b and e, during the induction period, respectively. Adjusted P values for multiple testing are indicated. The P value comparing the controls vs untreated patients was 0.9795 (ns = not significant) in e. The number of samples investigated for each parameter were as follows: Total C5: 19 healthy controls and 114 samples from 15 CHAPLE patients; eculizumab concentrations: 96 samples from 15 patients; CH50: 14 healthy controls and 121 samples from 15 patients; AH50: 9 healthy controls and 25 samples from 13 patients. ECMb: eculizumab.
Fig. 4 ∣
Fig. 4 ∣. Blood concentrations of complement proteins and their activated products before and during eculizumab treatment.
a, Pathway schematic of the complement system. iC3b = inactivated C3b, FI = complement factor I. CFH = Complement factor H. MASP = mannose-associated serine protease. b, Summary of alterations in selected circulating complement markers in CHAPLE patients. Arrows indicate the direction of change, if any: ↓(decrease), ↑(increase), or →(no change). N = Normal. c, Blood concentration in grams/liter (g/L) of intact C3 and C4, at baseline and during eculizumab treatment. Mean of repeated measurements at each time interval was plotted for individual patients. A mixed-effects model assessed the significance between values at different time points, with Tukey’s multiple comparisons test calculating adjusted P values for each pair (n = 15 patients). d, Serum C4 levels in relation to estimated Complement C4 gene copy numbers based on C4 WGS coverage. WGS: Whole-genome sequencing. In c and d, horizontal dashed lines show reference ranges. e-j, Blood concentration of complement products generated during complement activation at baseline and after eculizumab treatment. k, The soluble phase inhibitor CFH levels at baseline and during treatment. Statistics used to compare C3a between the three groups included an ordinary one-way ANOVA and the Tukey’s multiple comparisons test. Adjusted P values are indicated. Mann Whitney (for comparing AMC vs patient baseline values), and Wilcoxon matched-pairs signed rank tests (between patient baseline vs different post-treatment time points) analyzed the differences between groups in f-k (n = 8 control subjects and n = 8 patients, for each analysis). Red dashed symbols filled with blue in h-j indicate values that correspond to dropped eculizumab concentrations after dose skipping. All P values are two-sided. Sample size for C3a: 16 AMC, 21 untreated-, and 13 treated- patients. Error bars indicate mean and standard deviation. AMC= age-matched control.
Fig. 5 ∣
Fig. 5 ∣. Microbiota composition shifts in eculizumab treated CHAPLE patients.
a, Shannon alpha diversity increases pre- and post-eculizumab treatment are shown. Longitudinal samples from the same patient are connected by dotted lines. A statistical trend toward increased Shannon diversity is seen post-eculizumab treatment (linear mixed effects unadjusted P = 0.09). b, Principal Coordinates Analysis (PCoA) based on Bray-Curtis beta diversity metric of bacterial taxonomic abundances showing clustering by pre- and post-treatment time points (PERMANOVA P = 0.03). Centroids of community distances for each time point group are shown as diamonds. c, Bray-Curtis dispersions (scaled distance from centroid) within each time point group (ANOVA P = 0.00066). d, Enterobacteriaceae (linear mixed effects [LME] P = 0.013, false discovery rate Q=0.099), and e, Bifidobacteriaceae family abundances (LME P = 0.012, Q = 0.096), and f, Faecalibacterium prausnitzii species abundances (LME P = 0.019, Q = 0.08) across time in CHAPLE patients. In a and c-f, the center bar denotes the median, the boxes denote interquartile range, and the whiskers denote the interquartile range × 1.5. The mean of multiple assessments is used for analysis if there are more than one measurement for an individual during a particular time period. ns = not significant. n = 6 patients for all analyses. Q value: a P value that has been adjusted for the False Discovery Rate.
Fig. 6 ∣
Fig. 6 ∣. Serum proteins altered in patients and response to eculizumab therapy.
a, Compared to healthy age-matched controls (AMC), patients at baseline showed 94 proteins with differences significant at P < 0.05 (two-sided) after correcting for multiple testing of all 1305 proteins measured. 26 of these proteins were downregulated and 68 were upregulated in the patients. b, Comparing baseline to post-treatment timepoints for the patients up to day 59, showed 41 proteins with differences significant at P < 0.05 (two-sided) after correcting for multiple testing of the 94 proteins analyzed due to a difference at baseline. All 41 proteins changed towards the level observed in healthy controls. c, Principal component analysis (PCA) plots using all 94 proteins or separately those down- or up-regulated in patients at baseline. d, Serum IGFBP2 concentrations. Statistics used an ordinary one-way ANOVA with Dunnett’s multiple comparisons correction (Number of samples were: 12 AMC, 20 unrelated processing controls (PC), 36 parent samples, 20 samples from 14 untreated patients, 61 samples from 8 patients post-treatment). Error bars indicate mean and S.D. values. e, Top, and bottom 5 proteins, ranked according to calculated log2 (FC = Fold change) values, either in reference to controls (at baseline), or to pretreatment levels in the patients at the indicated time points (during eculizumab treatment). f, Erythropoietin receptor (EPOR) levels in relative fluorescence units (RFU) are shown. Comparison of healthy controls to baseline was made by Mann-Whitney test and intrapatient comparisons by Wilcoxon matched-pairs signed-rank test (two-sided P value; n = 8 patients, and 8 AMC in a-d and f). The violin plots show the distribution of values across the minimum to maximum range. Protein measurements were performed on the SOMAlogic platform except for IGFBP2 in d, which was determined by ELISA. ECMb: eculizumab.

Comment in

References

    1. Waldmann TA, Steinfeld JL, Dutcher TF, Davidson JD & Gordon RS Jr. The role of the gastrointestinal system in "idiopathic hypoproteinemia". Gastroenterology 41, 197–207 (1961). - PubMed
    1. Ozen A et al. CD55 Deficiency, Early-Onset Protein-Losing Enteropathy, and Thrombosis. N Engl J Med 377, 52–61 (2017). - PMC - PubMed
    1. Kurolap A et al. Loss of CD55 in Eculizumab-Responsive Protein-Losing Enteropathy. N Engl J Med 377, 87–89 (2017). - PubMed
    1. Ozen A CHAPLE syndrome uncovers the primary role of complement in a familial form of Waldmann's disease. Immunol Rev 287, 20–32 (2019). - PubMed
    1. Mevorach D Clearance of dying cells and systemic lupus erythematosus: the role of C1q and the complement system. Apoptosis 15, 1114–1123 (2010). - PubMed

Methods-only References

    1. Tezcan I, Berkel AI, Ersoy F & Sanal O Sağlıklı Türk çocukları ve erişkinlerde turbidometrik yöntemle bakılan serum immunoglobulin düzeyleri. Çocuk Sağlığı ve Hastalıkları Dergisi 32, 649–656 (1996).
    1. Slenter DN et al. WikiPathways: a multifaceted pathway database bridging metabolomics to other omics research. Nucleic Acids Research 46, D661–D667 (2017). - PMC - PubMed
    1. Subramanian A et al. Gene set enrichment analysis: A knowledge-based approach for interpreting genome-wide expression profiles. Proceedings of the National Academy of Sciences 102, 15545–15550 (2005). - PMC - PubMed
    1. Szklarczyk D et al. STRING v11: protein-protein association networks with increased coverage, supporting functional discovery in genome-wide experimental datasets. Nucleic acids research 47, D607–D613 (2019). - PMC - PubMed
    1. Goddard TD et al. UCSF ChimeraX: Meeting modern challenges in visualization and analysis. Protein Sci 27, 14–25 (2018). - PMC - PubMed

Publication types

MeSH terms