. 2021 Feb;22(2):205-215.
doi: 10.1038/s41590-020-00834-9. Epub 2021 Jan 4.

Mitochondrial stress induced by continuous stimulation under hypoxia rapidly drives T cell exhaustion

Affiliations

Mitochondrial stress induced by continuous stimulation under hypoxia rapidly drives T cell exhaustion

Nicole E Scharping et al. Nat Immunol. 2021 Feb.

Abstract

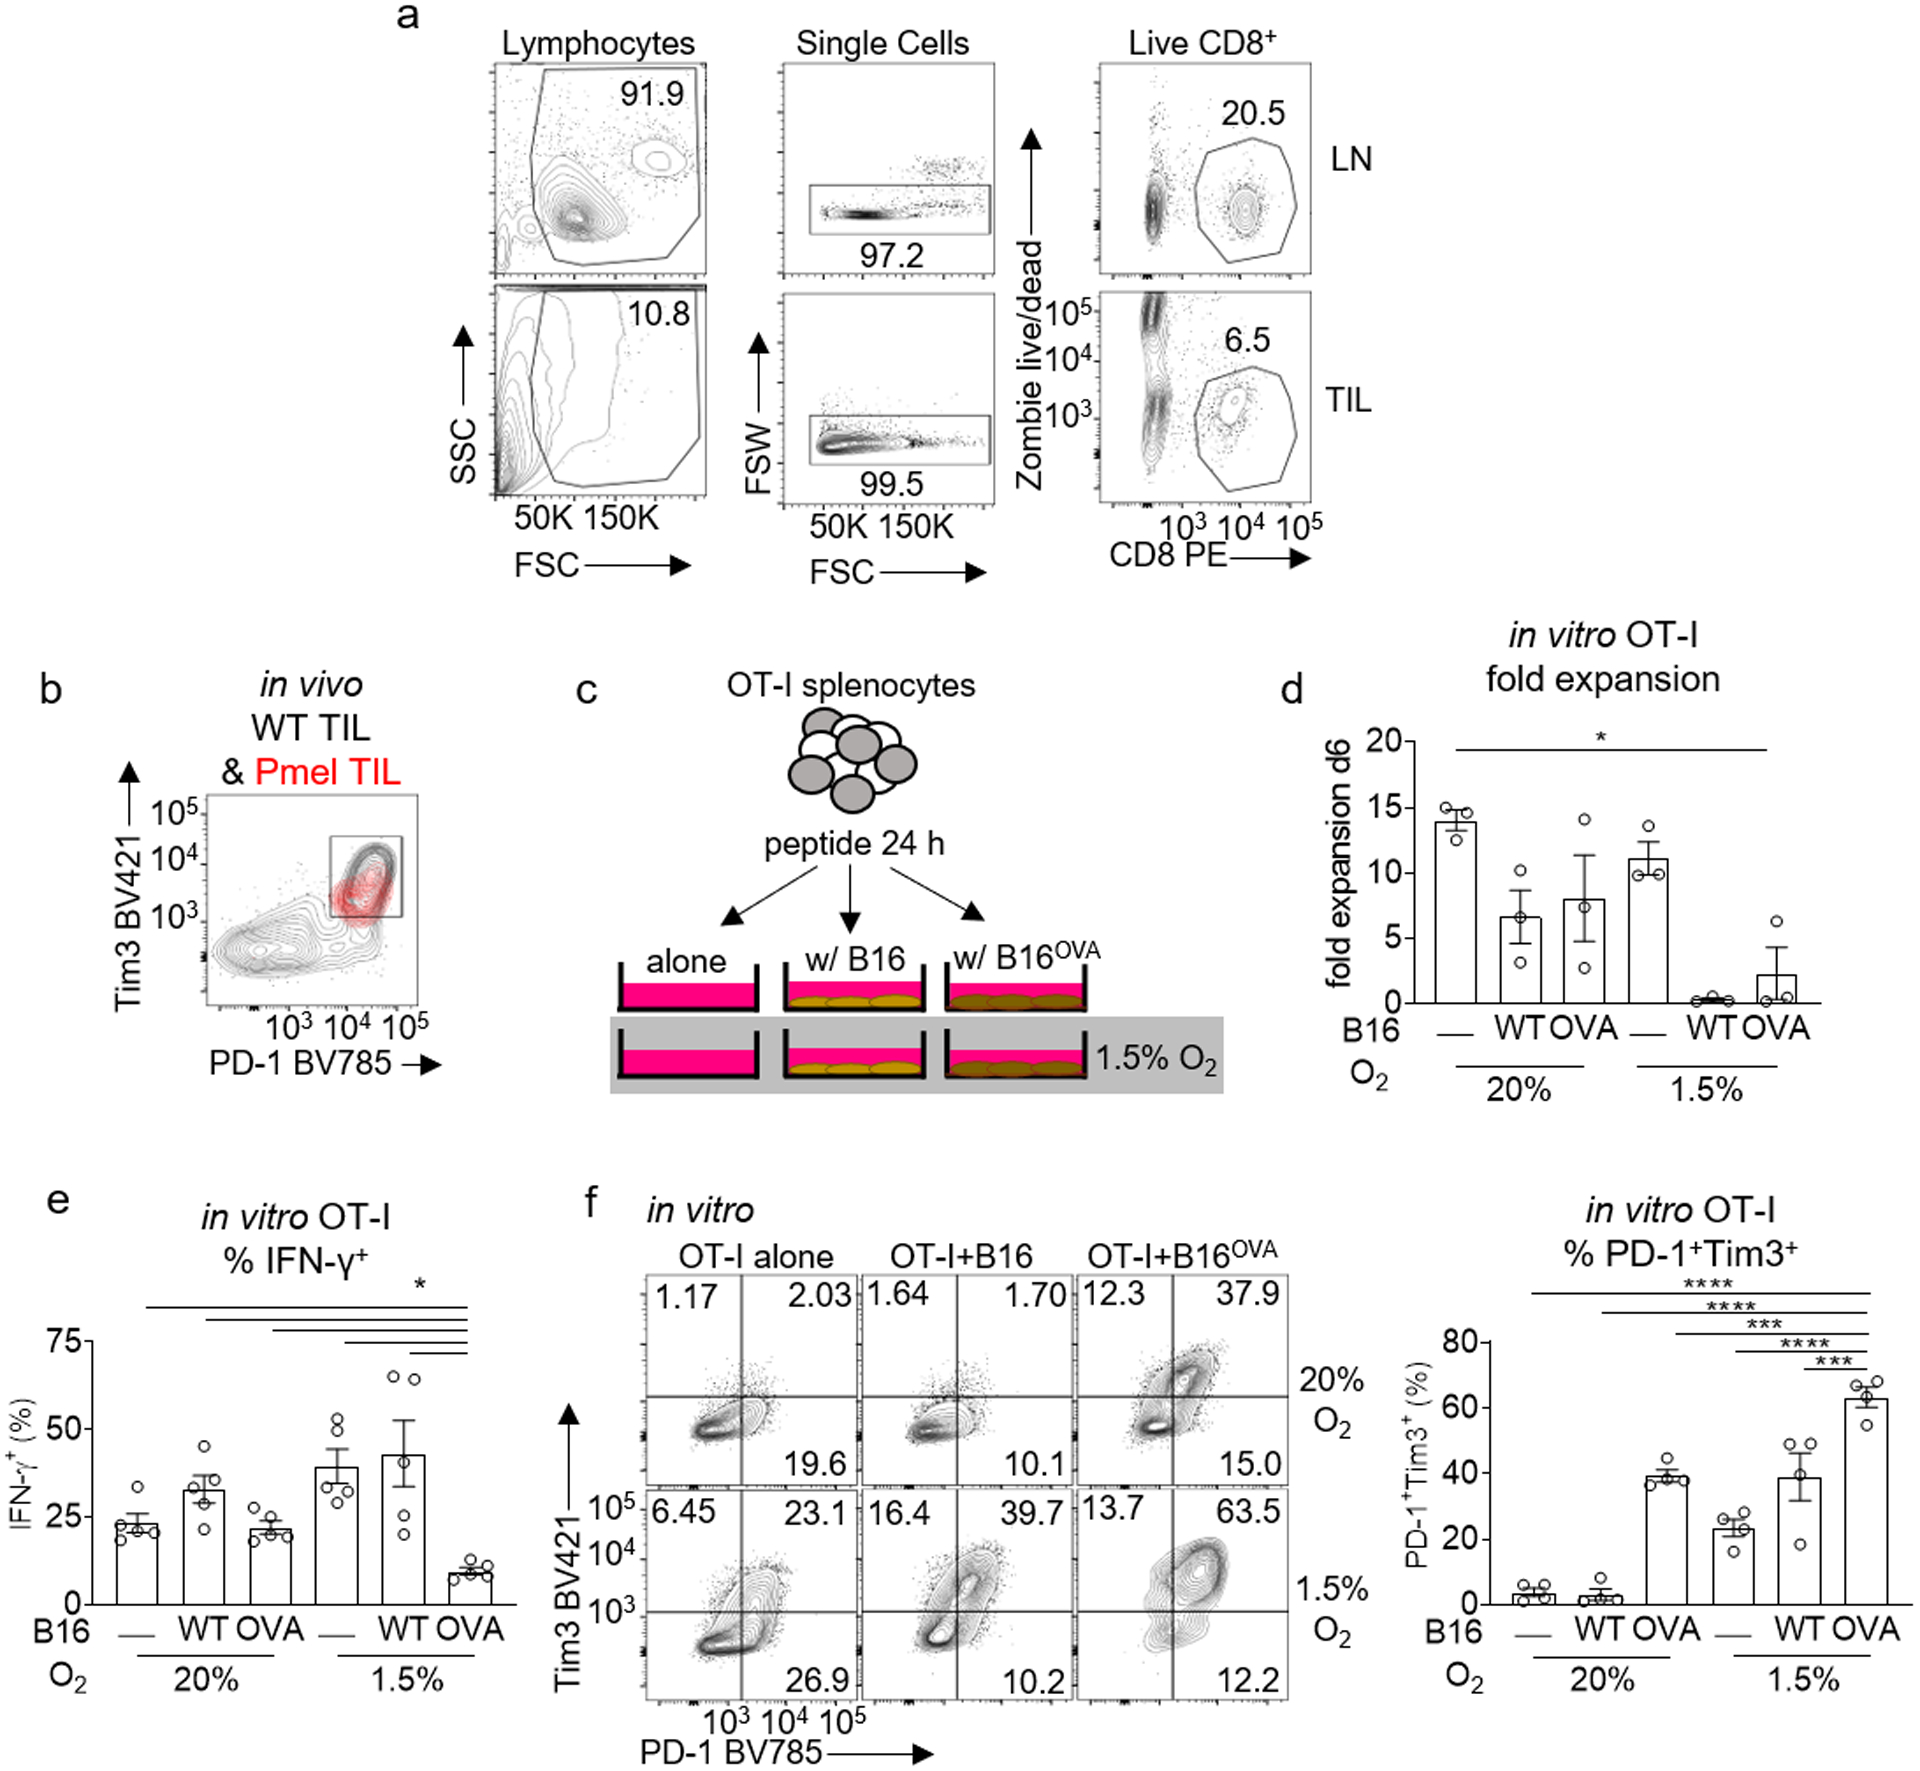
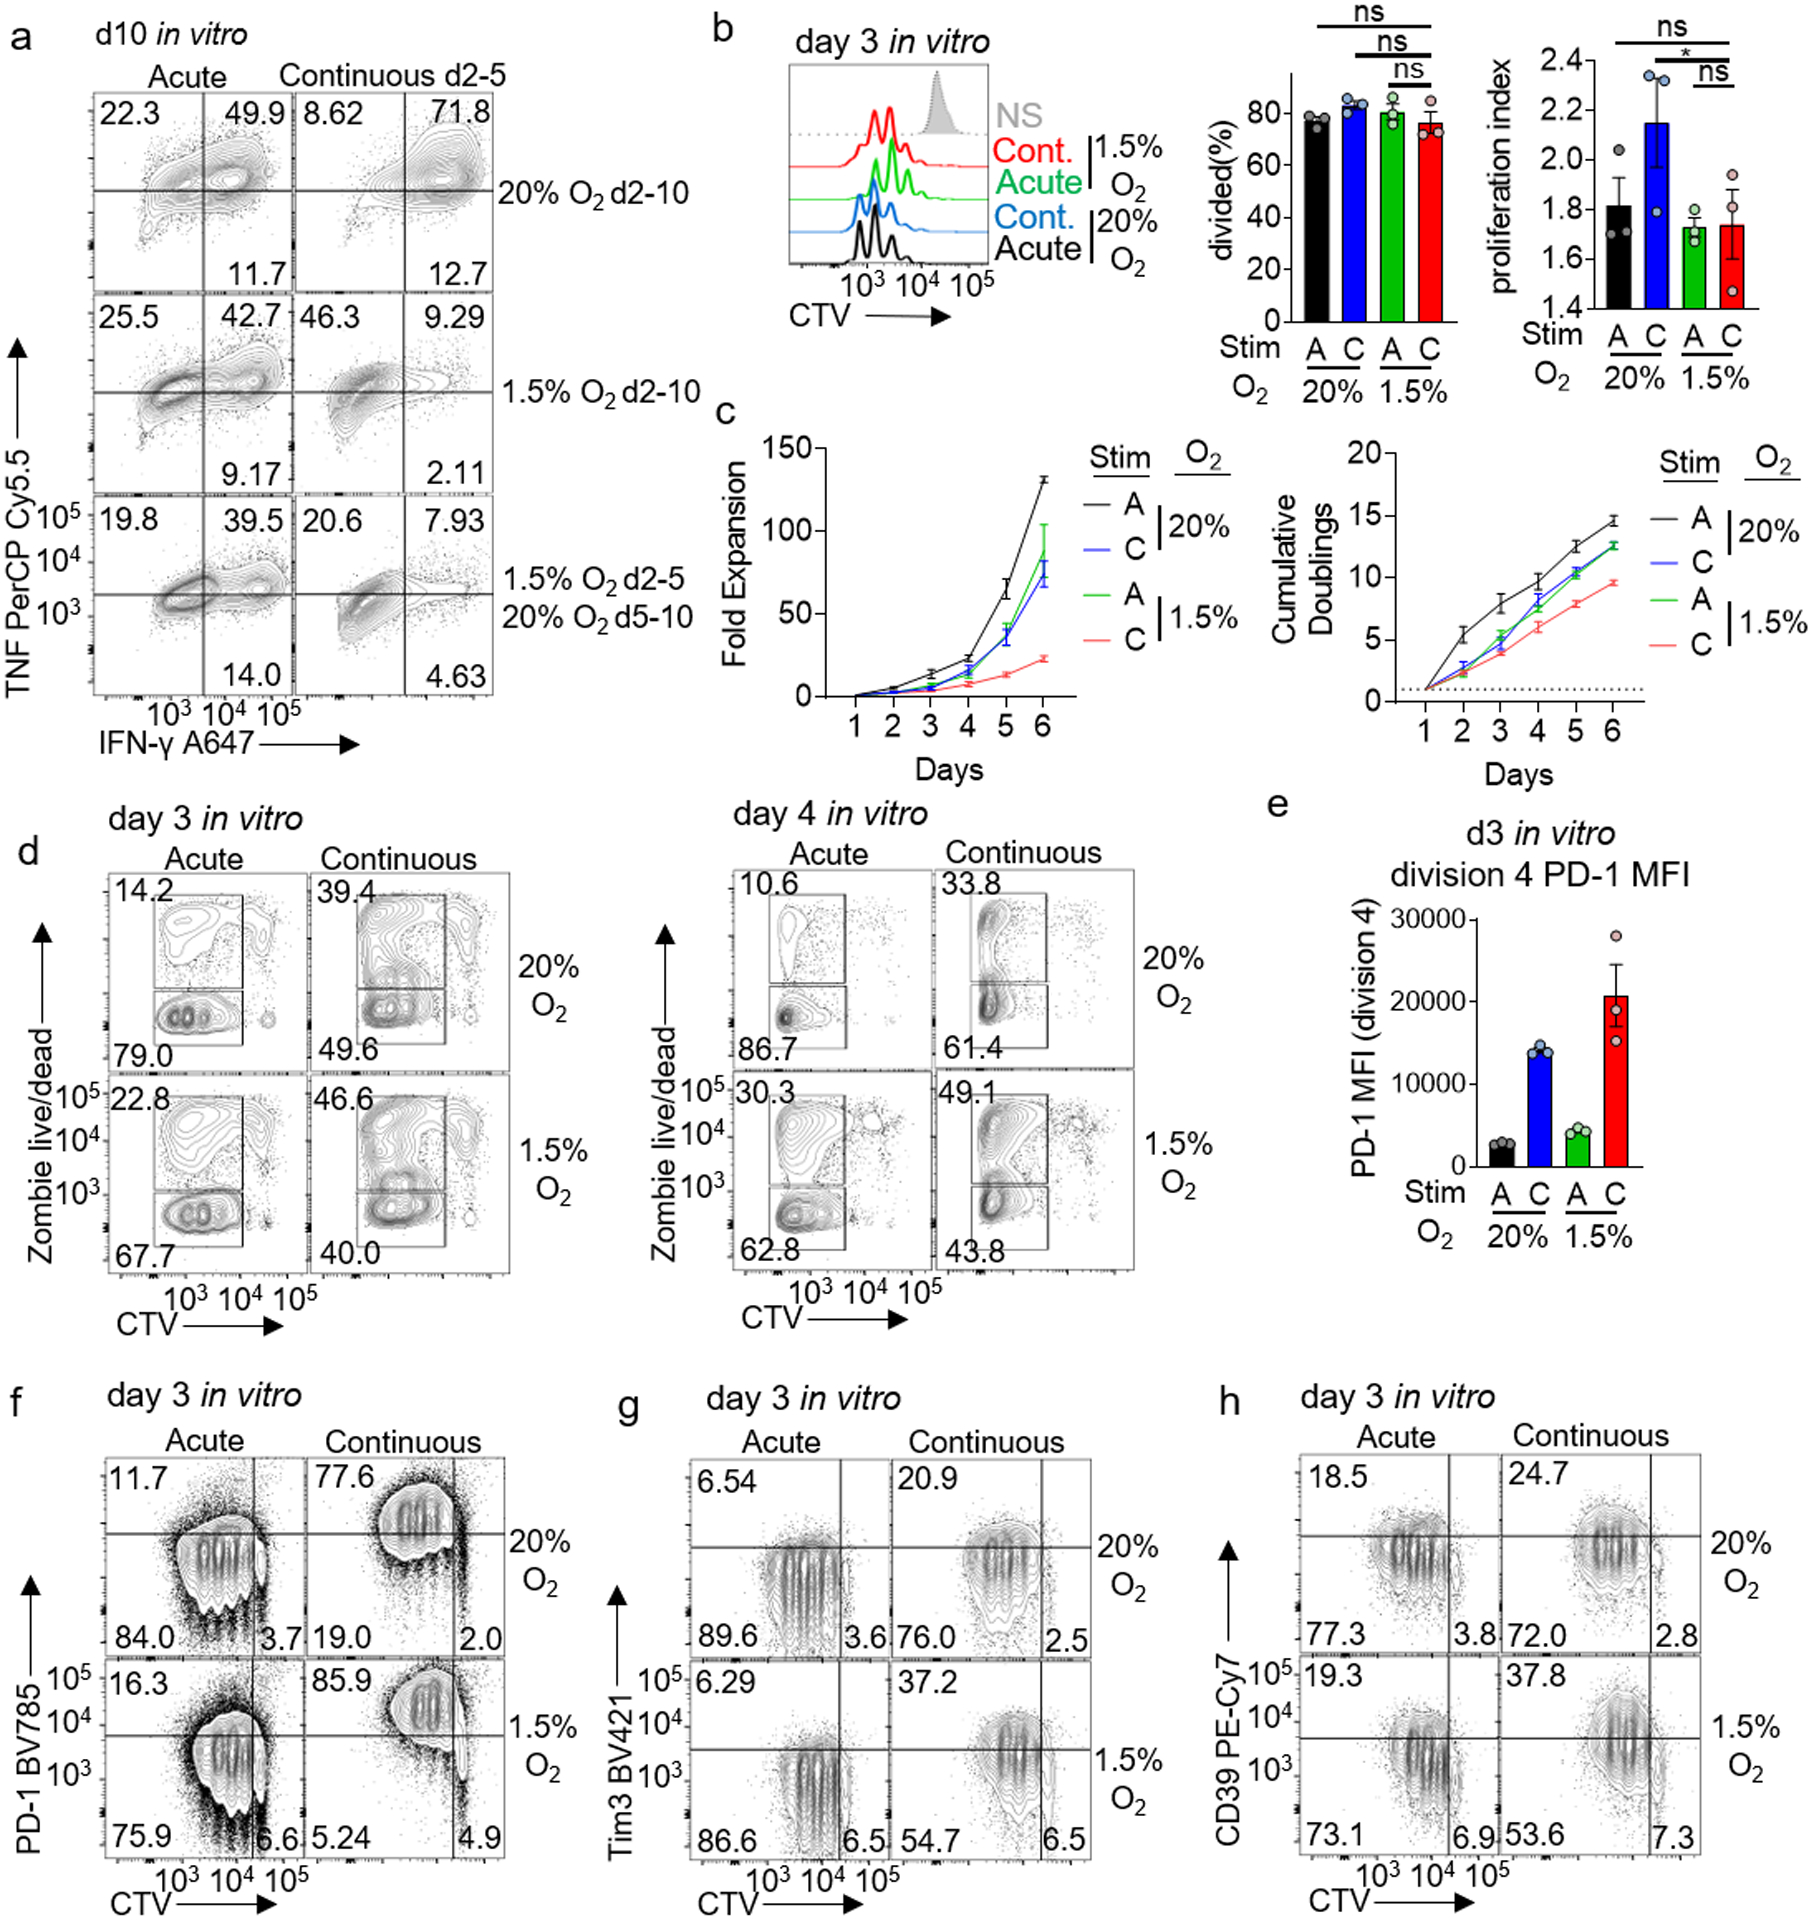
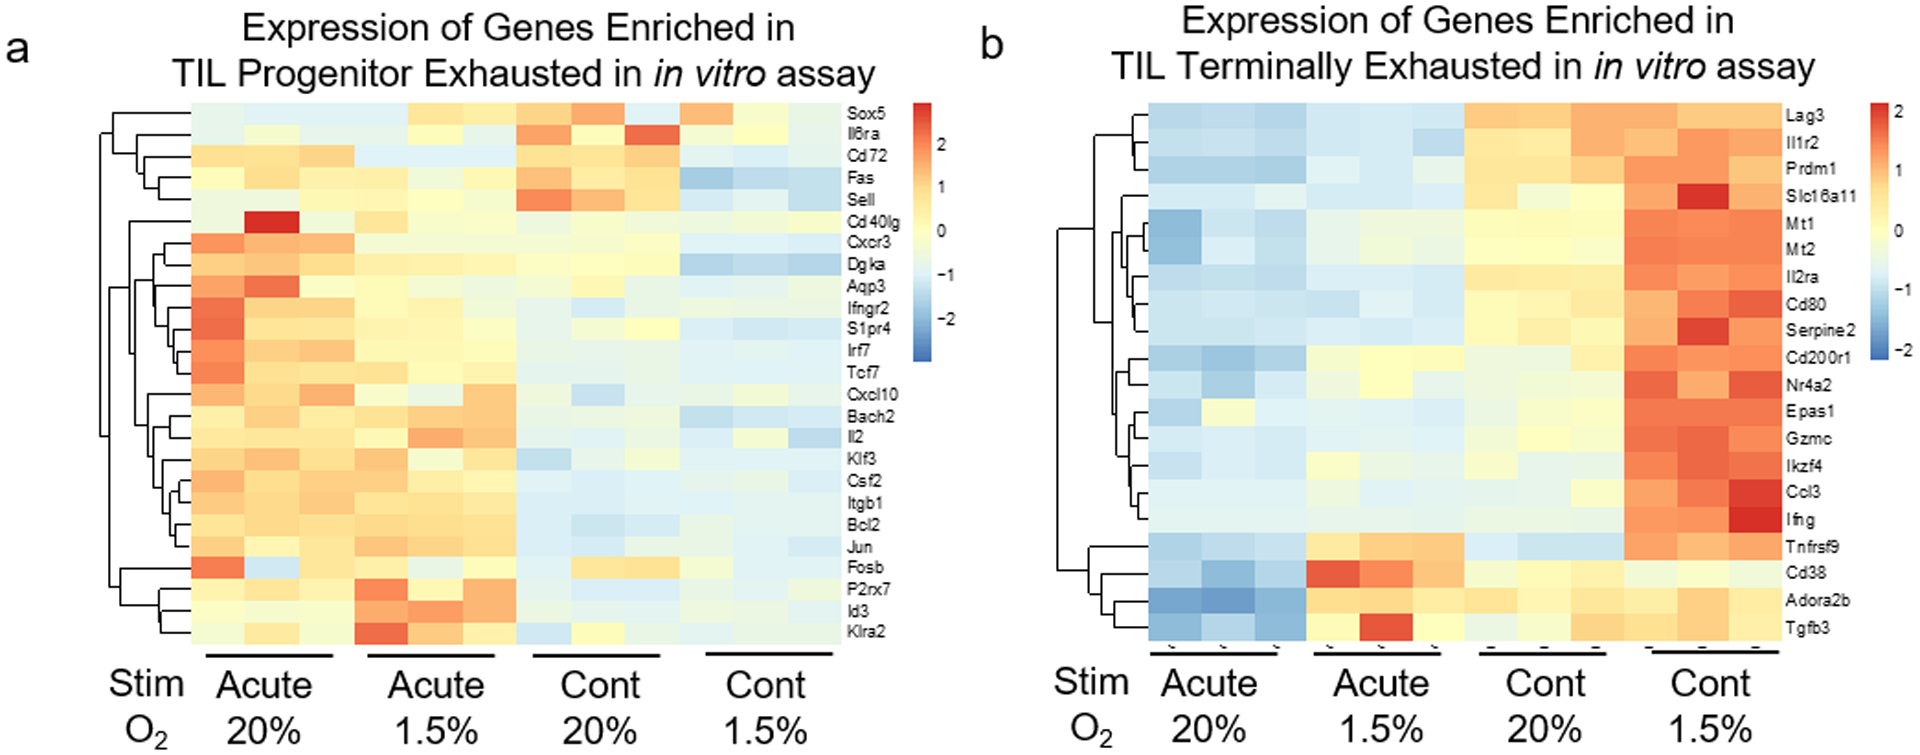
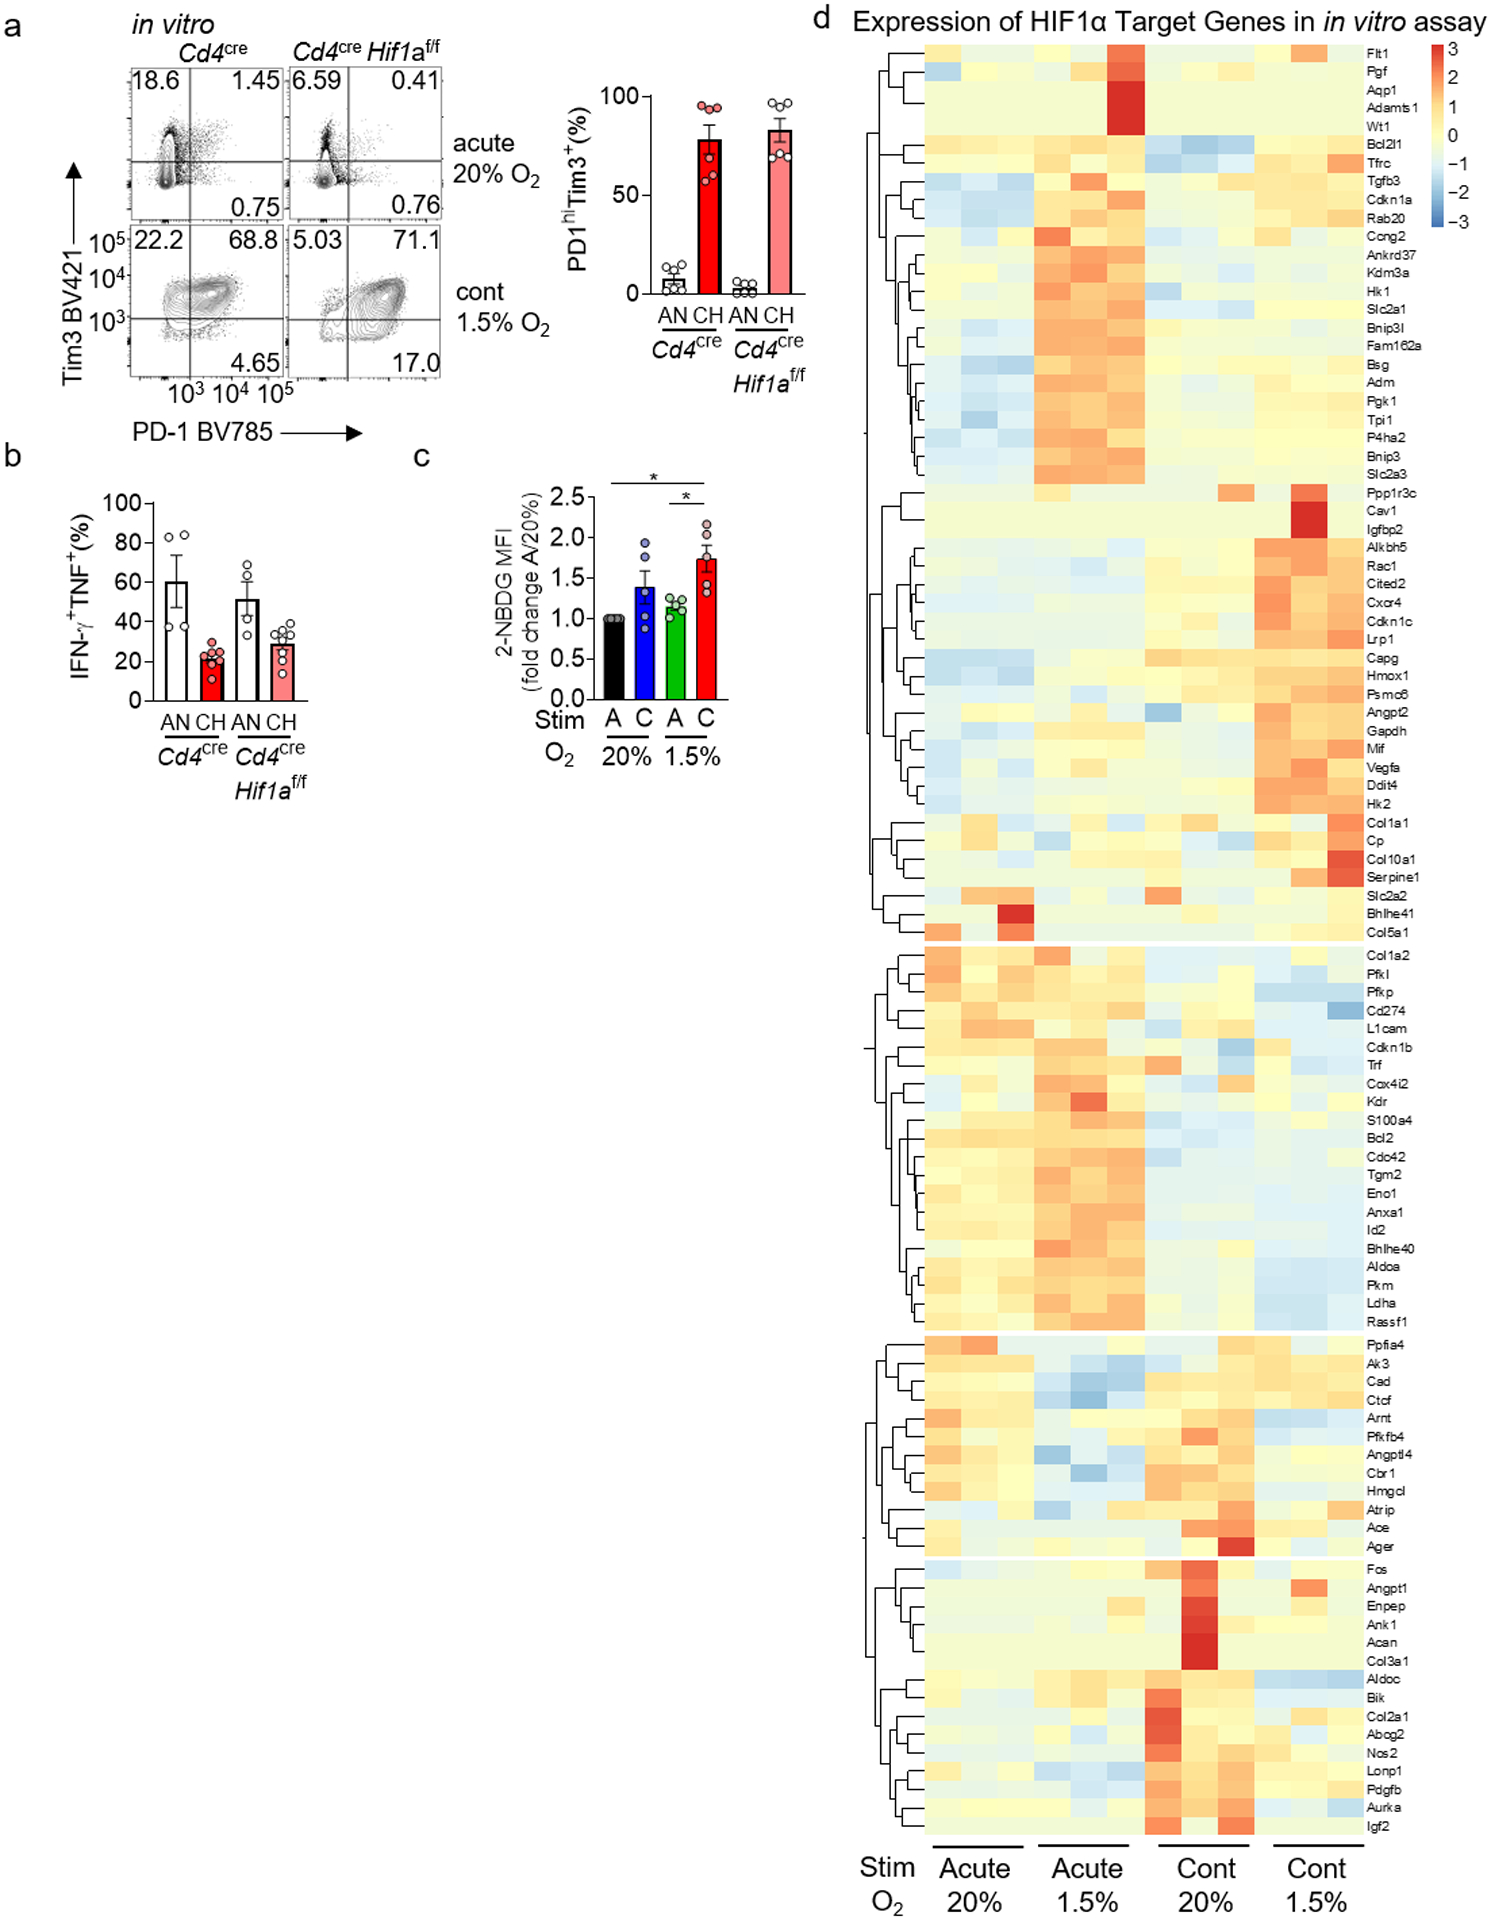
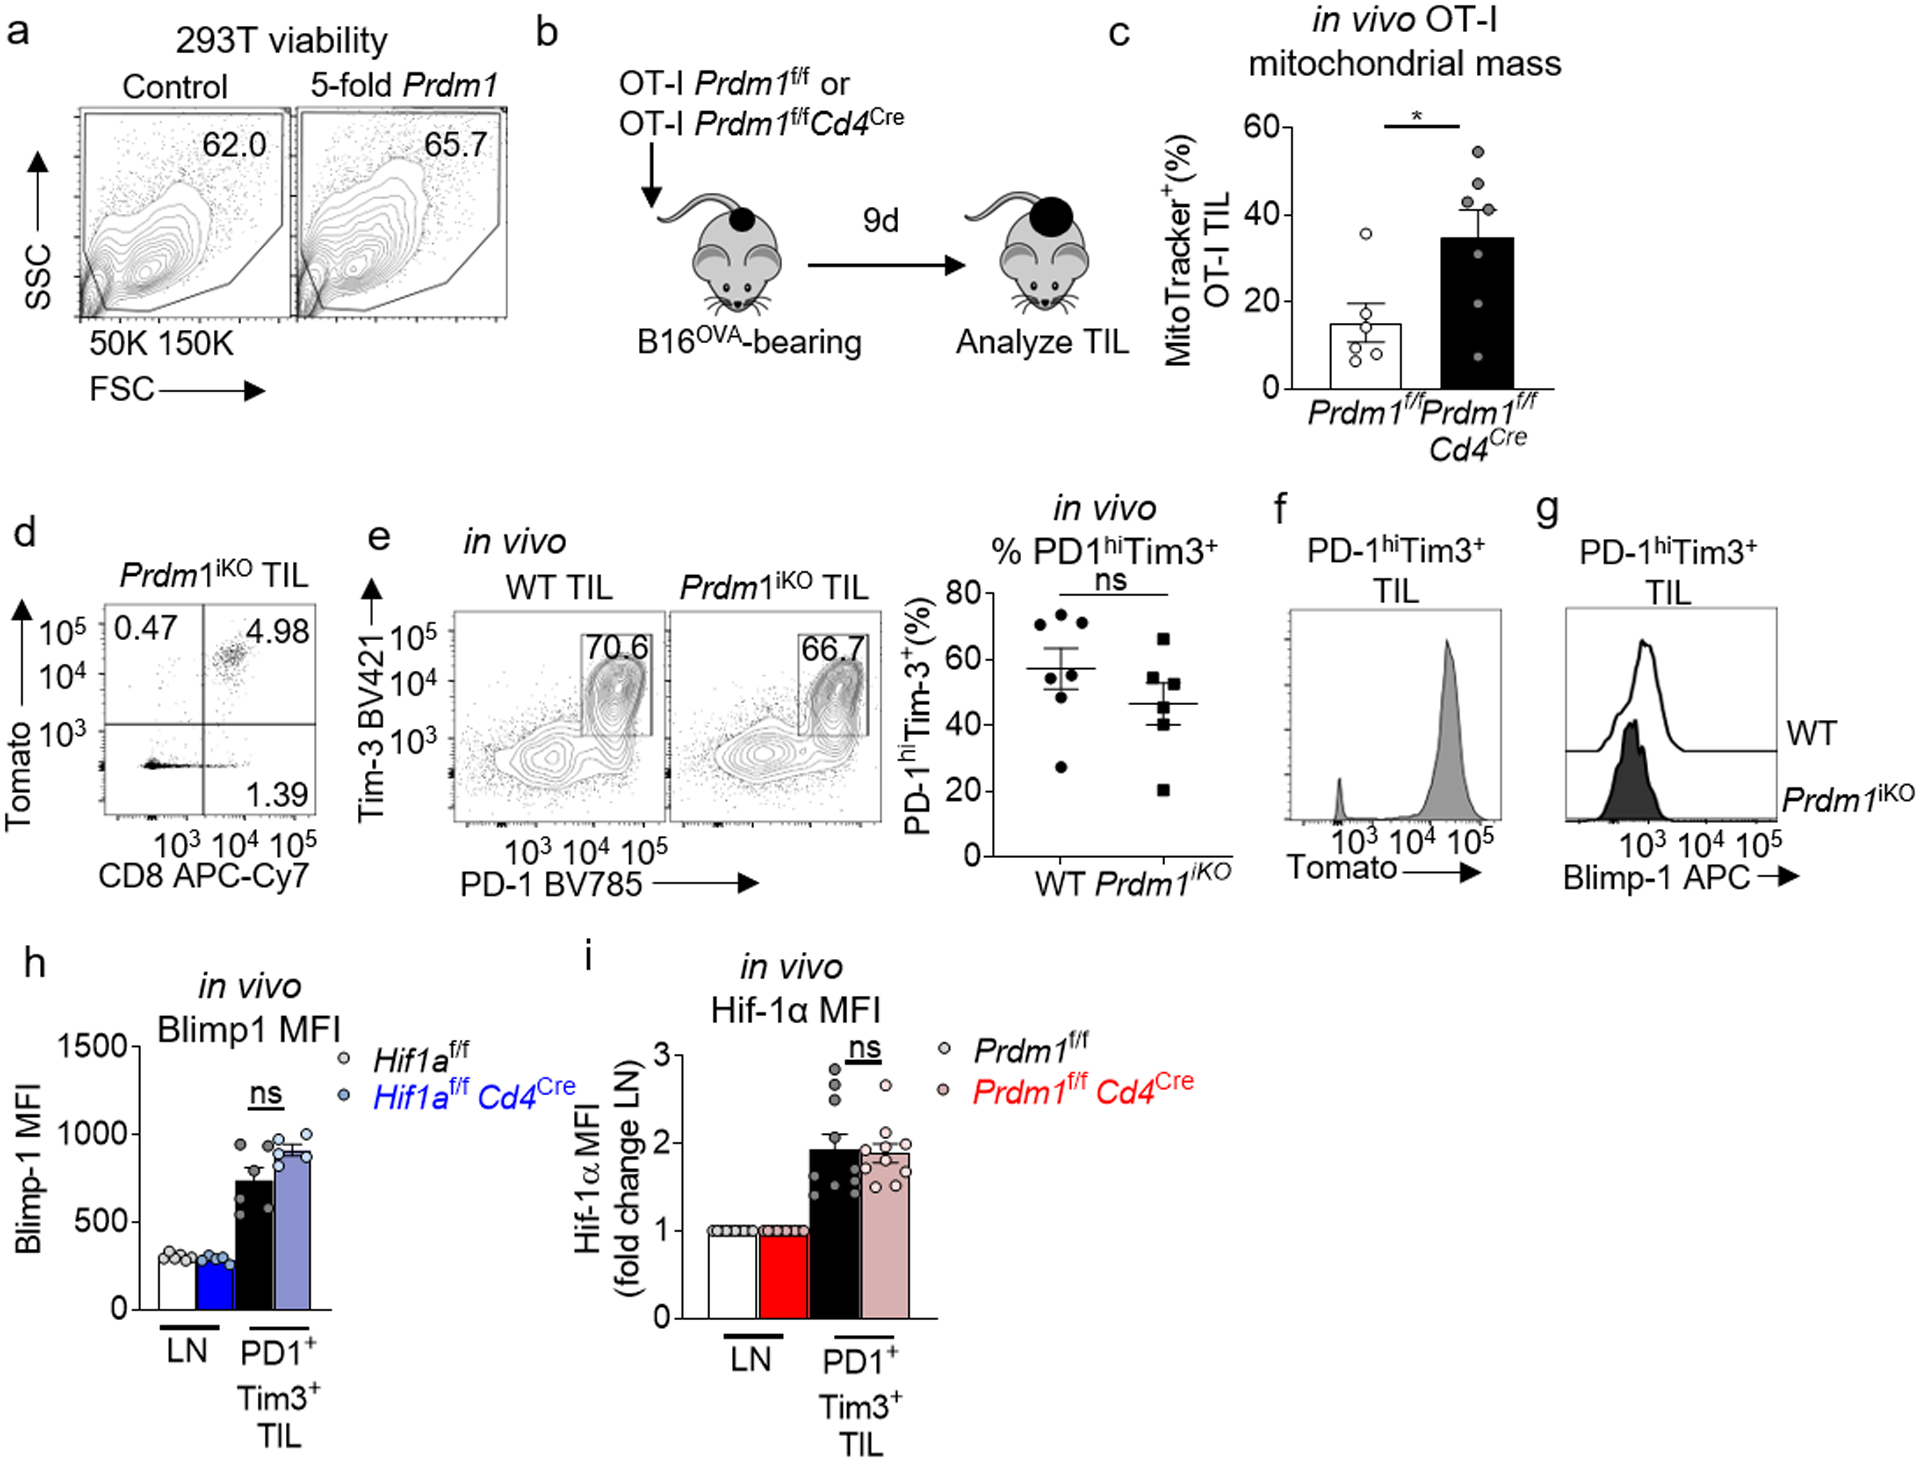
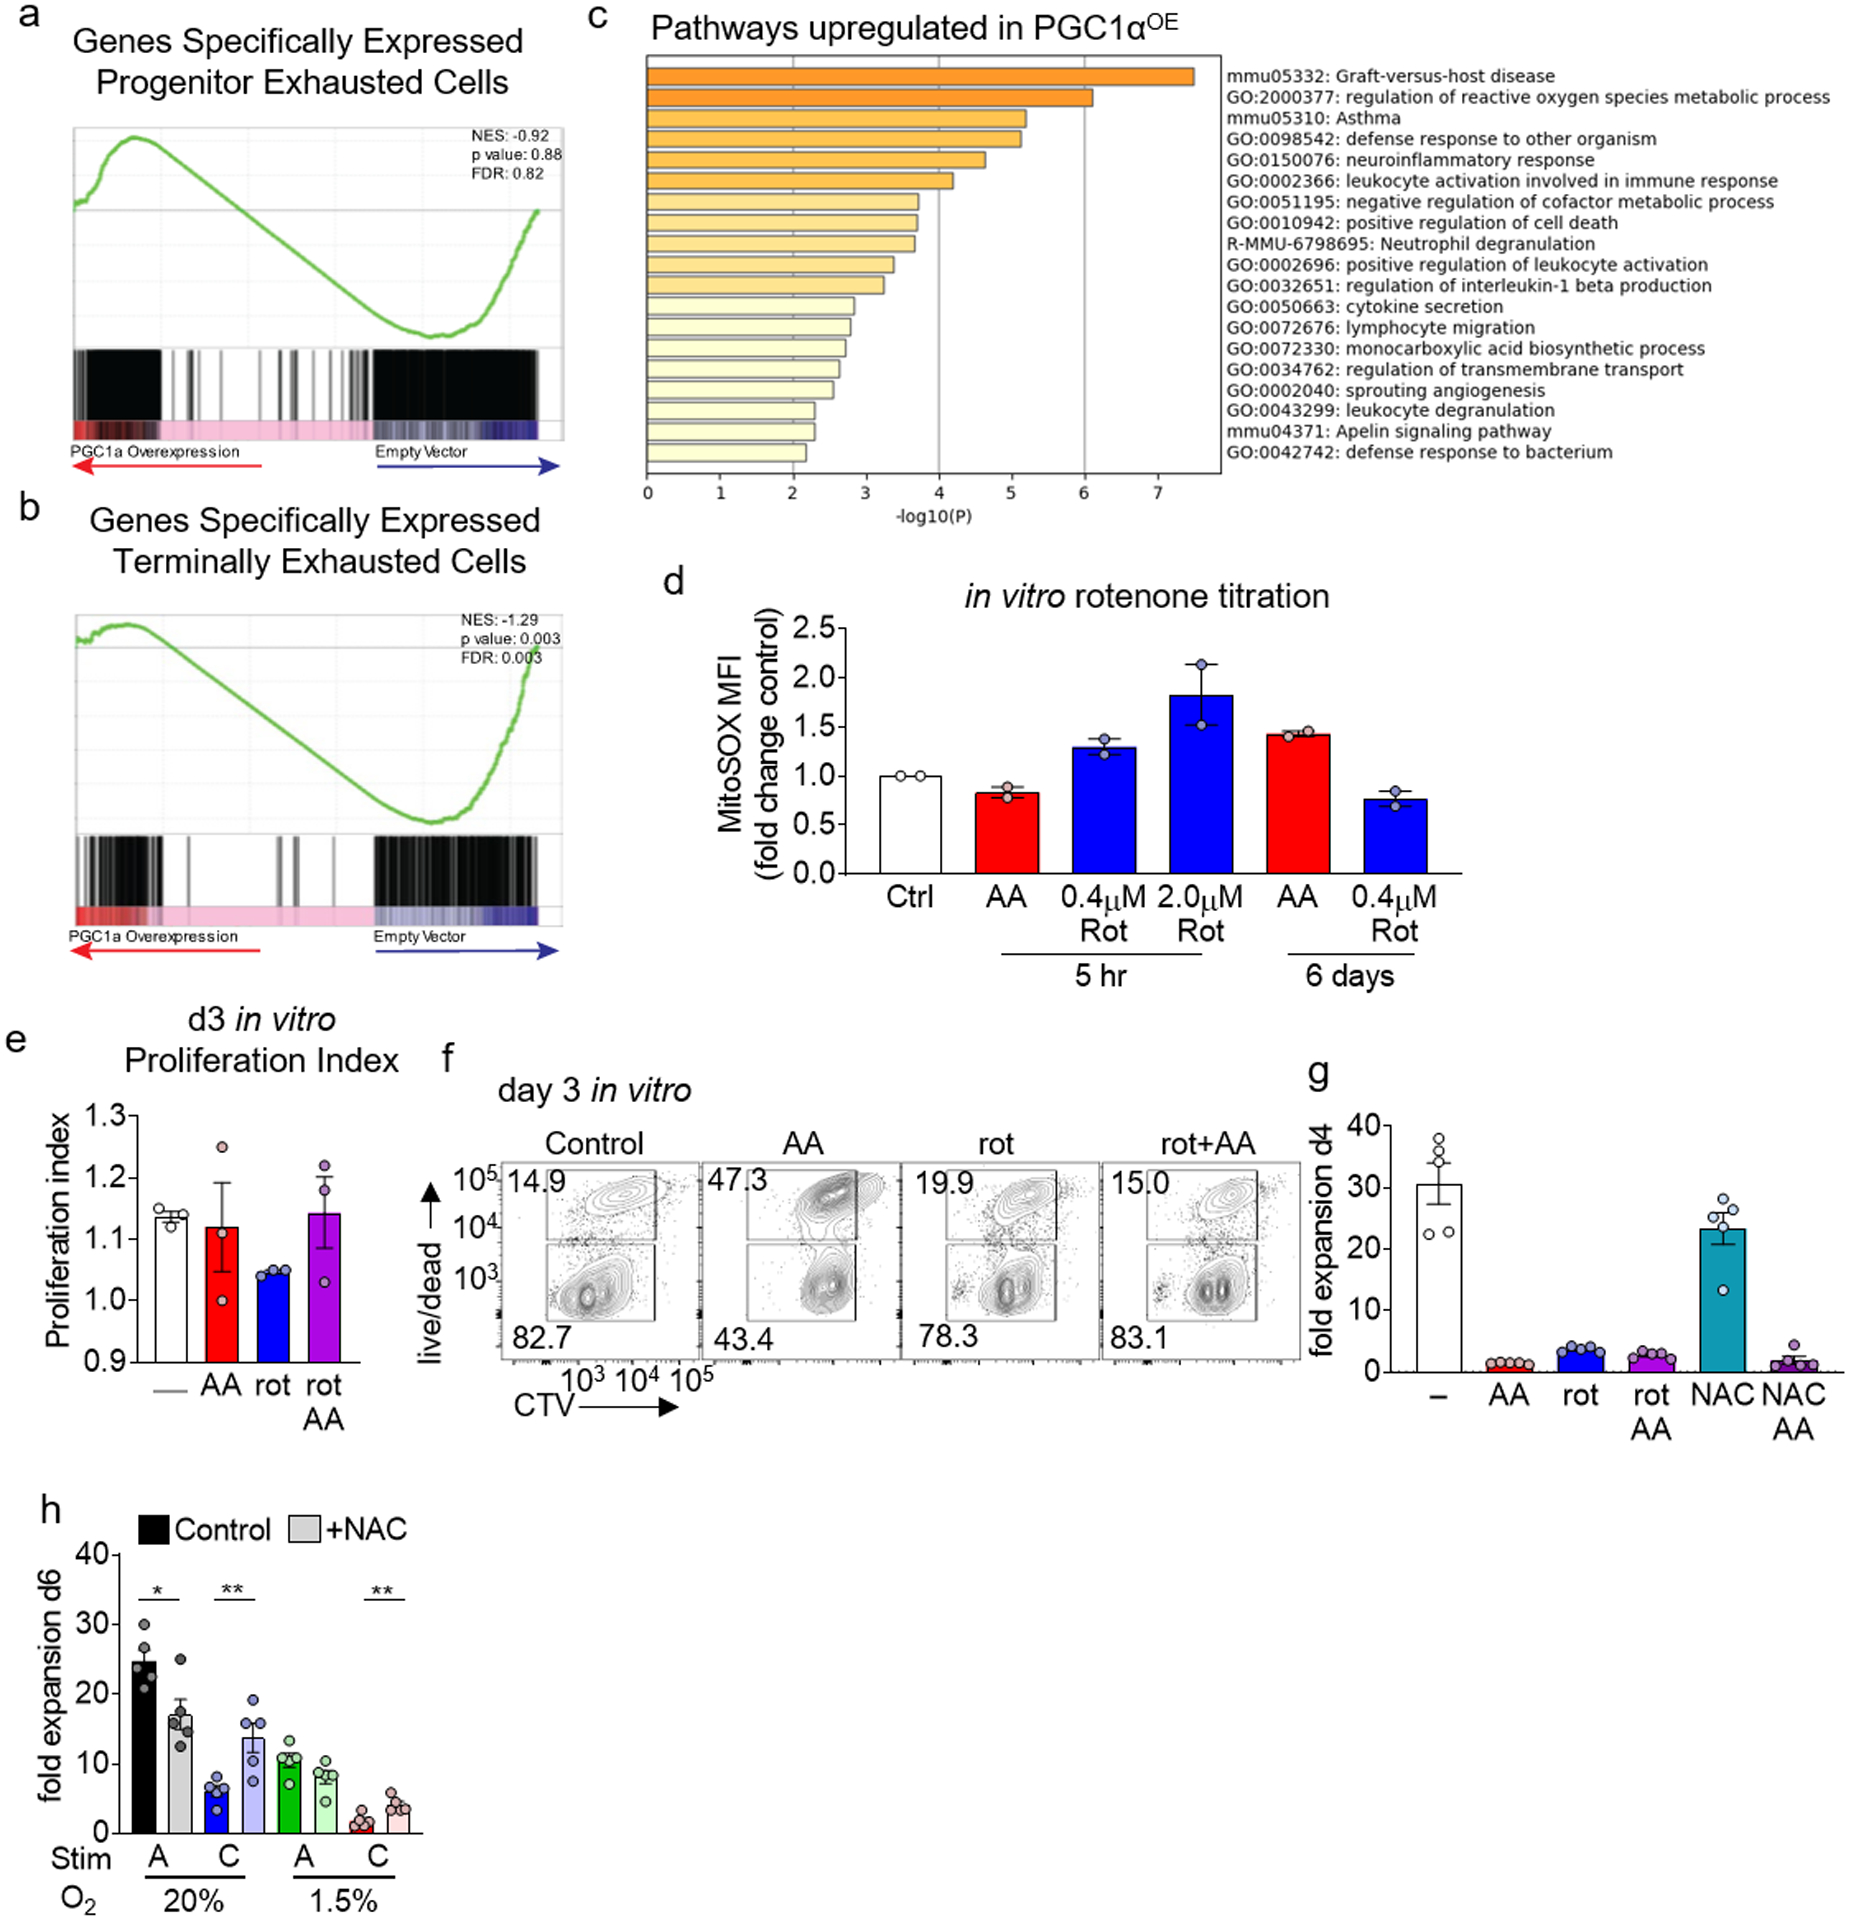
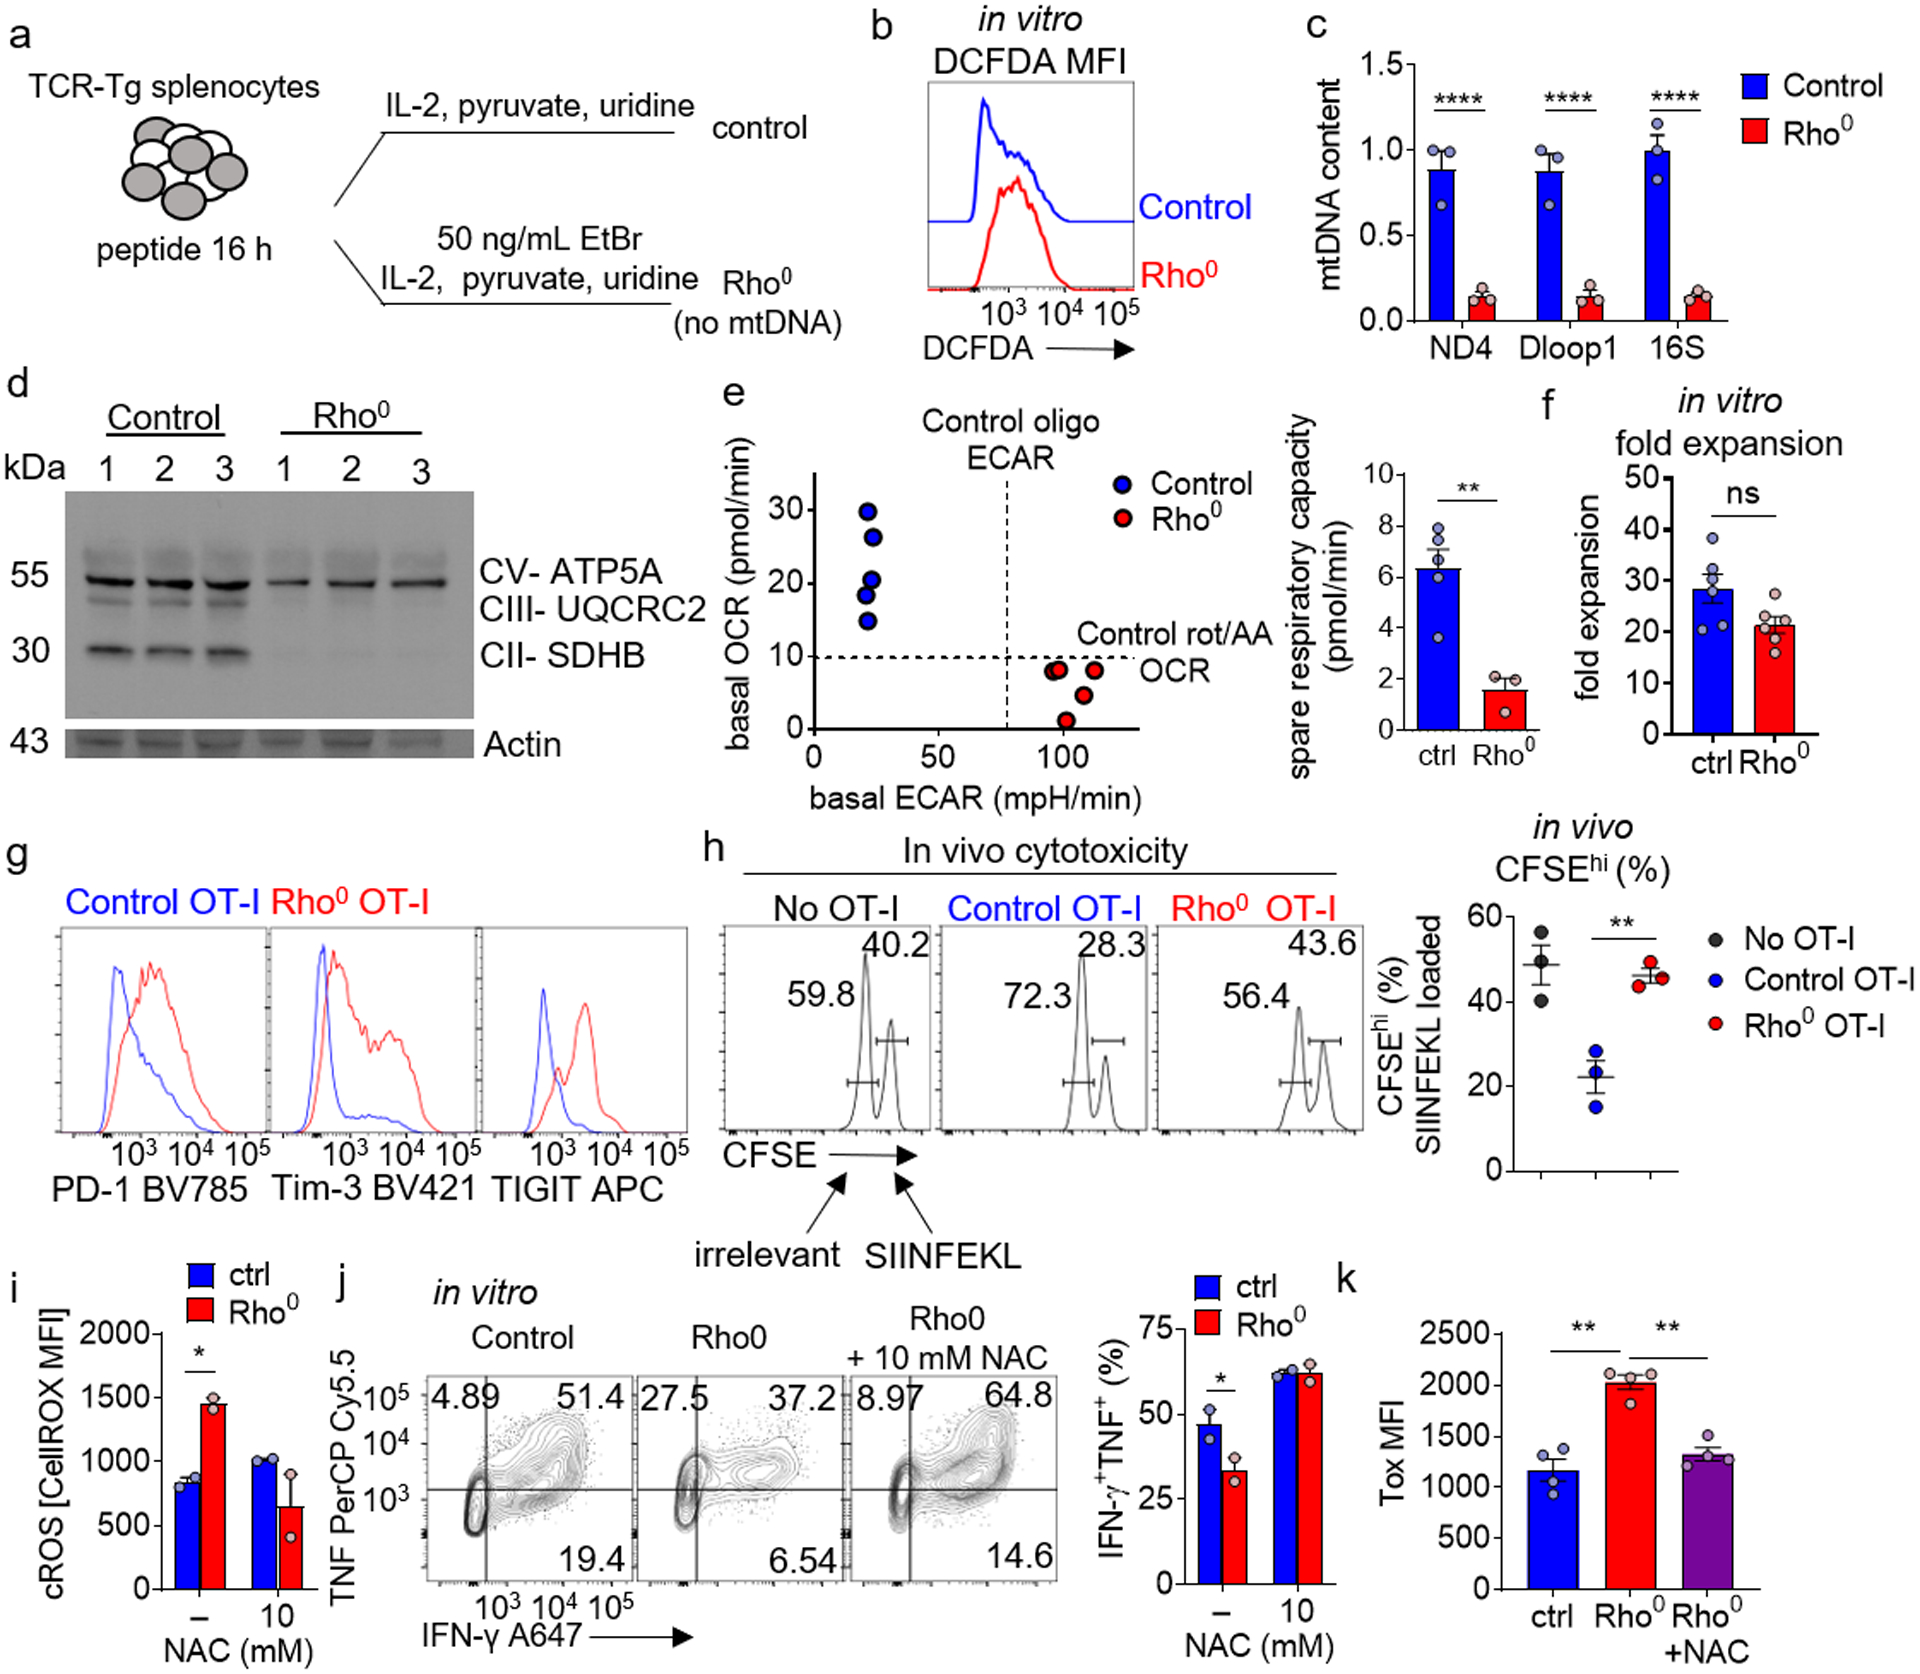
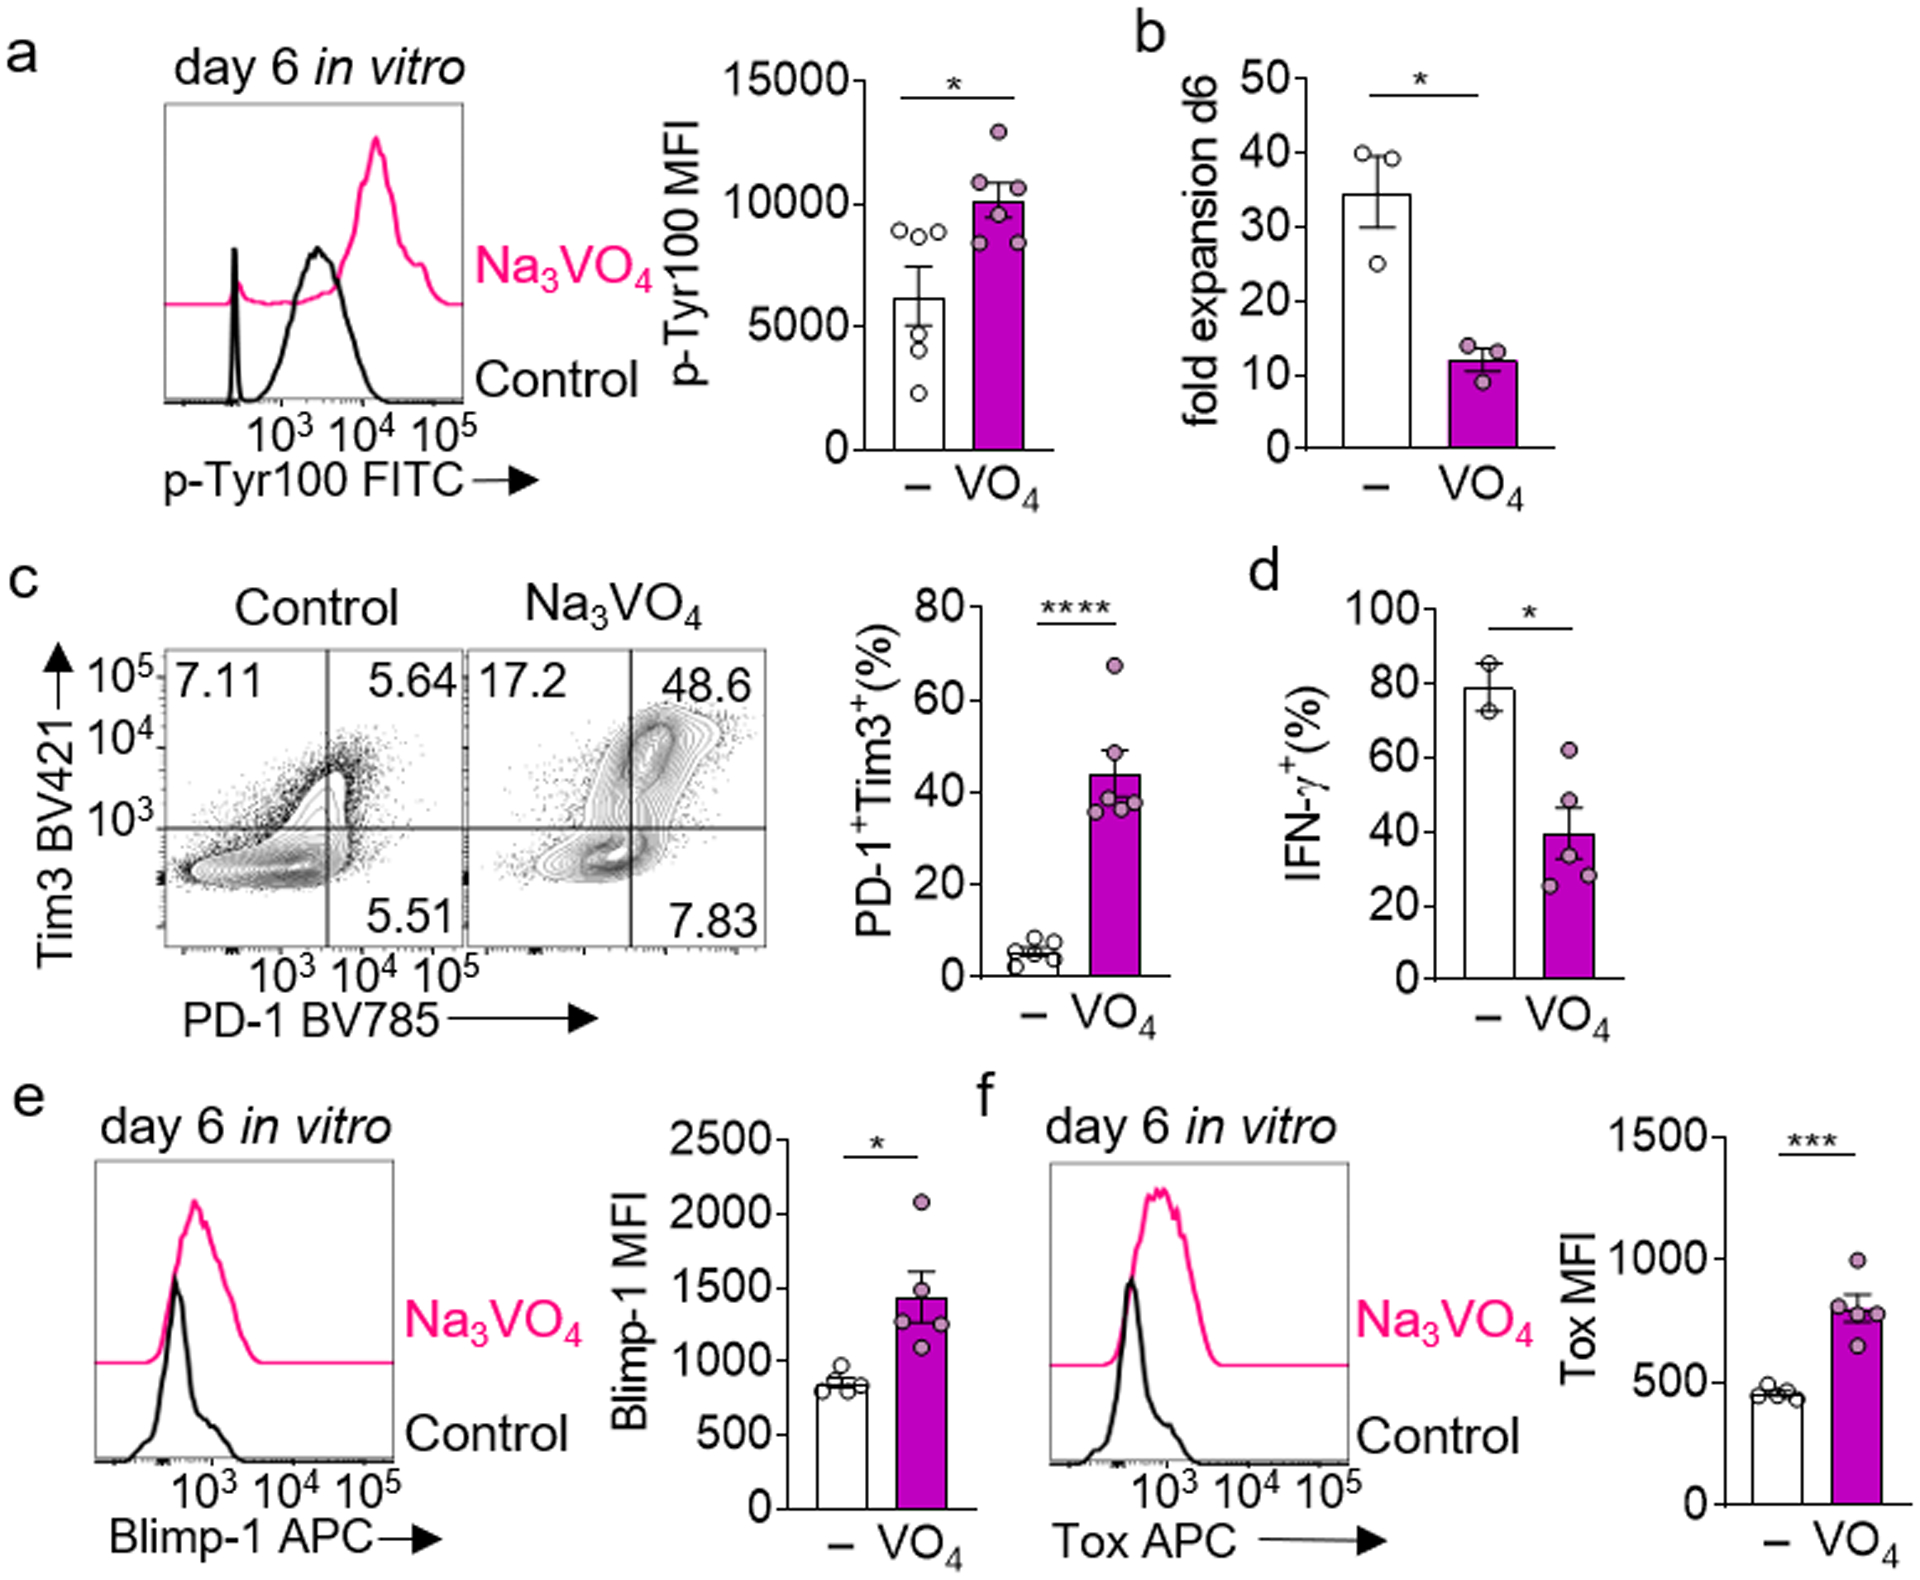
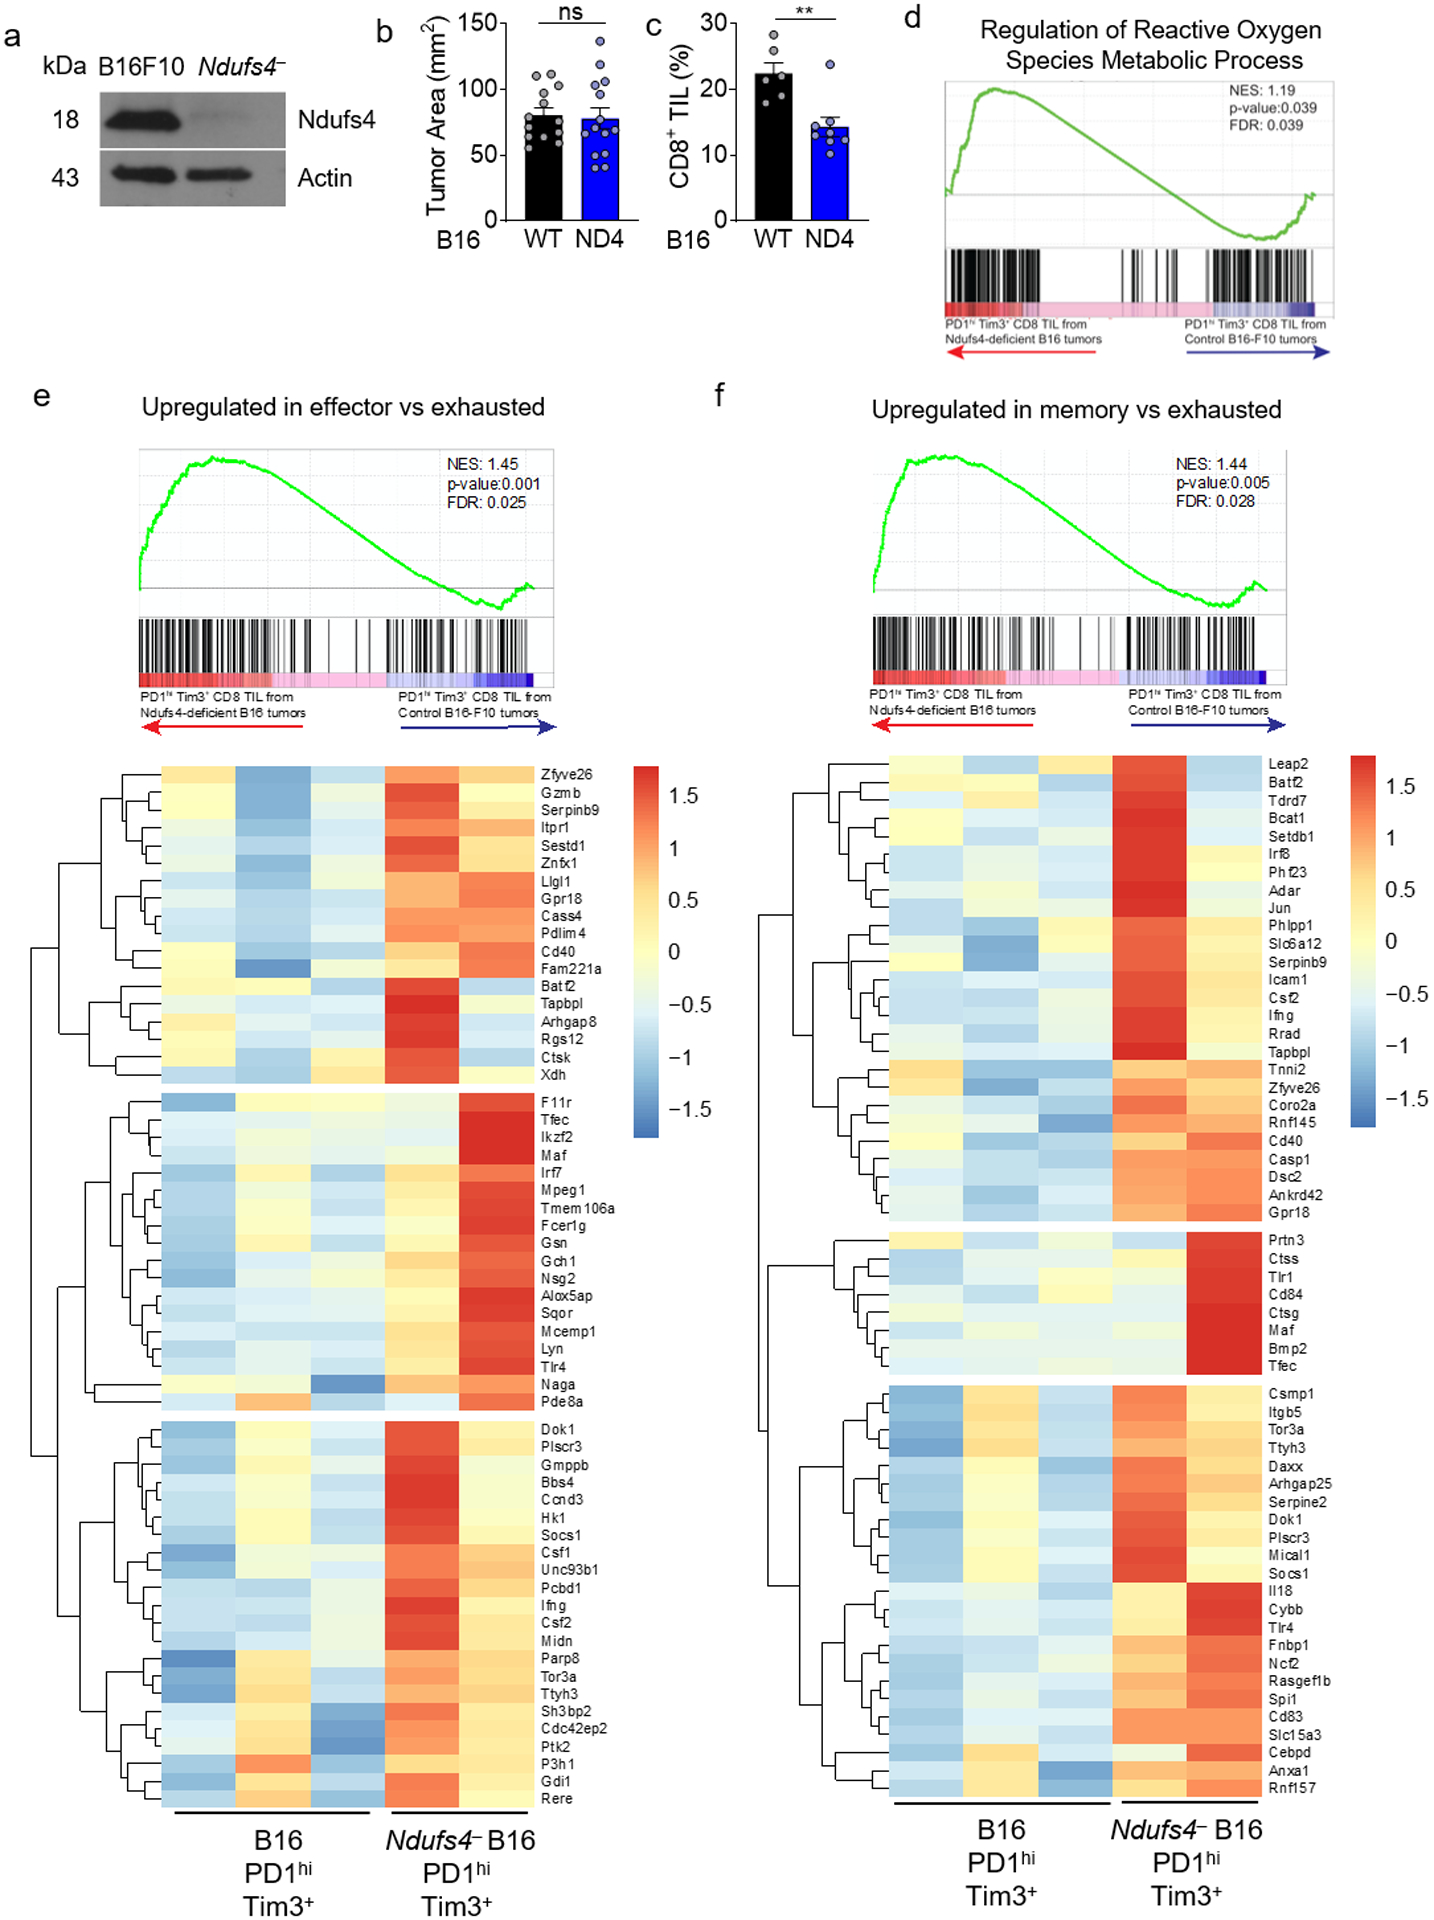
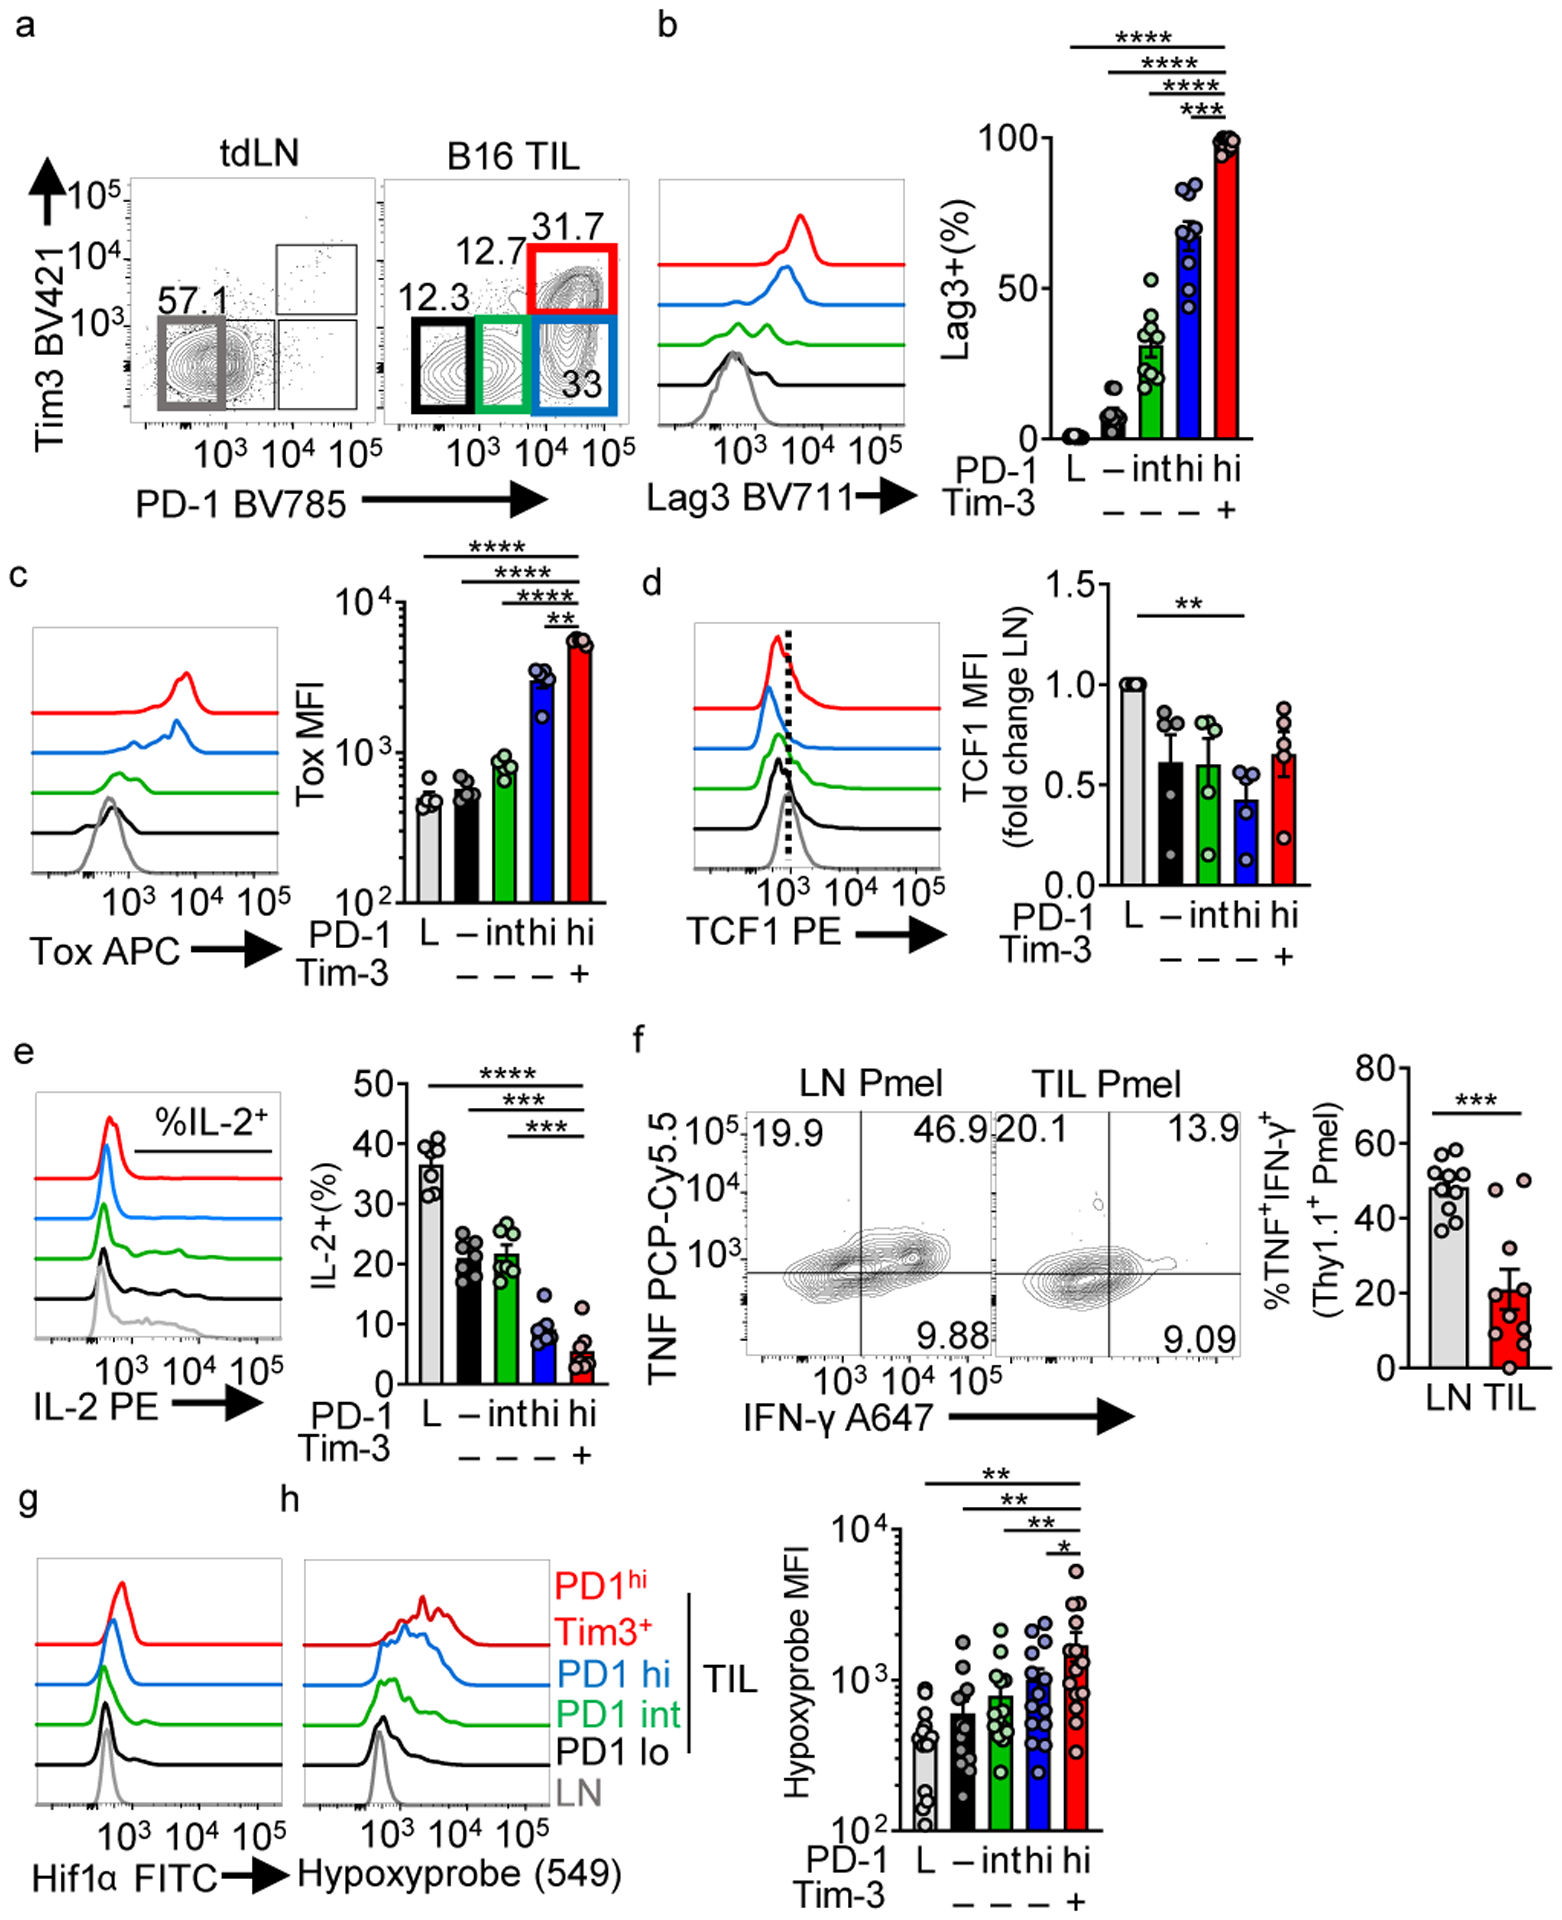
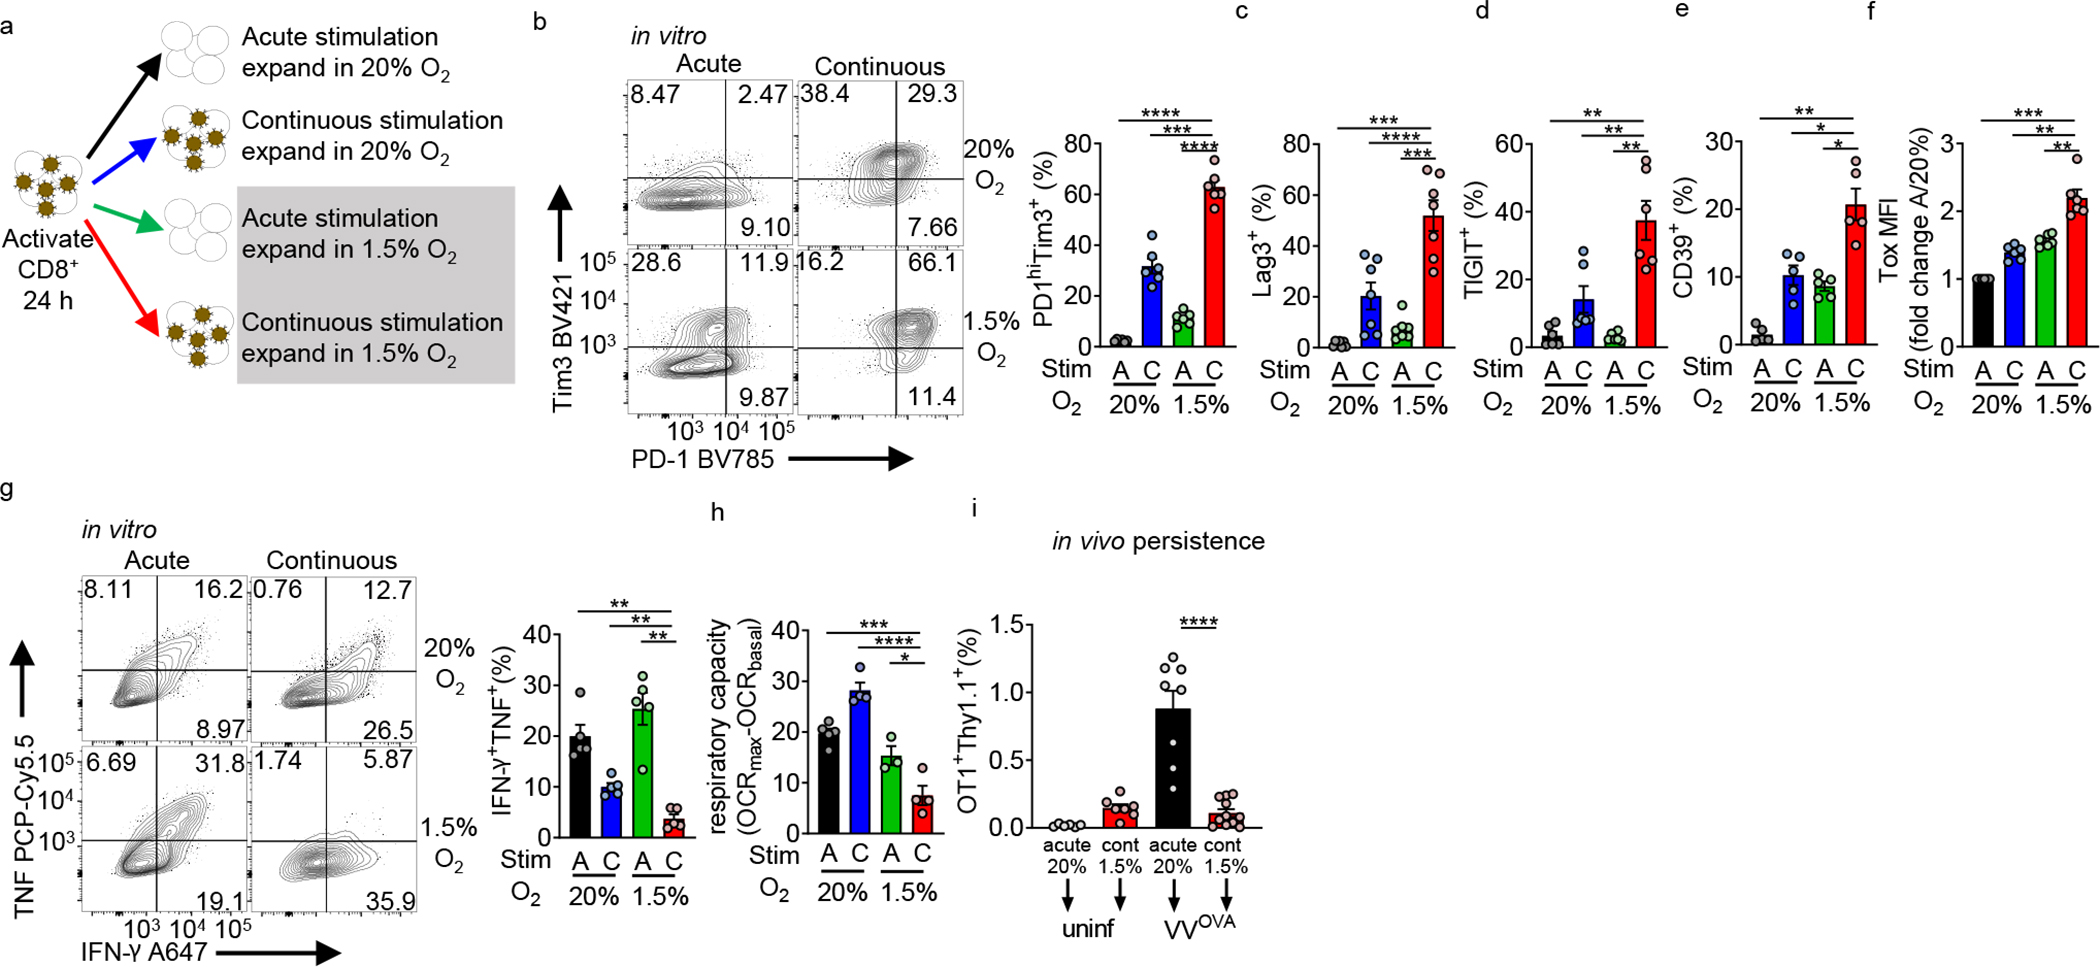
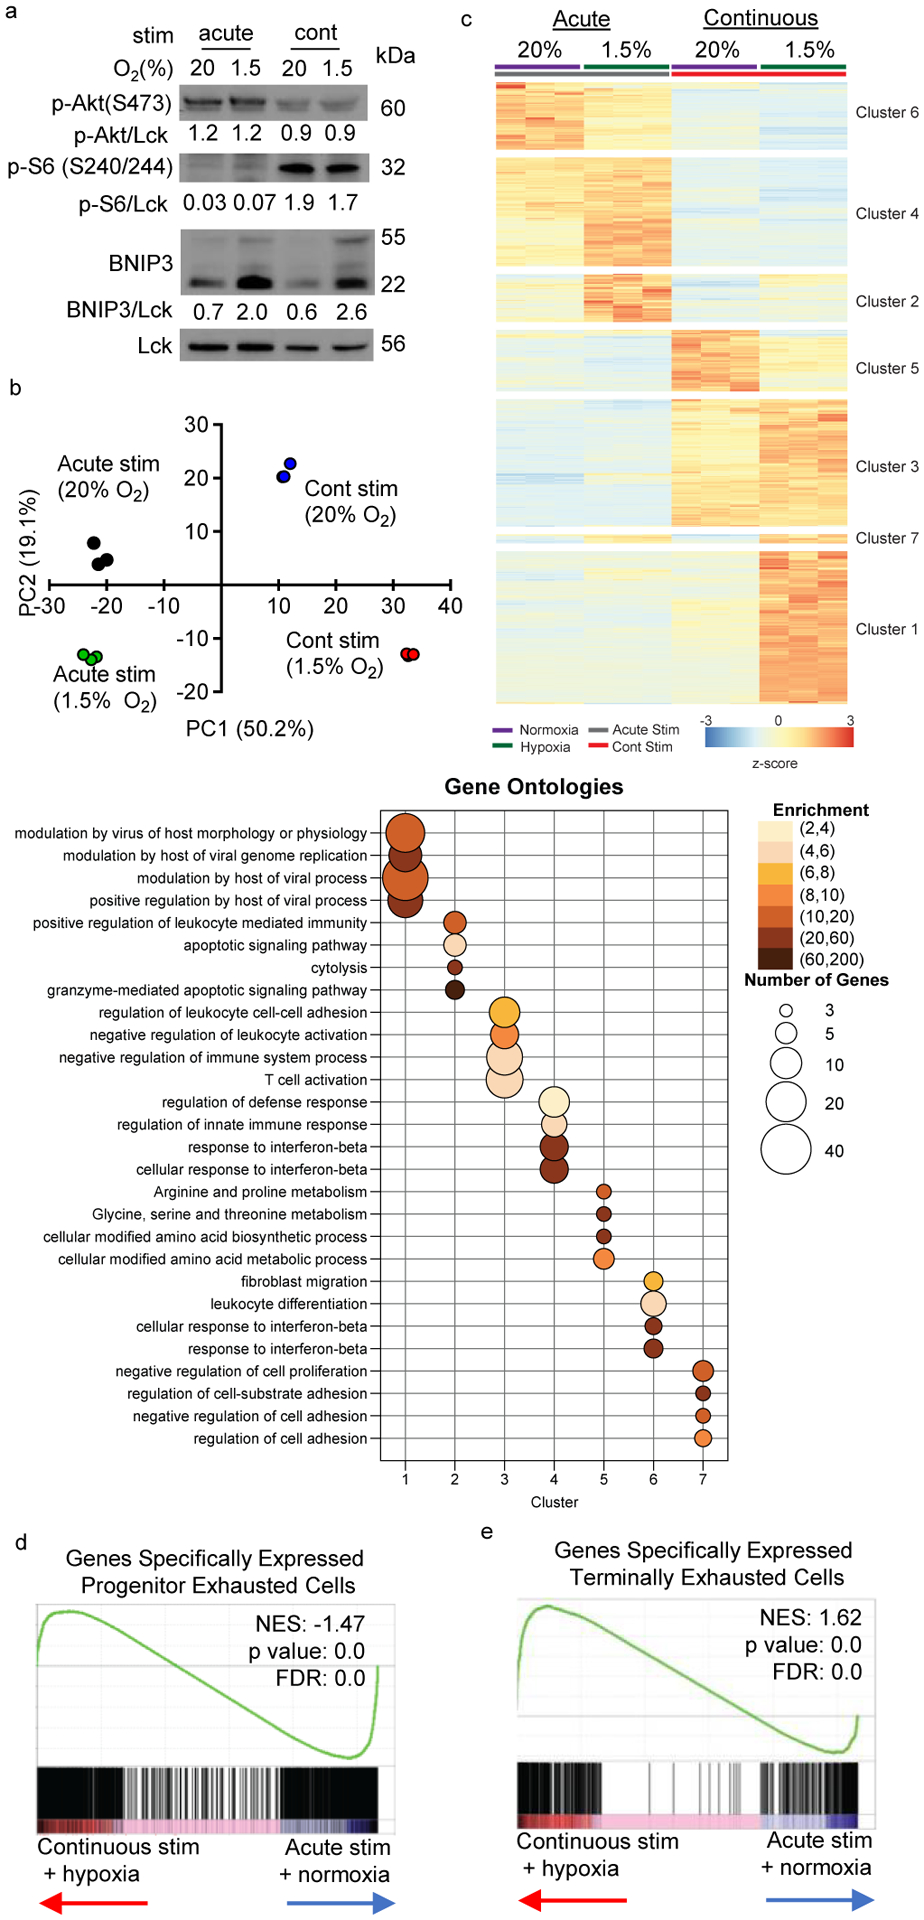
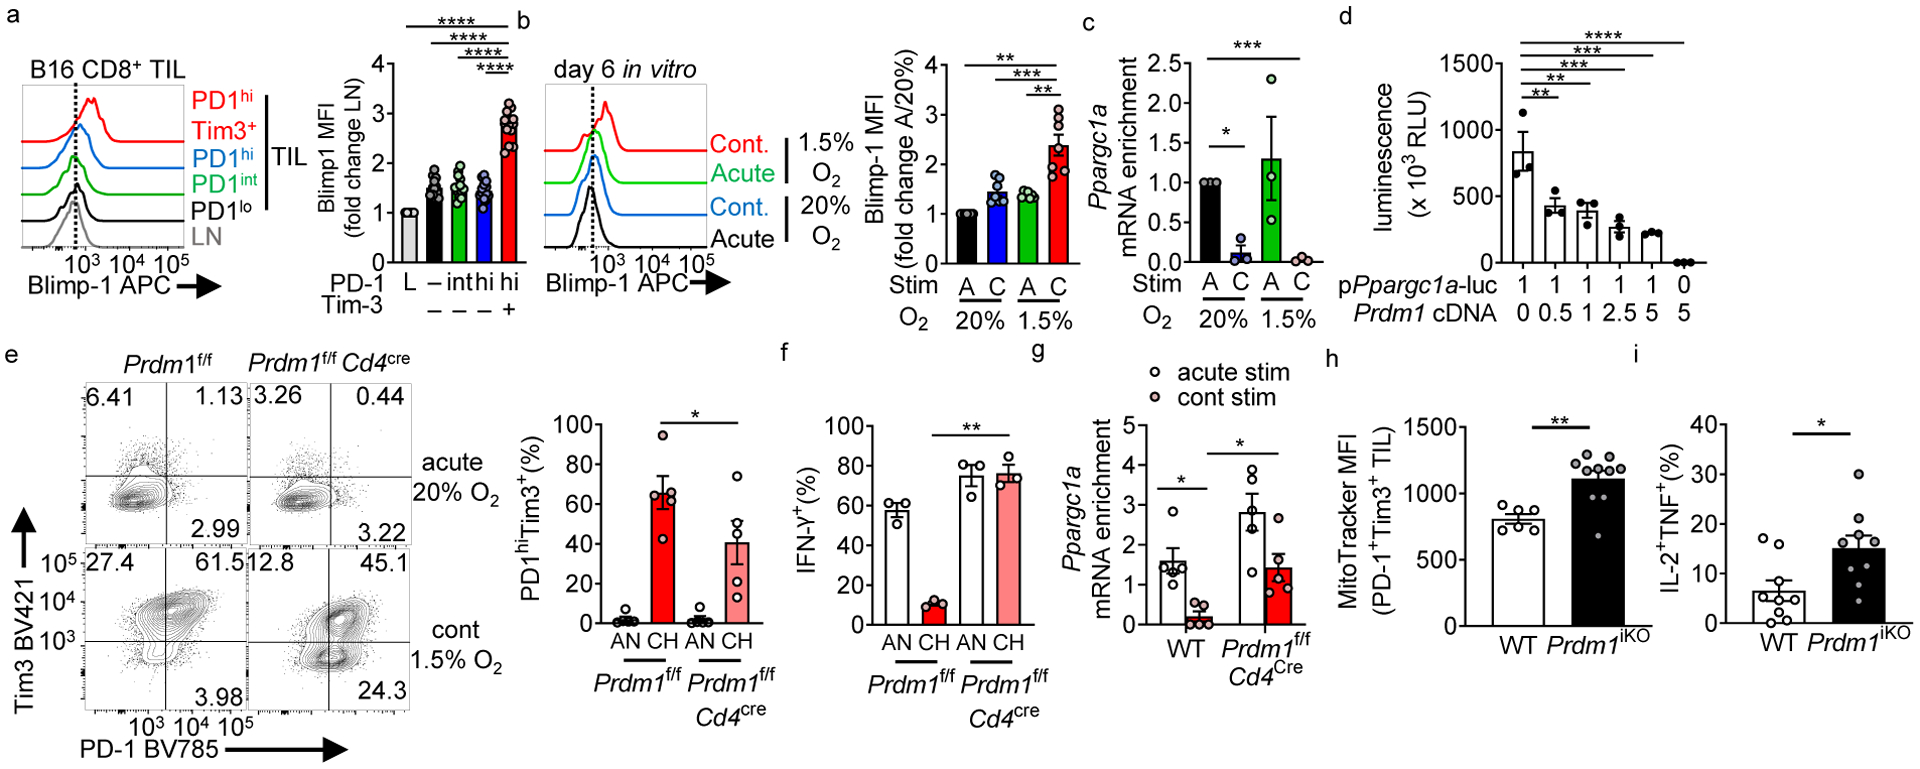
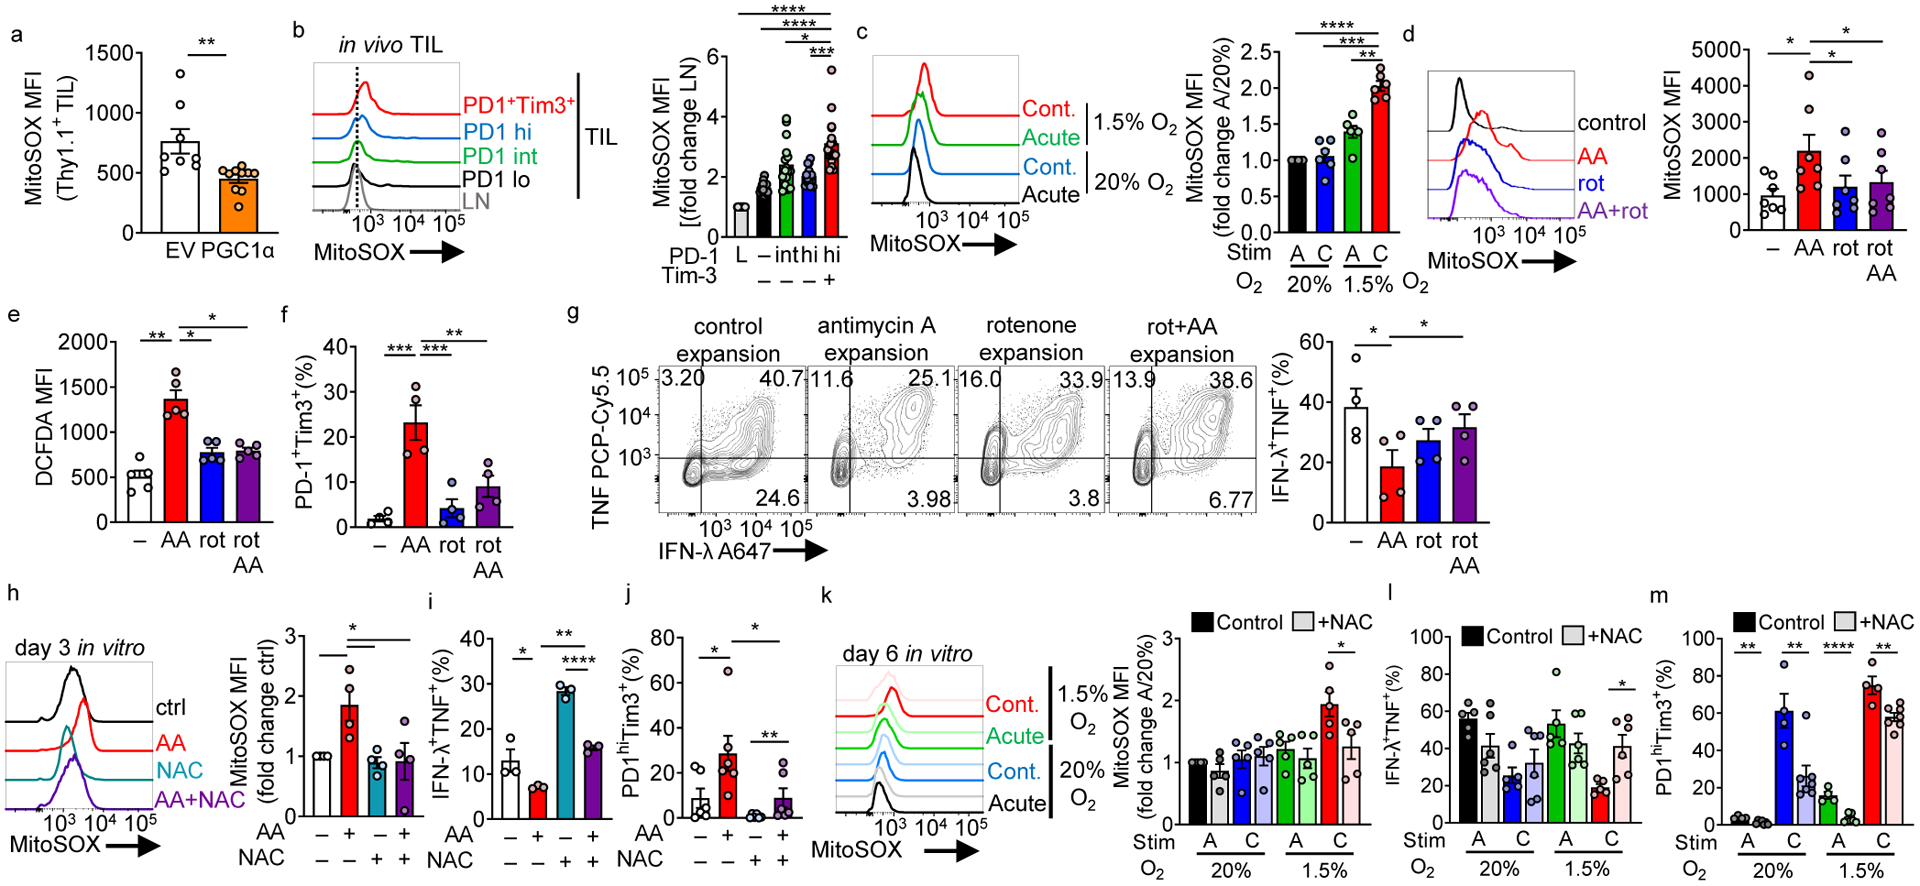
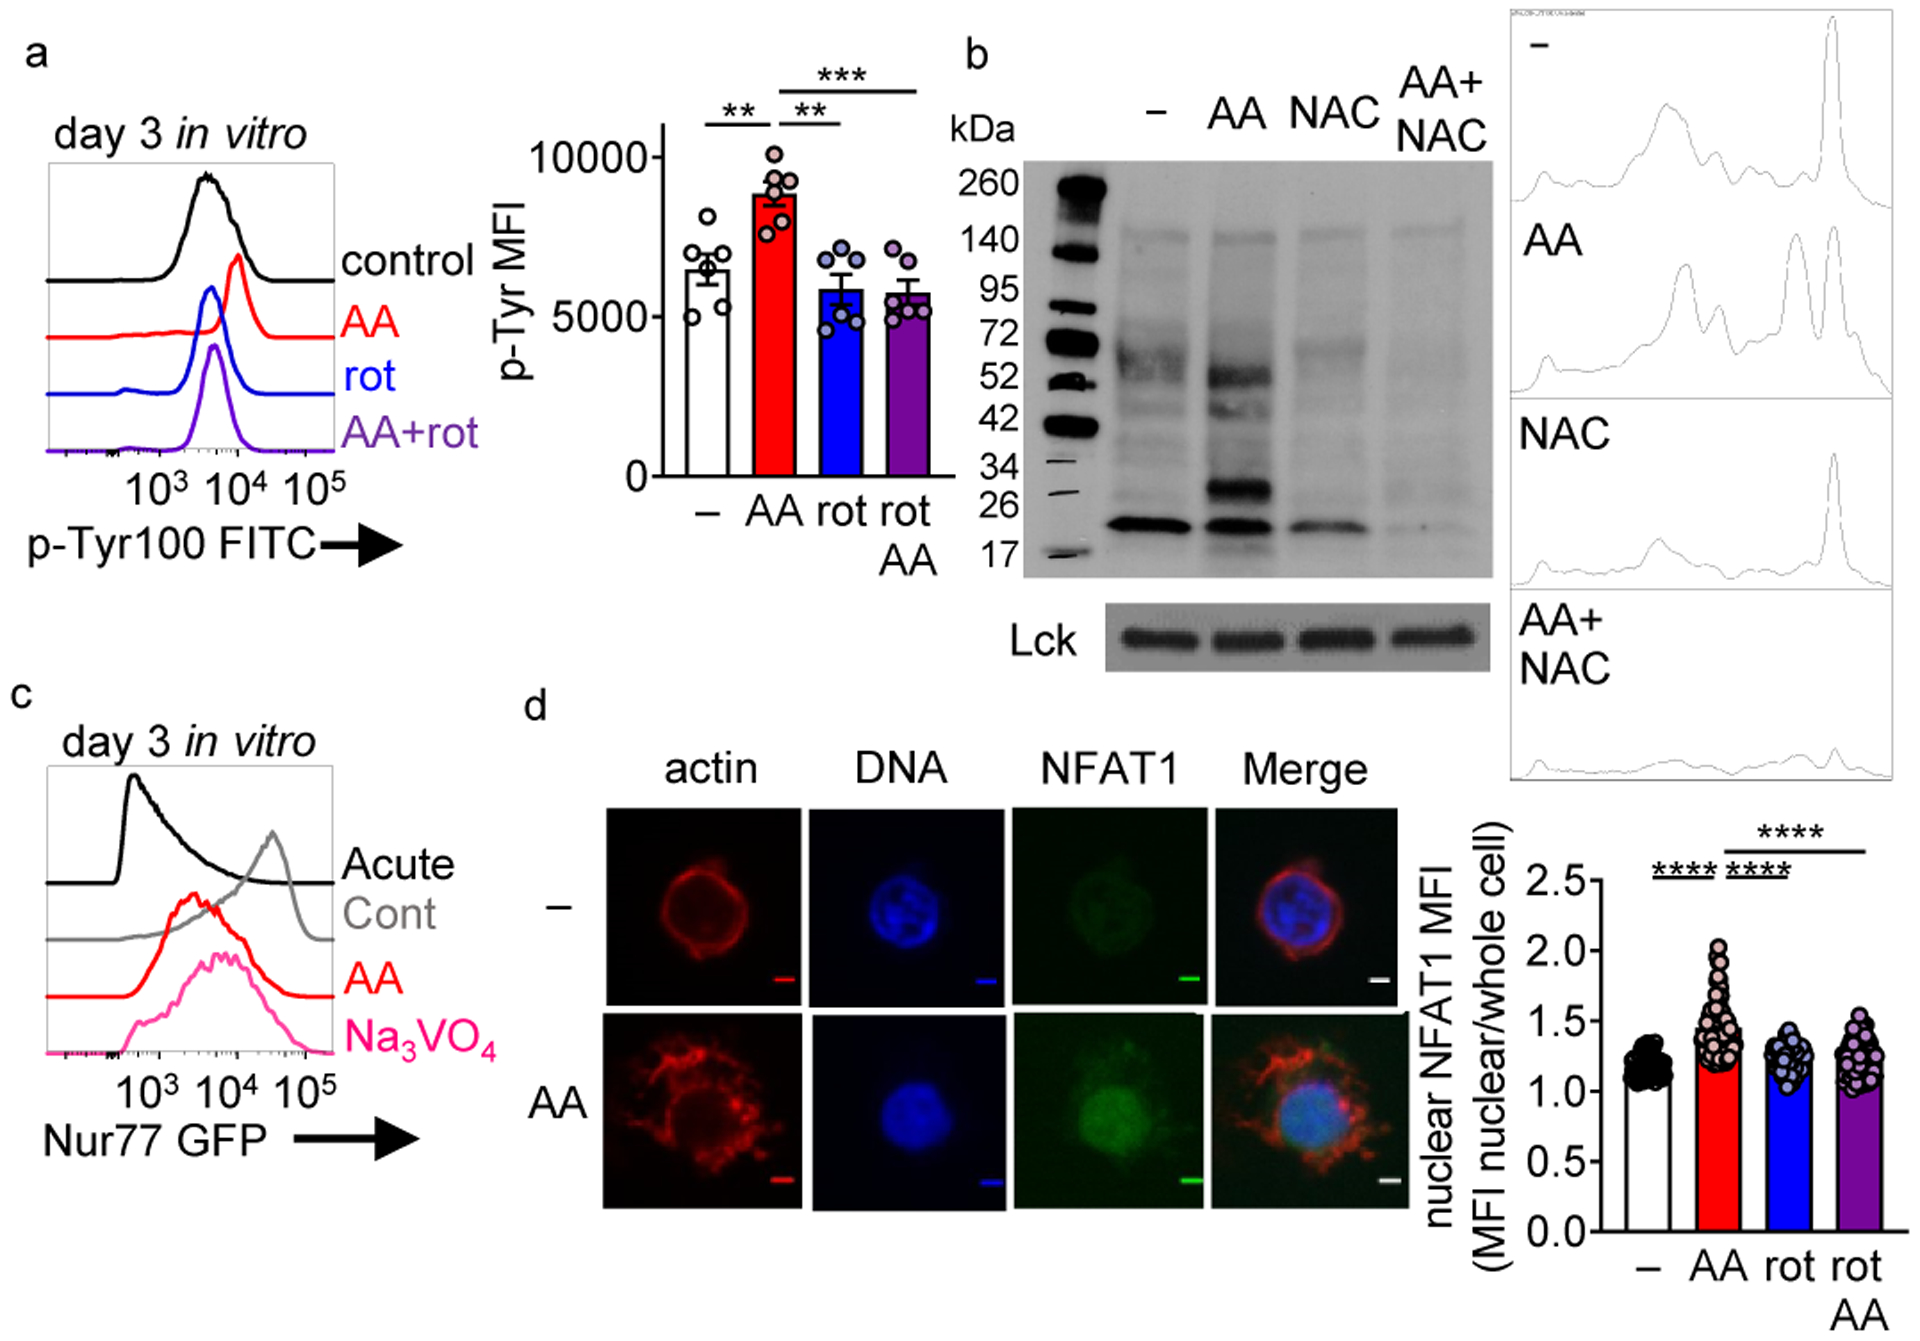
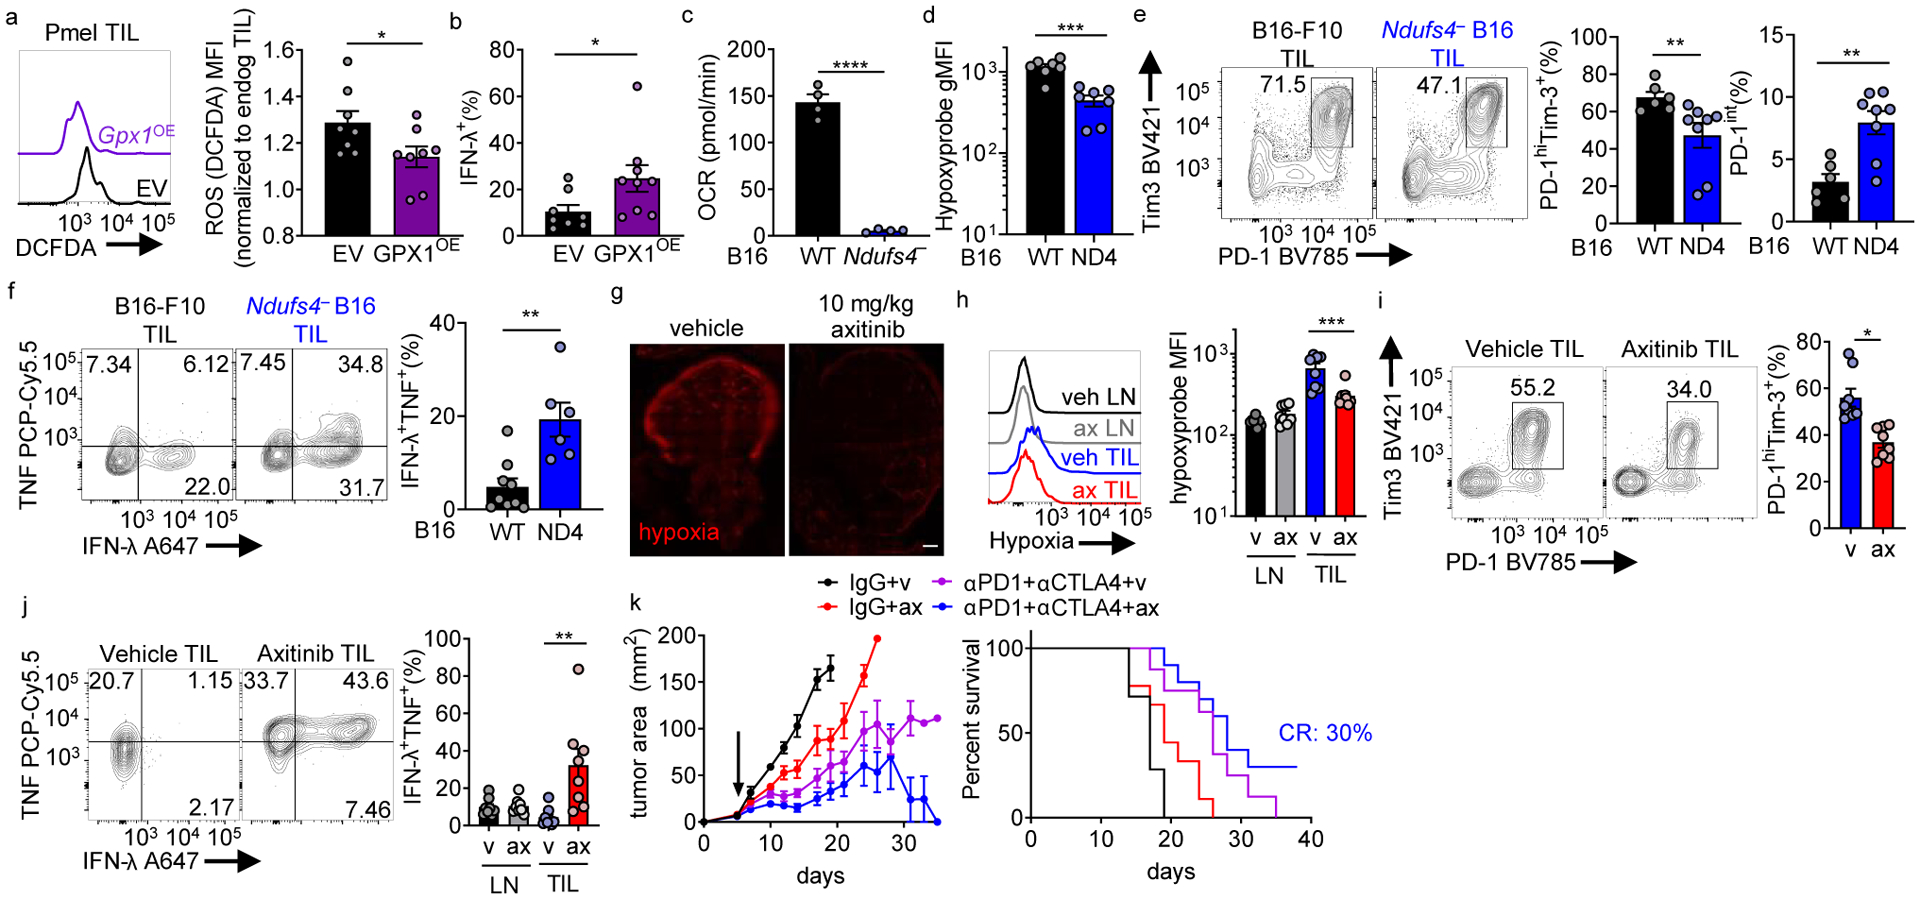
Cancer and chronic infections induce T cell exhaustion, a hypofunctional fate carrying distinct epigenetic, transcriptomic and metabolic characteristics. However, drivers of exhaustion remain poorly understood. As intratumoral exhausted T cells experience severe hypoxia, we hypothesized that metabolic stress alters their responses to other signals, specifically, persistent antigenic stimulation. In vitro, although CD8+ T cells experiencing continuous stimulation or hypoxia alone differentiated into functional effectors, the combination rapidly drove T cell dysfunction consistent with exhaustion. Continuous stimulation promoted Blimp-1-mediated repression of PGC-1α-dependent mitochondrial reprogramming, rendering cells poorly responsive to hypoxia. Loss of mitochondrial function generated intolerable levels of reactive oxygen species (ROS), sufficient to promote exhausted-like states, in part through phosphatase inhibition and the consequent activity of nuclear factor of activated T cells. Reducing T cell-intrinsic ROS and lowering tumor hypoxia limited T cell exhaustion, synergizing with immunotherapy. Thus, immunologic and metabolic signaling are intrinsically linked: through mitigation of metabolic stress, T cell differentiation can be altered to promote more functional cellular fates.


Conflict of interest statement

COMPETING INTERESTS STATEMENT

G.M.D. declares competing financial interests and has submitted patents covering the use of PGC1α in cell therapies that are licensed or pending and is entitled to a share in net income generated from licensing of these patent rights for commercial development. G.M.D. consults for and/or is on the scientific advisory board of BlueSphere Bio, Century Therapeutics, Novasenta, Pieris Pharmaceuticals, and Western Oncolytics/Kalivir; has grants from bluebird bio, Novasenta, Pfizer, Pieris Pharmaceuticals, TCR2, and Western Oncolytics/Kalivir; G.M.D. owns stock in Novasenta.

Figures

Extended Data Figure 1.
Extended Data Figure 1.. Antigen-specific tumor co-culture under hypoxia induces an exhausted-like dysfunctional state.
a, Lymph node (LN) and Tumor-infiltrating lymphocyte (TIL) gating strategy. b, PD1 vs Tim3 expression in gp100 specific Pmel TIL (red) overlaid on endogenous WT TIL (black) in in vivo B16 melanoma. c, Schematic of in vitro T cell+tumor cell exhaustion assay. Spleen and lymph node preparations from OT-I mice were stimulated with SIINFEKL peptide and IL-2 for 24 hours. T cells were then plated either alone, 1:1 with B16, or 1:1 with B16OVA, and placed in normoxia (atmospheric O2) or hypoxia (1.5% O2), all with IL-2 for 5–7 d. d, OT1 T cell fold expansion generated using the schematic in c, each group n=3. e, Cytokine production after CD3/CD28 restimulation in CD8+ T cells as a function of their coculture status. All restimulations were done in atmospheric oxygen. Each group n=5. f, Representative flow cytograms (left) and quantitated data (right) of CD8+ T cells PD-1 vs Tim3 expression generated using the schematic in c, each group n=4. All data are representative of 3–5 independent experiments. *p < 0.05, **p < 0.01, ***p < 0.001, ****p < 0.0001 by one-way ANOVA with Dunnett’s multiple comparison test. Error bars indicate SEM.
Extended Data Figure 2.
Extended Data Figure 2.. In vitro continuous stimulation under hypoxia does not significantly affect proliferation but affects accumulation.
a, TNF and IFN-γ production of d10 in vitro CD8+ T cells, either acutely or continuously activated with anti-CD3/CD28 beads for d2–5 in hypoxia or normoxia, then cultured additionally for 5 d in the presence of normoxia or hypoxia. b, Representative flow histograms and division analyses (right) of day 3 CD8+ T cells CTV dilution generated using the stimulation protocol used in Figure 2. Both % divided and proliferation index are reported. Each group n=3. c, Expansion (left) and cumulative doublings right) of CD8+ T cells as in Figure 2. each group n=4. d, Dye dilution (proliferation) versus cell death (live/dead) staining of day 3 or day 4 CD8+ T cells generated as in Figure 2. e, Mean fluorescence intensity of PD-1 in division 4 CD8+ T cells. Each group n=3. f–h, Representative flow cytograms of day 3 CD8+ T cells generated as in Figure 2. each group n=4. All data are representative of 3–6 independent experiments. *p < 0.05 by one-way ANOVA with Dunnett’s multiple comparison test. Error bars indicate SEM.
Extended Figure 3:
Extended Figure 3:. Continuous activation under hypoxia results in enrichment of genes related to terminal exhaustion and repression of genes from more progenitor-like exhausted cells.
a, Heatmap of selected genes from Fig. 3d (genes specifically enriched in progenitor exhausted T cells) from all four in vitro conditions detailed in Fig. 2. Each group n=3 b, Heatmap of selected genes from Fig. 3e (genes specifically enriched in terminally exhausted T cells) from all four in vitro conditions detailed in Fig. 2. Each group n=3.
Extended Figure 4.
Extended Figure 4.. HIF-1α is dispensable for continuous stimulation under hypoxia-induced dysfunction, although hypoxia signaling is active in response to hypoxia.
a, PD-1 and Tim-3 staining in WT or HIF-1α-deficient CD8+ T cells continuously stimulated under hypoxia as in Fig. 2. each group n=6. b, Cytokine production of restimulated WT and HIF-deficient T cells as in a. WT AN n=4, CH n=7; HIF-deficient AN n=4, CH n=8. c, Quantification of 2-NBDG staining as in Figure 2. each group n=5. d, Heatmap of known HIF-1α target genes from the transcriptional analyses in Fig. 3. Each group n=3. All data are representative of 3–6 independent experiments. *p < 0.05 by one-way ANOVA with Dunnett’s multiple comparison test (c). Error bars indicate SEM.
Extended Data Figure 5.
Extended Data Figure 5.. Blimp-1 represses metabolic sufficiency in a HIF-1α-independent manner.
a, Viability of 293T cells from Fig. 4d assessed by flow. b, Schematic of antigen-specific Blimp-1 T cell deletion: Mice bearing 3 mm diameter B16OVA tumors received 2×10⁶ naïve OT-I Prdm1f/fCd4Cre or Prdm1f/f T cells. Nine days later, mice were sacrificed and analyzed, transferred cells identified by Thy1.1+. c, MitoTracker geometric MFI of OT-I T cells transferred as in b. WT n=7 mice, Blimp-1-deficient n=8 mice. d, E8ICreERT2Prdm1f/fR26LSL.Tomato (Prdm1iKO) TIL flow cytogram of CD8 vs Tomato expression after 5 days of tamoxifen. e, WT and Prdm1iKO TIL flow cytogram of PD-1 vs Tim3 after 5 days of tamoxifen, with accompanying quantification. WT n=7 mice, Blimp-1-deficient n=6 mice. f, Prdm1iKO TIL Tomato expression after 5 days of tamoxifen, gated on CD8+ PD-1+ Tim3+ g, WT and Prdm1iKO TIL Blimp-1 staining after 5 days of tamoxifen, gated on CD8+ PD1+ Tim3+ TIL. h, Quantification of HIF1af/fCd4Cre or Cre negative littermate control CD8+ LN and CD8+ PD1hiTim3+ TIL Blimp-1 geometric mean fluorescent intensity. WT n=6 mice, HIF-deficient n=5 mice. i, Quantification of Prdm1f/fCd4Cre or Cre negative littermate control CD8+ LN CD8+ PD1hiTim3+ TIL Hif-1α geometric mean fluorescent intensity, fold change from LN. WT n=10 mice, Blimp-1-deficient n=10 mice. All data are representative of 3–8 independent experiments. *p < 0.05 by unpaired T test (c,e,h,i). Error bars indicate SEM.
Extended Data Figure 6.
Extended Data Figure 6.. PGC1α diverts differentiation from exhaustion by mitigating reactive oxygen species.
A, Geneset enrichment analysis of EV (n=3) or PGC1αOE (n=3) retrovirally transduced Pmel T cells sorted from B16-F10 as in Fig. 5a. Genesets are previously published comparing to progenitor exhausted T cells as in Fig. 3d. b, As in A but for terminally exhausted T cells. c, Metascape analysis of differentially upregulated pathways in PGC1αOE Pmel T cells sorted directly from the tumor microenvironment. EV n=3, PGC1αOE n=3. d, MitoSOX staining of T cells, normalized to control, cultured 0.04μM AA, or cultured in the indicated amounts of rotenone, for either 5 hr or 6 days. Each group n=2. e, CellTrace Violet dye dilution of day 3 CD8+ T cells cultured in either antimycin A, rotenone, or both. Each group n=3. f, CTV dilution vs live/dead staining of day 3 CD8+ T cells in e. g, Quantification of fold expansion of control cells and those cultured in 0.04μM antimycin A, 0.4μM rotenone, or AA+rot, 10mM NAC, or NAC+AA. Each group n=5. h, Fold expansion of CD8+ T cells in the continuous stimulation under hypoxia assay, +/− antioxidant NAC, quantitation normalized to acute stim in normoxia. Each group n=5. All data are representative of 2–5 independent experiments. *p < 0.05, **p < 0.01 by unpaired T test (h). Error bars indicate SEM.
Extended Data Figure 7.
Extended Data Figure 7.. Progressive loss of mtDNA in T cells induces high levels of reactive oxygen species and an exhausted-like state.
a, Schematic of generation of Rho0 T cells. b, Cellular ROS (DCFDA) staining of Rho0 T cells. c, Control and Rho0 T cell mitochondrial DNA (mtDNA) qPCR of ndufs4 (ND4), mt-dloop1 (Dloop1), and mt-rnr2 (16S), normalized to nuclear DNA. Each group n=3. d, Immunoblot of Control and Rho0 for mitochondrial proteins CV- ATP5A, CIII- UQCRC2, and CII- SDHB. Each group n=3. e, (Left) basal oxygen consumption rate (OCR) versus basal extracellular acidification rate (ECAR) of control vs Rho0 CD8+ T cells. (Right) spare respiratory capacity quantification (difference between basal and FCCP-uncoupled OCR) of control vs Rho0 T cells. Control n=5, Rho0 n=3. f, Quantification of fold expansion of control and Rho0 T cells. Each group n=6. g, PD-1, Tim3, and TIGIT staining on Control and Rho0 OT-I T cells. h, Flow cytogram of target splenocytes cells differentially labeled with CFSE loaded with SIINFEKL or control peptides, transferred into WT mice along with 1 × 10⁵ WT or Rho0 OT-I T cells generated as in b. each group n=3. i, Quantification of ROS staining of Rho0 T cells, cultured in the presence or absence of different concentrations of NAC. Each group n=2. j, (Left) representative flow cytograms of TNF vs IFN-γ production of OT-I T generated as in b (+/− NAC) and stimulated overnight with cognate peptide. (Right) Quantification of percent TNF+ IFN-γ+. Each group n=2. k, Quantification of Tox MFI in CD8+ T cells in control, Rho0, and Rho0+10mM NAC. Each group n=4. All data are representative of 3–5 independent experiments. *p < 0.05, **p < 0.01, ***p < 0.001, ****p < 0.0001 by two-way ANOVA with Sidak’s multiple comparison test (c), one-way ANOVA with Dunnett’s multiple comparison test (k) and by unpaired T test (e,f, h-j). Error bars indicate SEM.
Extended Data Figure 8.
Extended Data Figure 8.. Enforced elevation of phosphotyrosine signaling via tyrosine phosphorylation inhibition in isolation can drive an exhausted-like state.
a, (Left) global phosphotyrosine staining of CD8+ T cells cultured in vitro with 50μM sodium orthovanadate, (right) quantification of p-Tyr100 MFI. Each group n=6. b, Quantification of fold expansion of control and Na3VO4-cultured cells. Each group n=3 c, (Left) representative flow cytograms of PD1 vs Tim3 expression in cells cultured in B, (right) quantification of percent PD1+ Tim3+. Each group n=6. d, Quantification of IFN-γ production of Na3VO4-cultured cells after an overnight restimulation with anti-CD3/anti-CD28, golgiplug included in the last 5 hours. Control n=2, Na3VO4 n=4. e, (Left) representative flow histogram of Blimp-1 expression in cells cultured in a, (right) quantification of Blimp-1 MFI. Each group n=5. f, (Left) representative flow histogram of Tox expression in cells cultured in a, (right) quantification of Tox MFI. Each group n=5. All data are representative of 3–5 independent experiments. *p < 0.05, **p < 0.01, ***p < 0.001, ****p < 0.0001 by unpaired T test. Error bars indicate SEM.
Extended Data Figure 9.
Extended Data Figure 9.. CD8+ T cells infiltrating tumors engineered to be less hypoxic differentiate away from exhaustion toward effector/memory cells,
a, Immunoblot of the mitochondrial complex I subunit Ndufs4 in B16-F10 melanoma cells or those in which Ndufs4 has been disrupted using CRISPR-Cas9. n=1. b, Tumor area at d14 (time of analysis) for WT or Ndufs4-deficient B16-F10. WT n=13 mice, Ndufs4-deficient n=14 mice. c, Percent CD8+ T cells infiltrating WT or Ndufs4-deficient B16-F10 tumors. WT n=6 mice, Ndufs4-deficient n=7 mice. d, Leading edge plot of Regulation of Reactive Oxygen Species Metabolic Process (GO:2000377) produced via GSEA analysis of PD-1hiTim3+ CD8+ T cells infiltrating WT or Ndufs4-deficient B16.F10. WT n=3 mice, Ndufs4-deficient n=2 mice. e, as in d, but comparing effector to exhausted T cells, including heatmap. f, as in d, but comparing memory to exhausted T cells, including heatmap. *p < 0.05, **p < 0.01 by unpaired T Test (b,c). Error bars indicate SEM.
Figure 1:
Figure 1:. Terminally exhausted CD8+ tumor-infiltrating T cells experience high levels of hypoxia.
(a) Flow cytogram of WT CD8+ LN and TIL PD-1 and Tim-3 staining. Groups are labeled PD-1 low in lymph node (L), and in the TIL, groups are PD-1, PD-1 int, PD-1 hi, and PD-1hiTim3+ (b) Lag-3 (n=9 mice), (c) Tox expression (n=5 mice), and (d) TCF1 expression (n=5 mice) as in b. (e) IL-2 production with 16 h PMA/Iono stimulation (final 5 h with a protein transport inhibitor) (n=7 mice) (f) TNF vs IFN-γ production (n=10) in gp100 specific Pmel T cell LN and TIL with 16 h gp100 stimulation (final 5 h with a protein transport inhibitor). (g) Histogram overlays of HIF1α staining in WT CD8+ LN and TIL based on PD-1 and Tim-3 staining. (h) Hypoxyprobe (anti-pimonidazole) representative staining and tabulation after in vivo pimonidazole injection into mice 1hr before sacrifice. n=14 mice. Data are representative of 3–5 independent experiments. *p < 0.05, **p < 0.01, ***p < 0.001, ****p < 0.0001 by one-way ANOVA with Dunnett’s multiple comparison test (b-e, h) or unpaired T test (f). Error bars indicate SEM.
Figure 2:
Figure 2:. Continuous activation under hypoxia induces an exhausted-like dysfunctional state in CD8+ T cells.
(a) Experimental scheme. CD44hi CD8+ T cells are sorted from B6 mice, then activated with anti-CD3/anti-CD28-coated magnetic beads plus 25 U//mL IL-2 and 10 ng/mL IL-12 in normoxia (20% O2). After 24 hours, cells are washed and expanded in IL-2, but placed into various culture conditions (removing beads or continuous cocoulture with beads, under normoxia or 1.5% O2 hypoxia). (b) (left) Flow cytograms of PD-1 and Tim-3 staining in live CD8+ T cells generated using as in a accompanied by quantitation. n=6. (c–f) Quantification of Lag-3 (n=7), Tigit (n=6), CD39 (n=5), and Tox (n=6) staining as in b. (g) (left) Flow cytograms and tabulation of TNF and IFN-γ production after 16 h of PMA-ionomycin restimulation of live CD8+ T cells generated as in b. n=5. (h) Mitochondrial spare respiratory capacity (SRC: difference between basal OCR values and maximal OCR values after FCCP uncoupling) of T cells generated as in a. AN n=4, CN n=4, AH n=3, CH n=4. Graph represents 1 of 3 independent experiments. (i) Flow cytometric quantification of OT-I T cells generated as in a, then adoptively transferred into B6 mice infected intraperitoneally with 1×10⁶ PFU Vaccinia-OVA. n=3 independent in vitro experiments, transferred into multiple mice. All data are representative of 3–6 independent experiments. *p < 0.05, **p < 0.01, ***p < 0.001, ****p < 0.0001 by one-way ANOVA with Dunnett’s multiple comparison test. Error bars indicate SEM.
Figure 3:
Figure 3:. Continuous activation under hypoxia induces distinct intracellular programs from either stressor alone.
(a) Representative immunoblot of mTOR and HIF1 signaling components in T cells stimulated in the four in vitro conditions in Fig. 2. (b) Principal component analysis (PCA) based on transcriptomic data from RNAseq data of CD8+ T cells incubated in the four conditions as in Fig. 2 each group n=3. (c) Heatmap and unsupervised hierarchical clustering of the average expression of 767 differentially expressed genes from pairwise comparisons (log2 fold change >2, adjusted p value <0.05). Gene ontology analysis of genes defining each cluster are represented in the accompanying bubble plot. (d, e) Leading edge plots of geneset enrichment analysis (GSEA) of acute/normoxic vs continuous/hypoxic culture RNAseq compared to previously published transcriptional profiles of progenitor versus terminally exhausted T cells in B16 TIL. Heatmaps for this GSEA appear in Extended Data. All data are representative of 3 independent experiments.
Figure 4:
Figure 4:. Continuous activation causes Blimp-1-mediated repression of PGC1α.
(a) Blimp-1 staining in CD8+ LN and TIL based on PD-1 and Tim-3 expression. n=14 mice. (b) Blimp-1 staining in in vitro cultured CD8+ T cells stimulated continuously under hypoxia, normalized in quantitation to acute stim in normoxia. n=7. (c) Ppargc1a (encoding PGC1α) mRNA expression in cells cultured as in Fig. 2. each group n=3. (d) Luciferase assay of 293T cells co-transfected with a plasmid containing the mouse PGC1α promoter (Ppargc1ap) driving luciferase and mouse Prdm1 (encoding Blimp-1) at indicated ratios. n=3. (e) PD-1 and Tim-3 staining in CD8+ T cells isolated from Prdm1f/fCd4cre mice or littermate controls stimulated continuously under hypoxia. n=5. (f) IFN-γ production in T cells from e after 16 h PMA/ionomycin restimulation (last 5 h with a protein transport inhibitor). n=3. (g) Ppargc1a mRNA expression in WT or Blimp-1 deficient T cells acutely or continuously stimulated in vitro. n=5 mice per group. (h) MitoTracker FM staining in PD-1hiTim3+ TIL CD8+ T cells from B16-bearing animals bearing an inducible CD8-specific deletion of Blimp-1 (Prdm1f/f E8ICre-ERT2 Rosa26-LSL-TdTomato (termed Prdm1iKO)). WT n=6 mice, Prdm1iKO n=10 mice. (i) IFN-γ and TNF production in CD8+ TIL after 16 h PMA/ionomycin restimulation, as in h. WT n=9 mice, Prdm1iKO n=9 mice. All flow data are representative of 3–6 independent experiments. *p < 0.05, **p < 0.01, ***p < 0.001, ****p < 0.0001 by one-way ANOVA with Dunnett’s multiple comparison test (a-d), paired T test (e-f), one-way ANOVA with repeated measures (g), and unpaired T test (h-i). Error bars indicate SEM.
Figure 5:
Figure 5:. Continuous activation under hypoxia increases mitochondrial ROS which is sufficient to drive an exhausted-like dysfunctional program.
(a) MitoSOX (mitochondrial superoxide) staining of adoptively transferred, B16-infiltrating Pmel Thy1.1+ T cells transduced with a PGC1α retroviral expression vector (PGC1αOE) or empty vector (EV) control. EV n=8 mice, PGC1αOE n=10 mice (b) MitoSOX staining in CD8+ LN and TIL based on PD-1 and Tim-3 expression (quantitation normalized to LN cells). n=16 mice. (c) MitoSOX staining in continuous stimulation under hypoxia, normalized to acute stim in normoxia. Each group n=6. (d) MitoSOX staining of CD8+ T cells activated overnight and expanded in IL-2 and either 0.04mM mitochondrial complex III inhibitor antimycin A, 0.4mM complex I inhibitor rotenone, or simultaneous combination of the two for 3 days. n=7. (e) As in d but using the cellular ROS detector DCFDA. n=5. (f) %PD1hiTim3+ cells as in d cultured for 6 days. n=4. (g) IFN-γ and TNF production in T cells generated as in d for 7 days, after stimulation with anti-CD3/anti-CD28. n=4 (h) MitoSOX staining of CD8+ T cells activated overnight and then expanded in IL-2 and either antimycin A, 10 mM n-acetyl-cysteine (NAC), or simultaneous combination of the two for 3 days. Each group n=4. (i) IFN-γ and TNF production in T cells in h after stimulation with anti-CD3/anti-CD28 overnight. n=3 (j) %PD1hiTim3+ cells in cells as in h. n=6. (k) MitoSOX (control n=5, NAC n=5), (l) IFN-γ and TNF production (control n=5, NAC n=6), and (m) PD-1 and Tim3 staining (control n=4, NAC n=7), in continuous stimulation under hypoxia +/− 10mM NAC. All data are representative of 3–7 independent experiments. *p < 0.05, **p < 0.01, ***p < 0.001, ****p < 0.0001 by one-way ANOVA with Dunnett’s multiple comparison test (b-j) or unpaired T test (a,k-m). Error bars indicate SEM.
Figure 6:
Figure 6:. Persistent mitochondrial ROS increases elevation of phosphotyrosine signaling and nuclear NFAT localization
(a) Global phosphotyrosine staining in T cells activated overnight and then expanded in IL-2 and either 0.04mM mitochondrial complex III inhibitor antimycin A, 0.4mM complex I inhibitor rotenone, or a simultaneous combination of the two for 3 days. Each group n=5. (b) Phosphotyrosine staining of CD8+ T cell lysates from cells activated overnight and then expanded in IL-2 and either 0.04mM mitochondrial complex III inhibitor antimycin A, 10mM antioxidant n-acetyl-cysteine (NAC), or a simultaneous combination of the two for 3 days. (c) GFP expression of Nur77-GFP CD8+ T cells in either acutely activated, continuously activated, antimycin A, or 50mM sodium orthovanadate culture conditions. (d) Nuclear NFAT localization in representative control and AA-expanded T cells (day 6) as well as actin and DNA staining. Scale bars = 2 micrometers, accompanied with quantitation (each dot equals one cell). Control n=55, AA n=75, rot n=70, AA+rot n=67. All data are representative of 3–6 independent experiments. **p < 0.01, ***p < 0.001 by one-way ANOVA with Dunnett’s multiple comparison test (a,d). Error bars indicate SEM.
Figure 7:
Figure 7:. Reducing ROS or hypoxia exposure alters T cell differentiation to exhaustion and improves response to immunotherapy.
(a) DCFDA staining of adoptively transferred, B16-infiltrating Pmel Thy1.1+ T cells retrovirally transduced with GPX1 or vector control, EV n=8, GPX1OE n=8. (b) IFN-γ production from cells as in a after 16 h gp100 restimulation (last 5 h with protein transport inhibitor). EV n=8 mice, GPX1OE n=9 mice. (c) Oxygen consumption rate of B16-F10 or Ndufs4-deficient B16 (ND4). Each group n=4. (d) Hypoxyprobe staining in CD8+ T cells infiltrating WT or Ndufs4-deficient B16-F10, after intravenous pimonidazole injection 1.5hr before sacrifice. WT n=7 mice, Ndufs4-deficient n=7 mice. (e) PD-1 and Tim-3 staining in CD8+ TIL from WT or Ndufs4-deficient B16-F10, accompanied by quantitation of terminally exhausted or progenitor exhausted cells. WT n=6 mice, Ndufs4-deficient n=8 mice. (f) TNF and IFN-γ production in CD8+ TIL from WT or Ndufs4-deficient B16-F10 after 16 h PMA/ionomycin restimulation (last 5 h with protein transport inhibitor). WT n=9 mice, Ndufs4-deficient n=6 mice. (g) Hypoxia staining of B16 tumor sections of mice treated with vehicle or 10 mg/kg axitinib for 3 d. Scale bar 500mM (h), Hypoxia staining of T cells from LN and TIL of axitinib- or vehicle-treated B16-bearing mice. Vehicle n=8 mice, axitinib n=8 mice. (i), PD-1 and Tim-3 staining in CD8+ TIL from axitinib- or vehicle-treated B16-bearing mice. Vehicle n=8 mice, axitinib n=8 mice. (j), IFN-γ and TNF production in PMA/ionomycin restimulated CD8+ LN and TIL in B16-bearing mice treated with axitinib or vehicle control. Vehicle n=8 mice, axitinib n=8 mice. (k), Tumor growth (left) and survival (right) of B16-bearing mice treated thrice weekly with axitinib or vehicle alone or with combination anti-PD1+anti-CTLA4. Therapy began when mice had palpable tumor (d5, arrow). (Right) survival curve for mice. Control n=7, ax n=9, αPD1+αCTLA4 n=8, axi+αPD1+αCTLA4 n=10. Data are representative of 2–3 independent experiments. *p < 0.05, **p < 0.01, ***p < 0.001, ****p < 0.0001 by unpaired t test (a-f, i), one-way ANOVA (h, j), or log-rank test (k). Error bars indicate SEM.

Comment in

References

    1. Taniuchi I CD4 Helper and CD8 Cytotoxic T Cell Differentiation. Annu. Rev. Immunol 36, 579–601 (2018). - PubMed
    1. Chang JT, Wherry EJ & Goldrath AW Molecular regulation of effector and memory T cell differentiation. Nat. Rev. Immunol 15, 1104–15 (2014). - PMC - PubMed
    1. McLane LM, Abdel-Hakeem MS & Wherry EJ CD8 T Cell Exhaustion During Chronic Viral Infection and Cancer. Annu. Rev. Immunol 37, 457–495 (2019). - PubMed
    1. Paley MA et al. Progenitor and terminal subsets of CD8+ T cells cooperate to contain chronic viral infection. Science 338, 1220–1225 (2012). - PMC - PubMed
    1. Shin H et al. A Role for the Transcriptional Repressor Blimp-1 in CD8 + T Cell Exhaustion during Chronic Viral Infection. Immunity 31, 309–320 (2009). - PMC - PubMed

Publication types

MeSH terms

Substances