. 2021 Feb;22(2):154-165.
doi: 10.1038/s41590-020-00844-7. Epub 2021 Jan 4.

Intracellular immune sensing promotes inflammation via gasdermin D-driven release of a lectin alarmin

Affiliations

Intracellular immune sensing promotes inflammation via gasdermin D-driven release of a lectin alarmin

Ashley J Russo et al. Nat Immunol. 2021 Feb.

Abstract

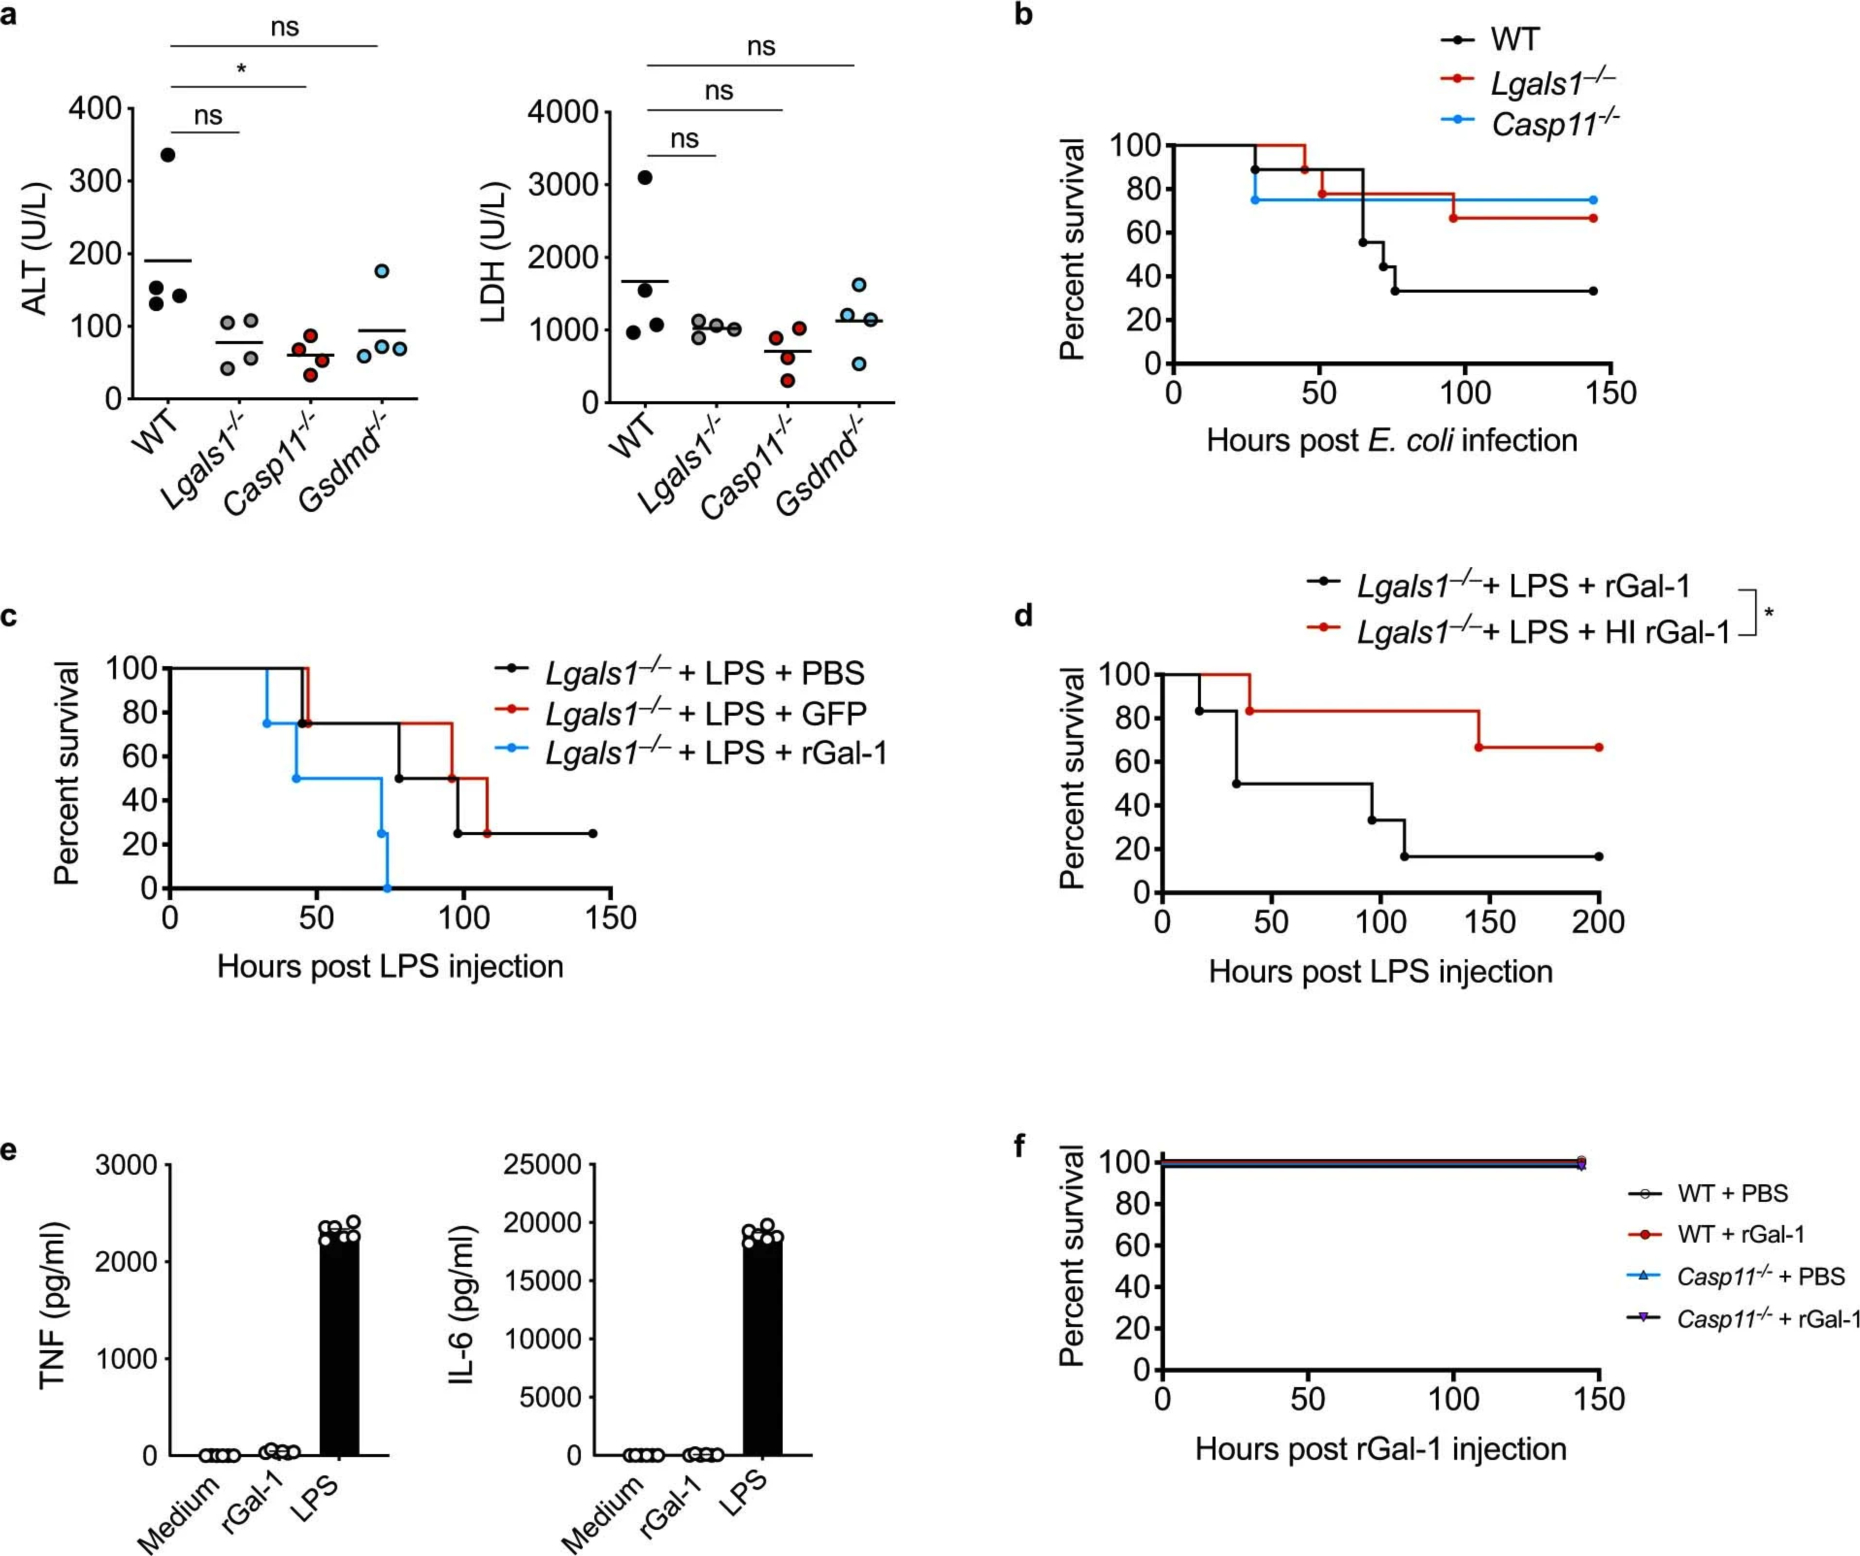
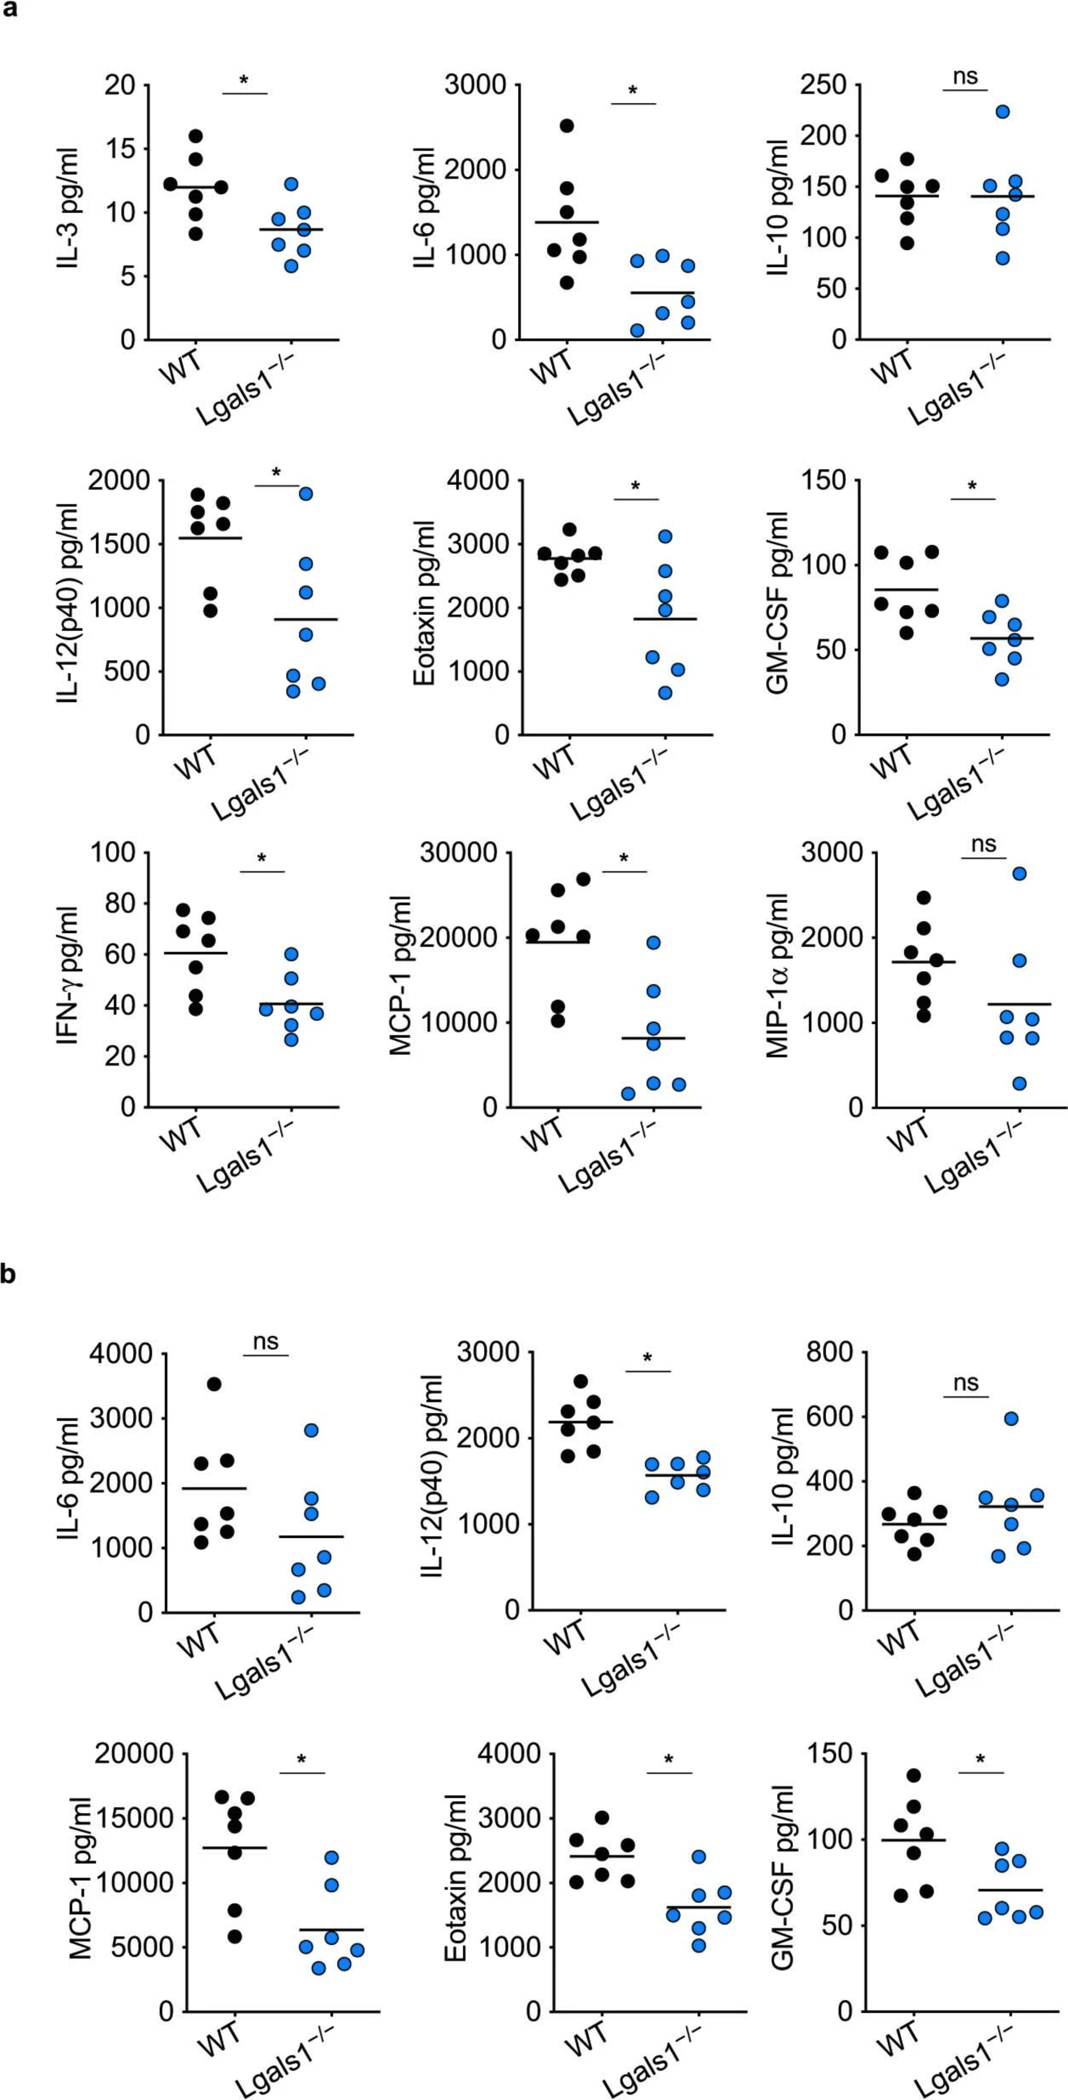
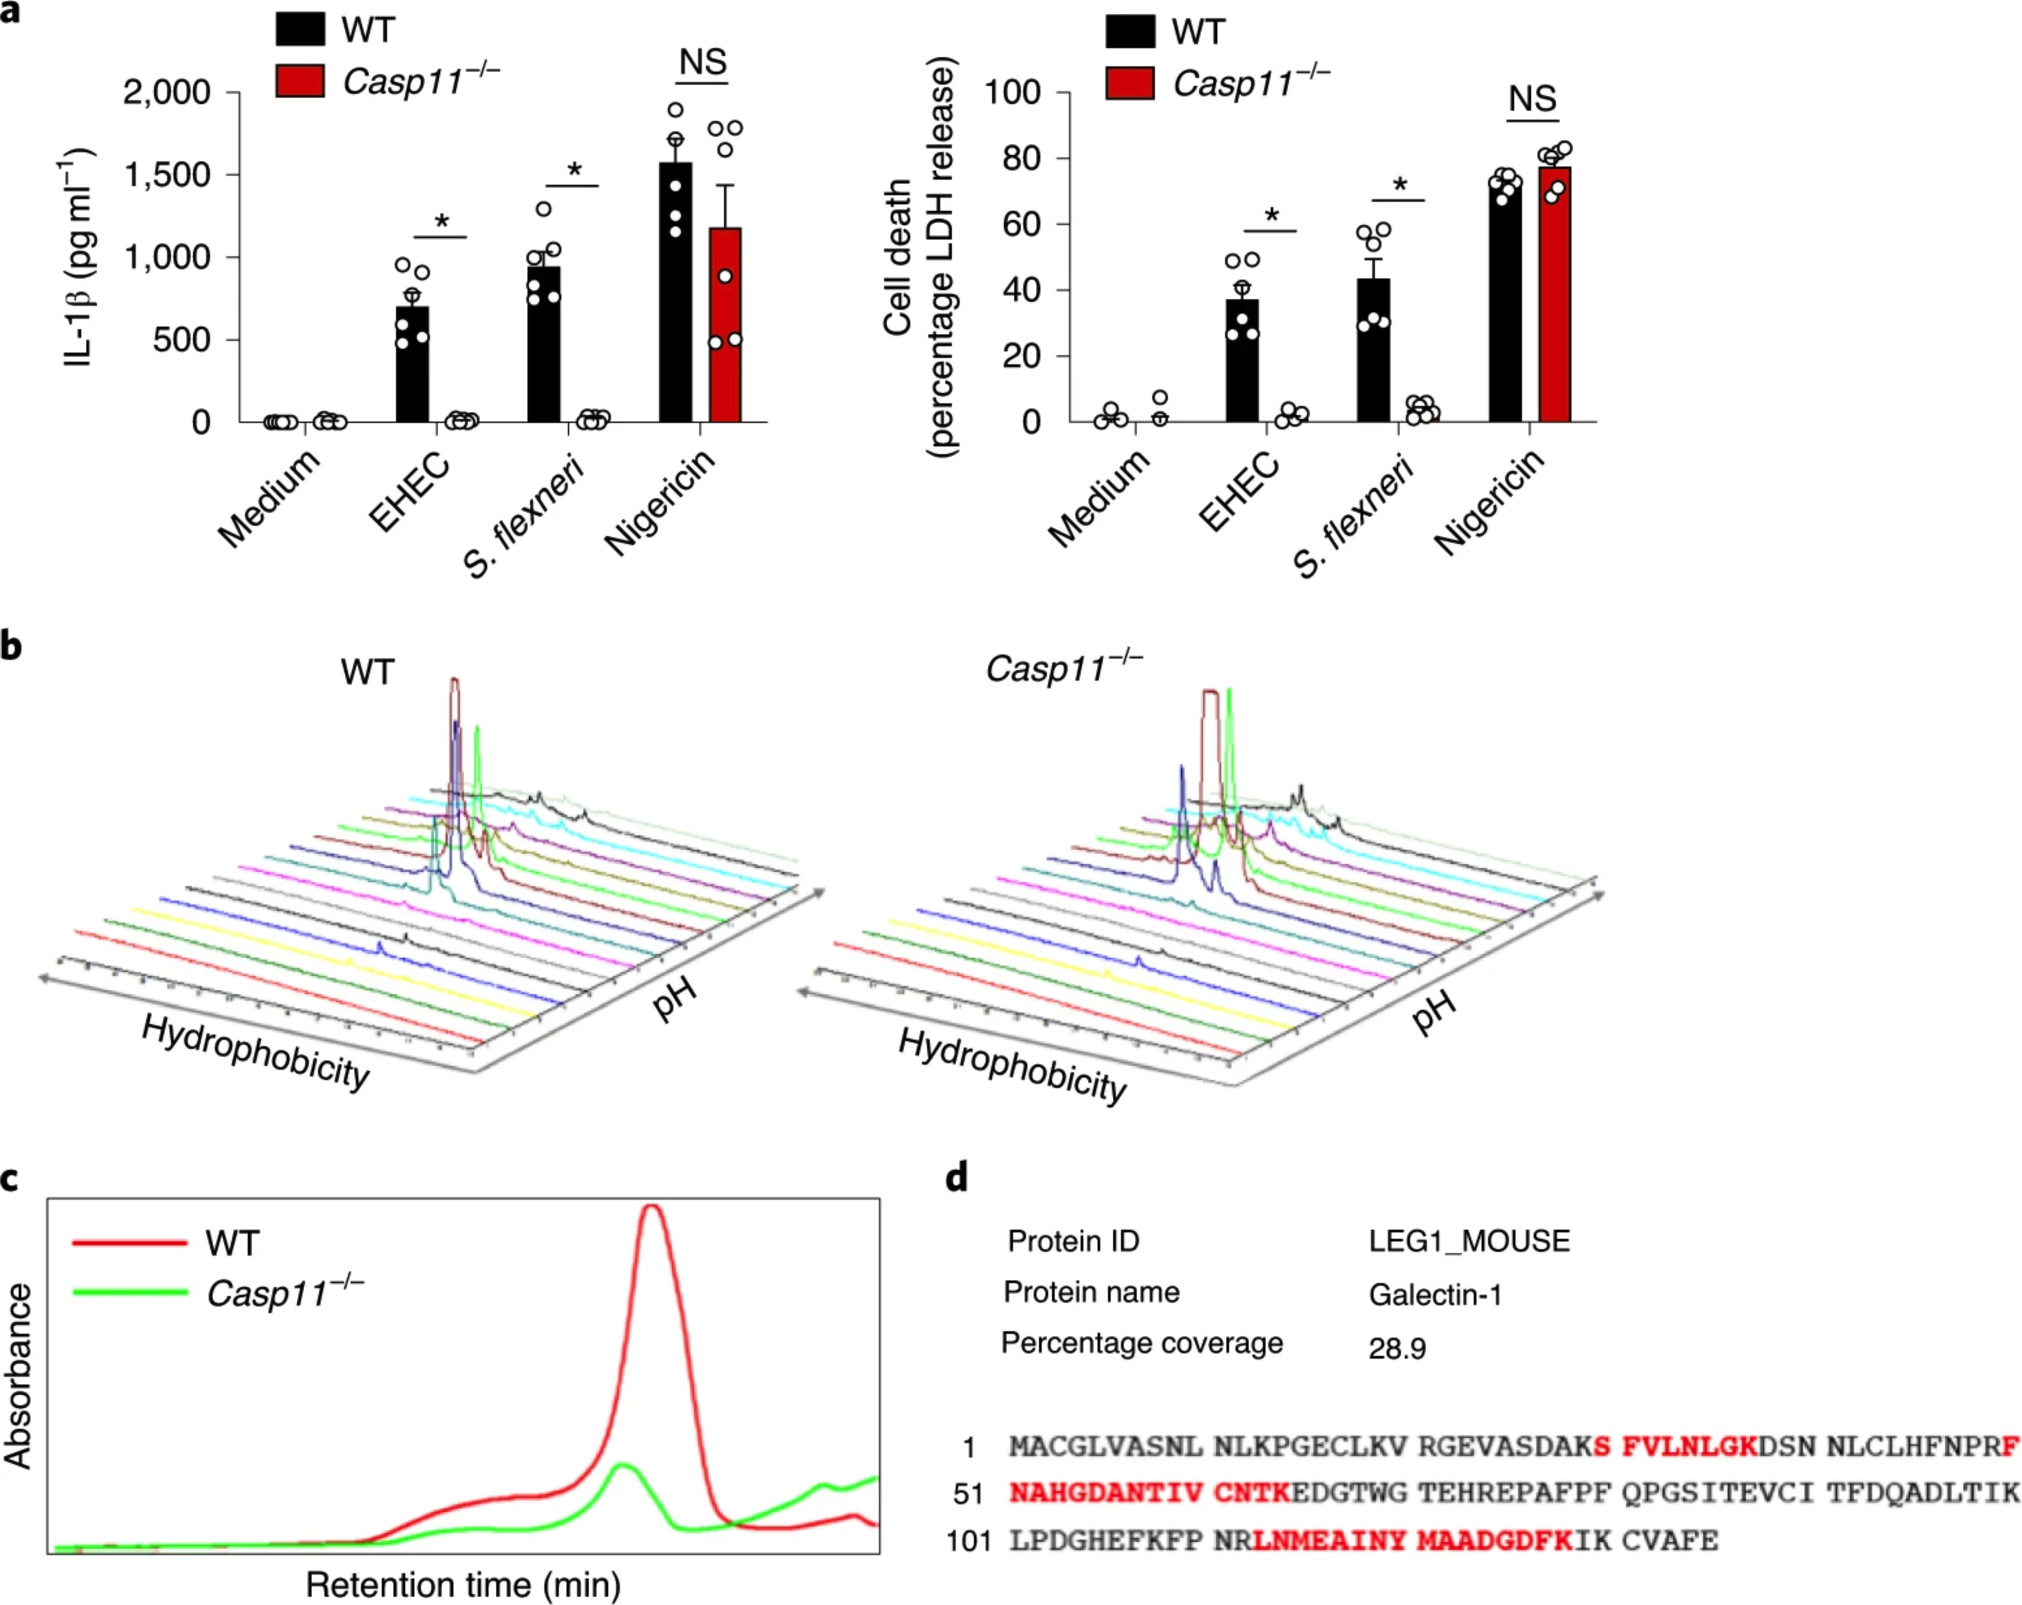
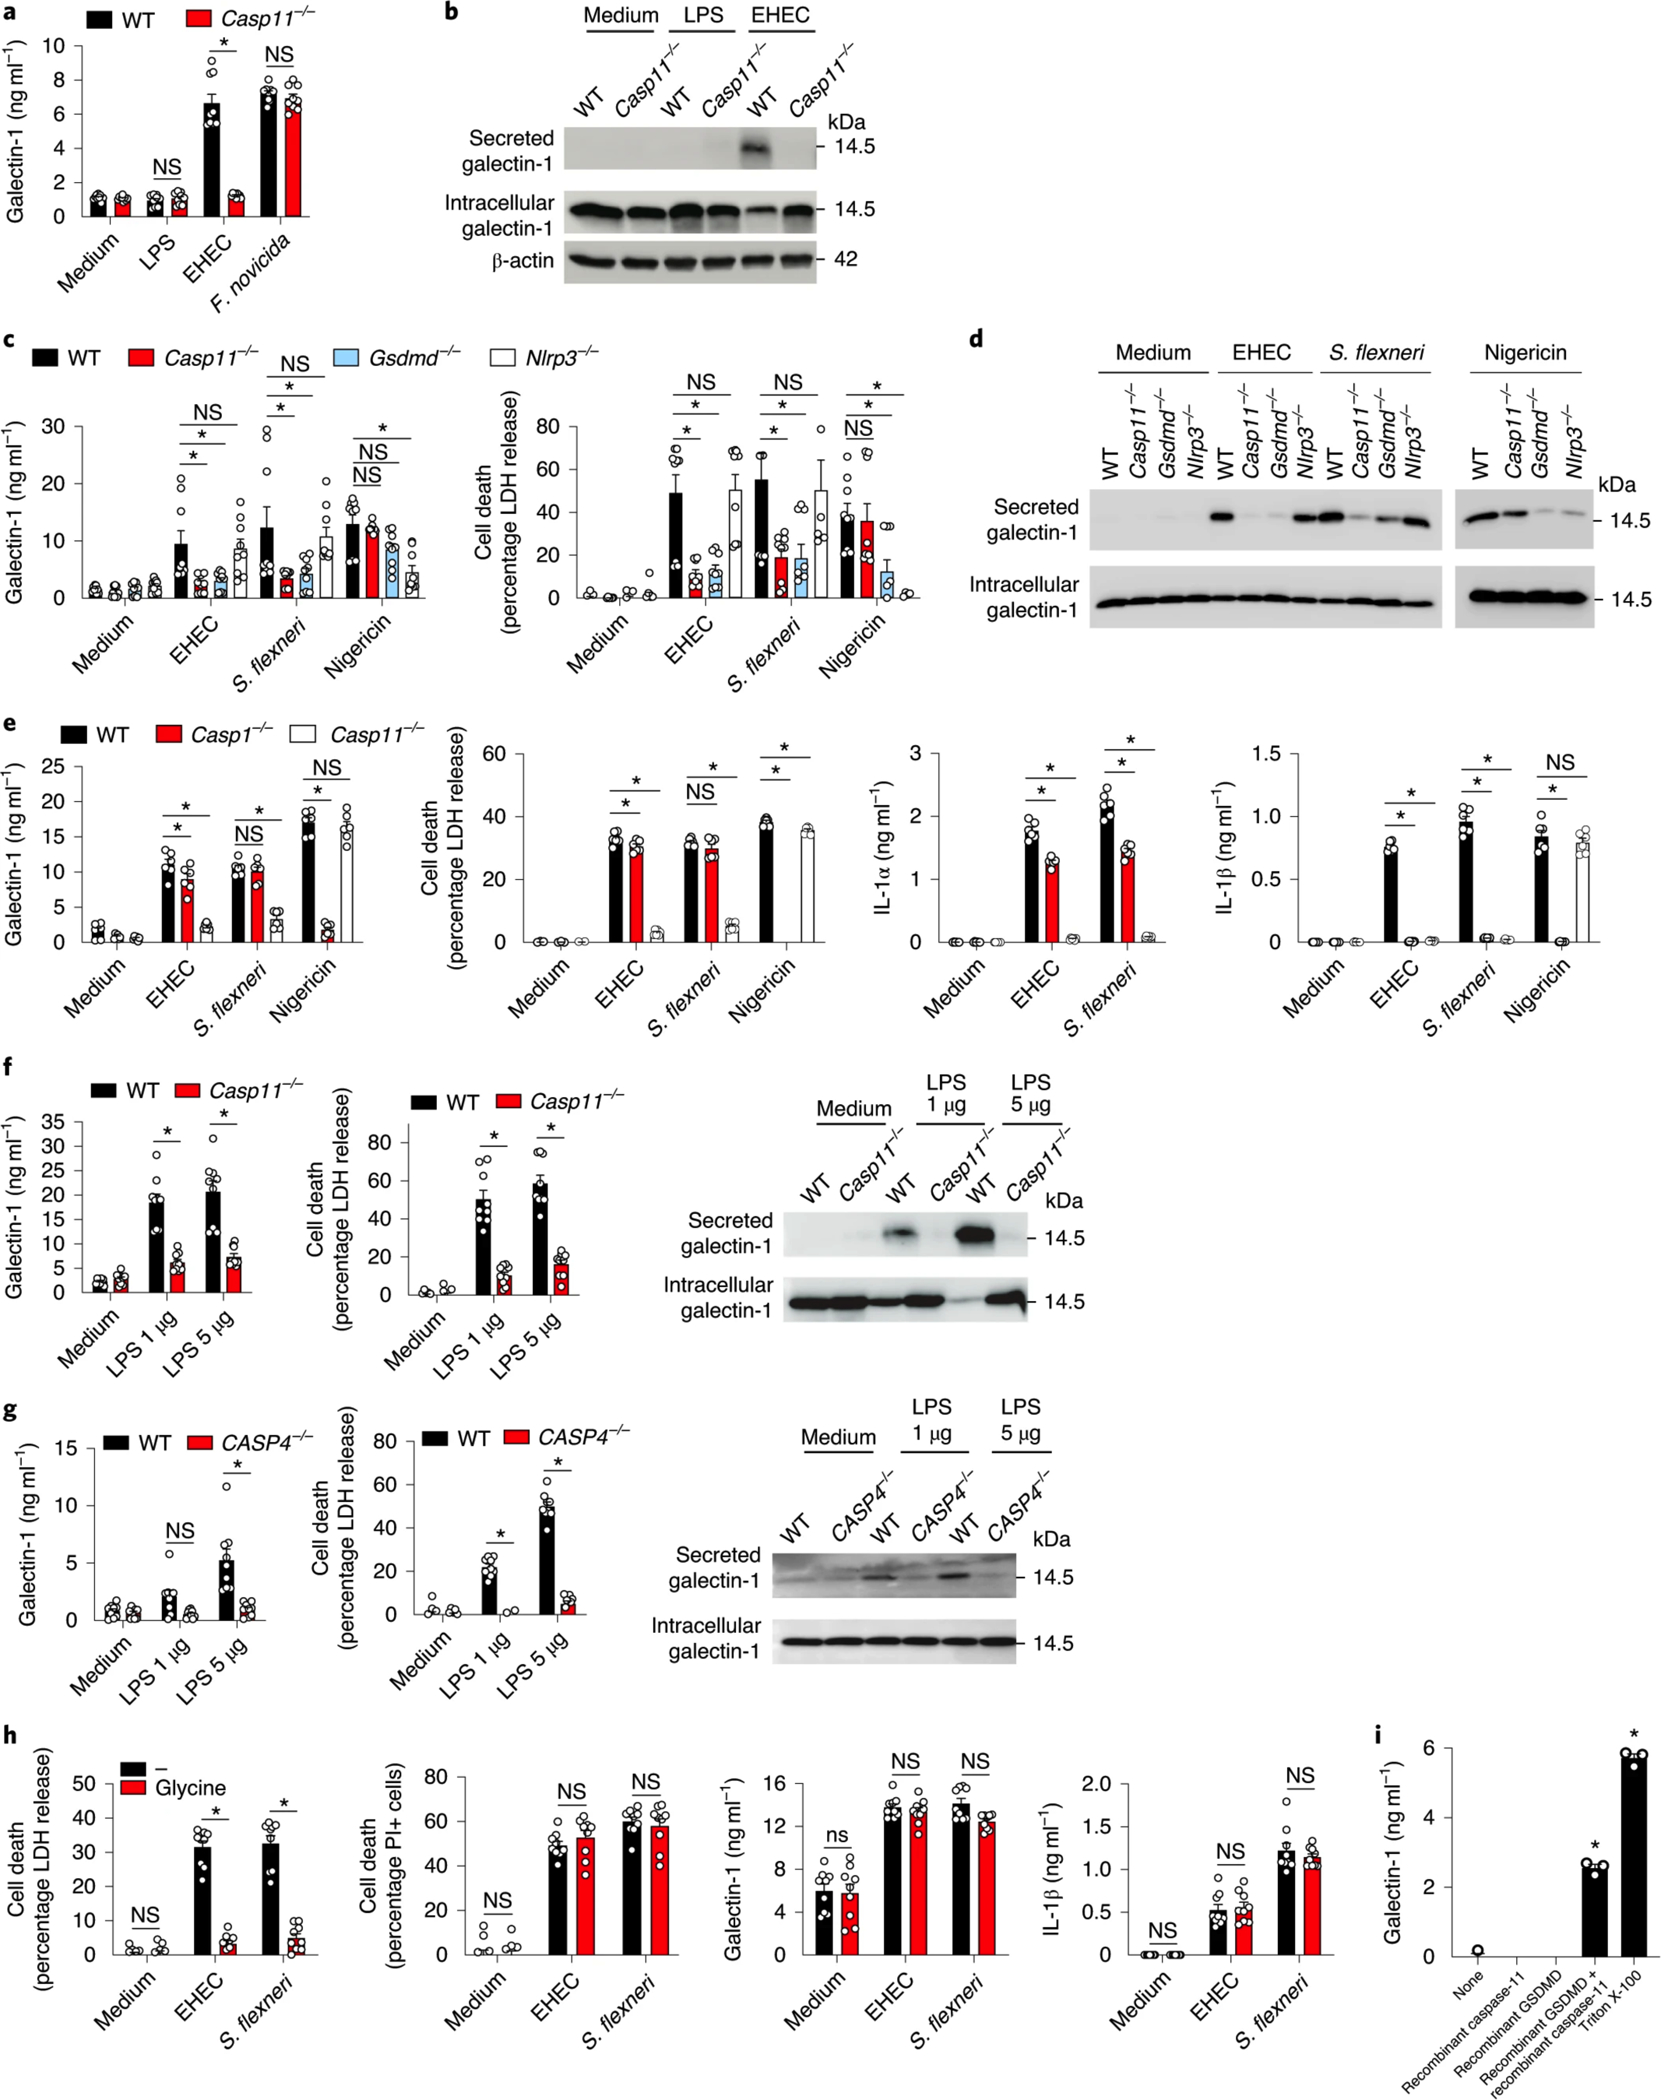
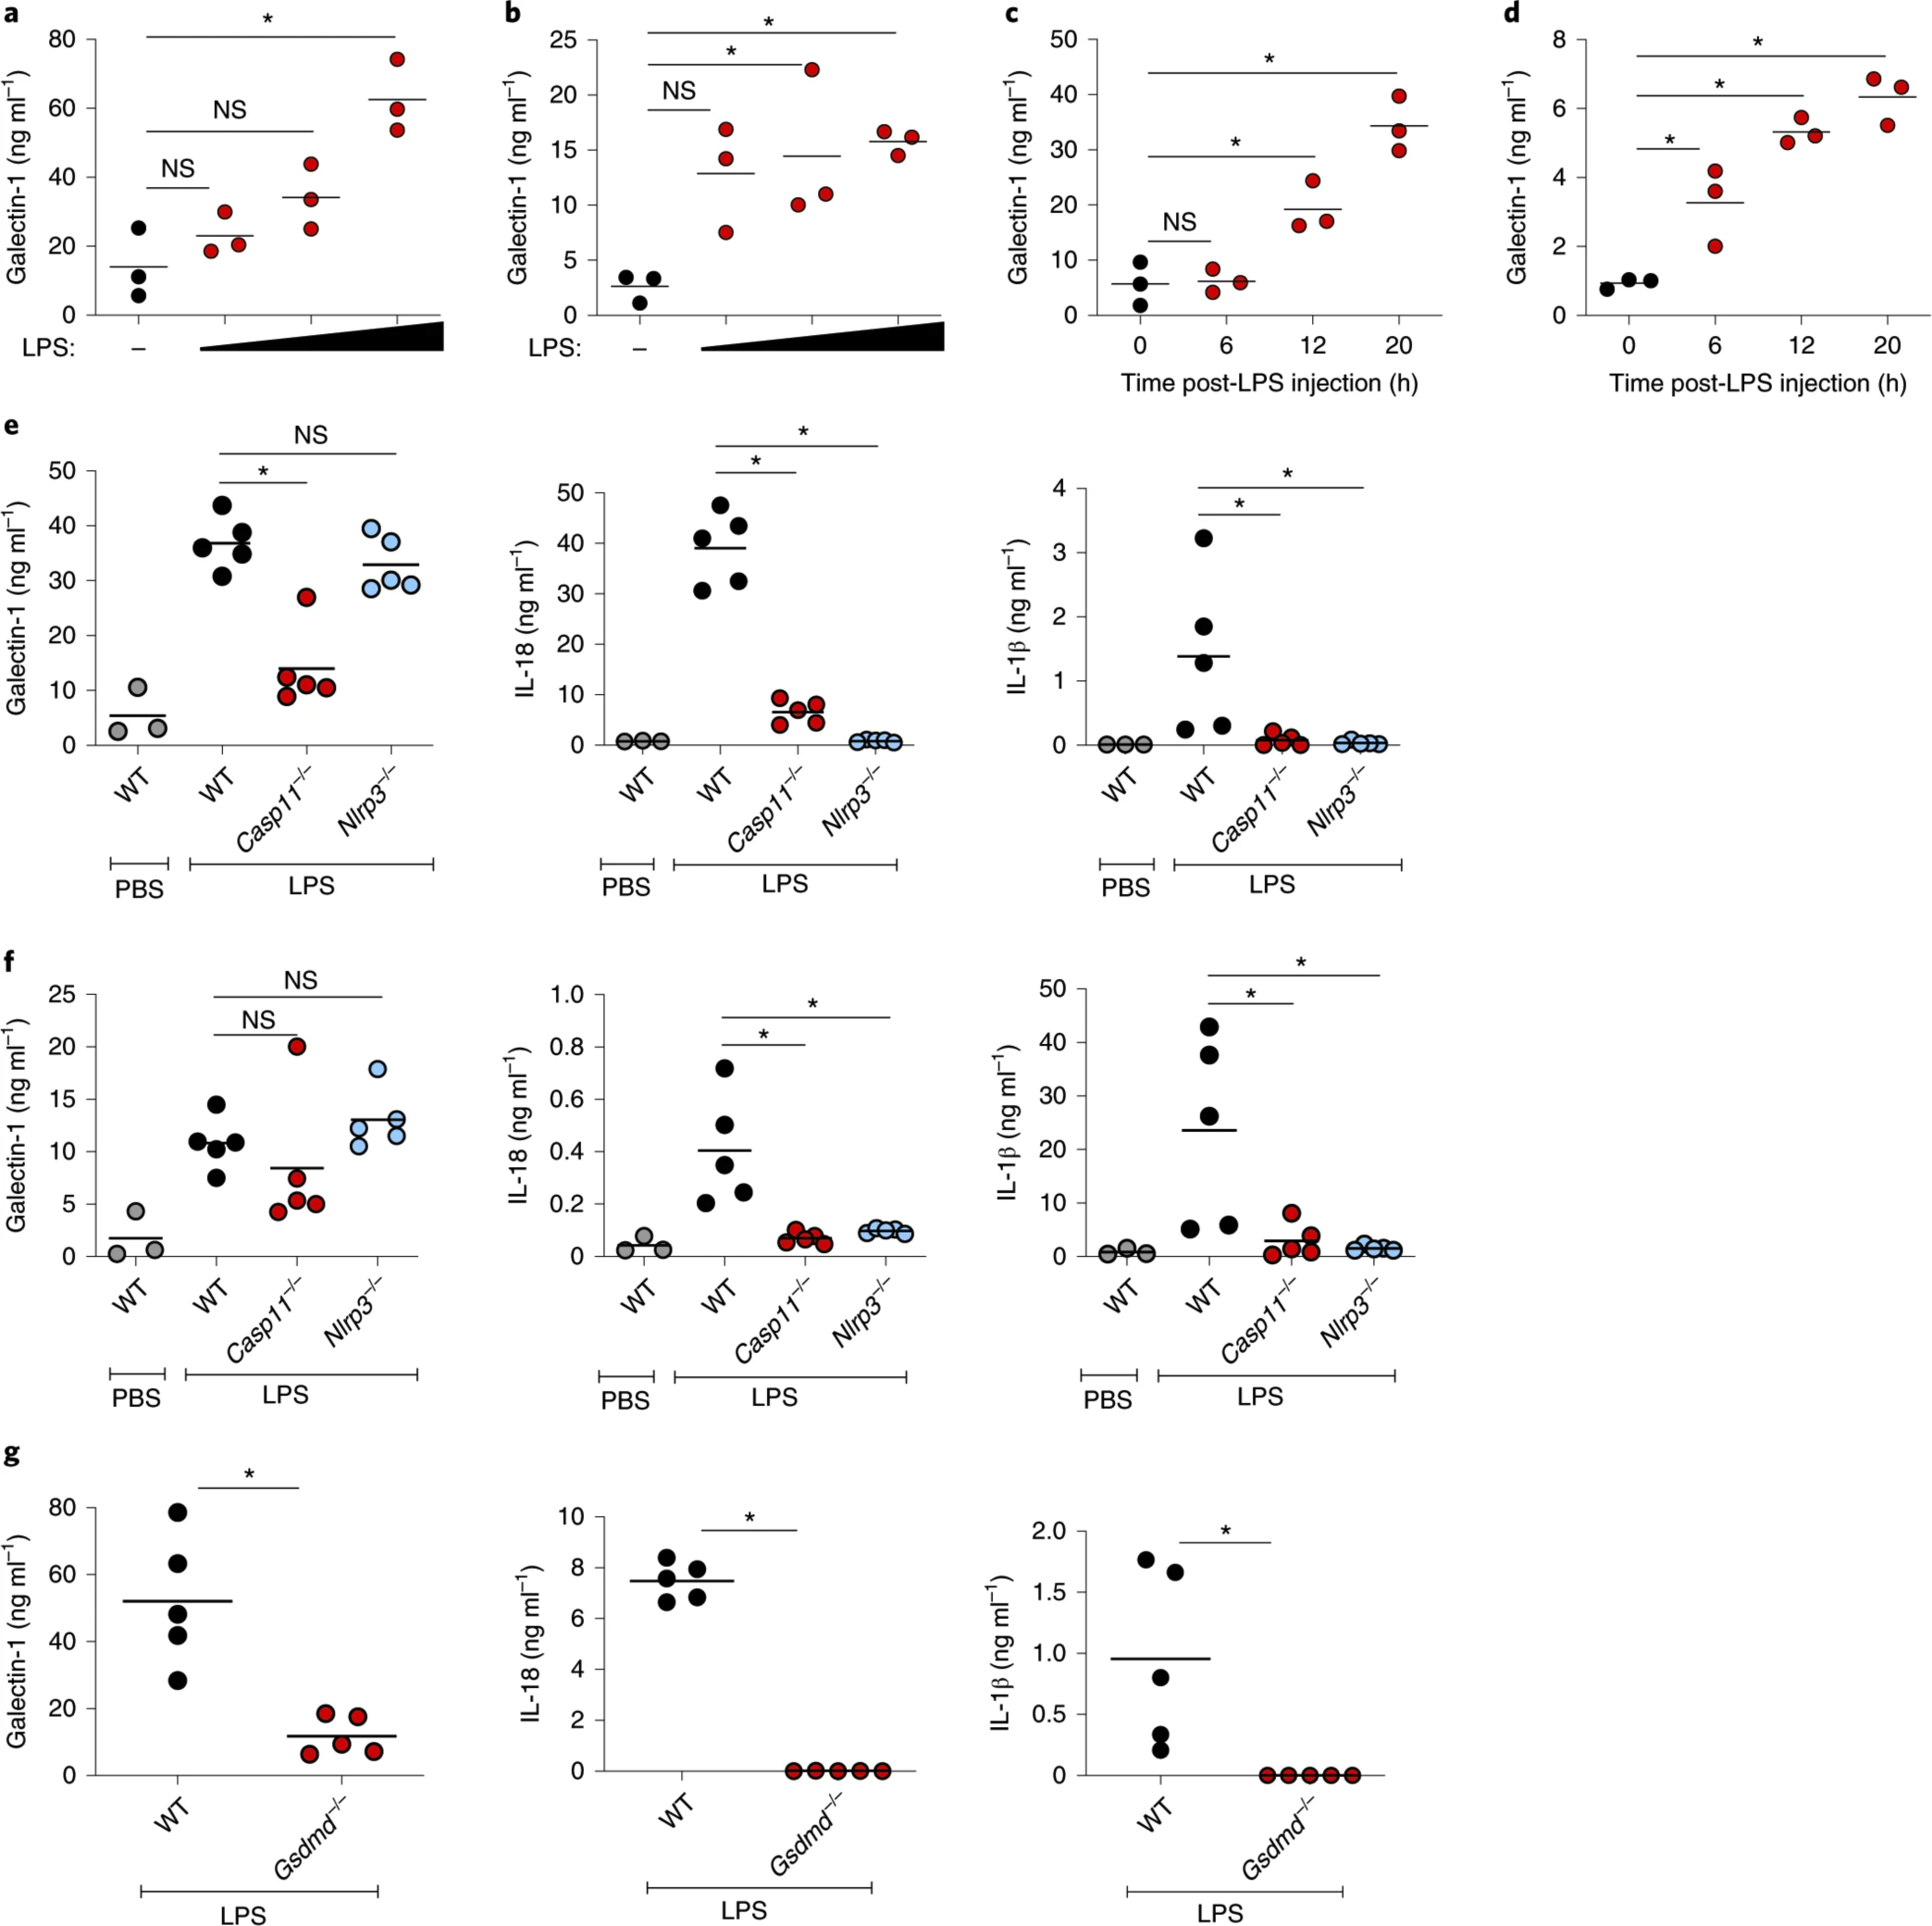
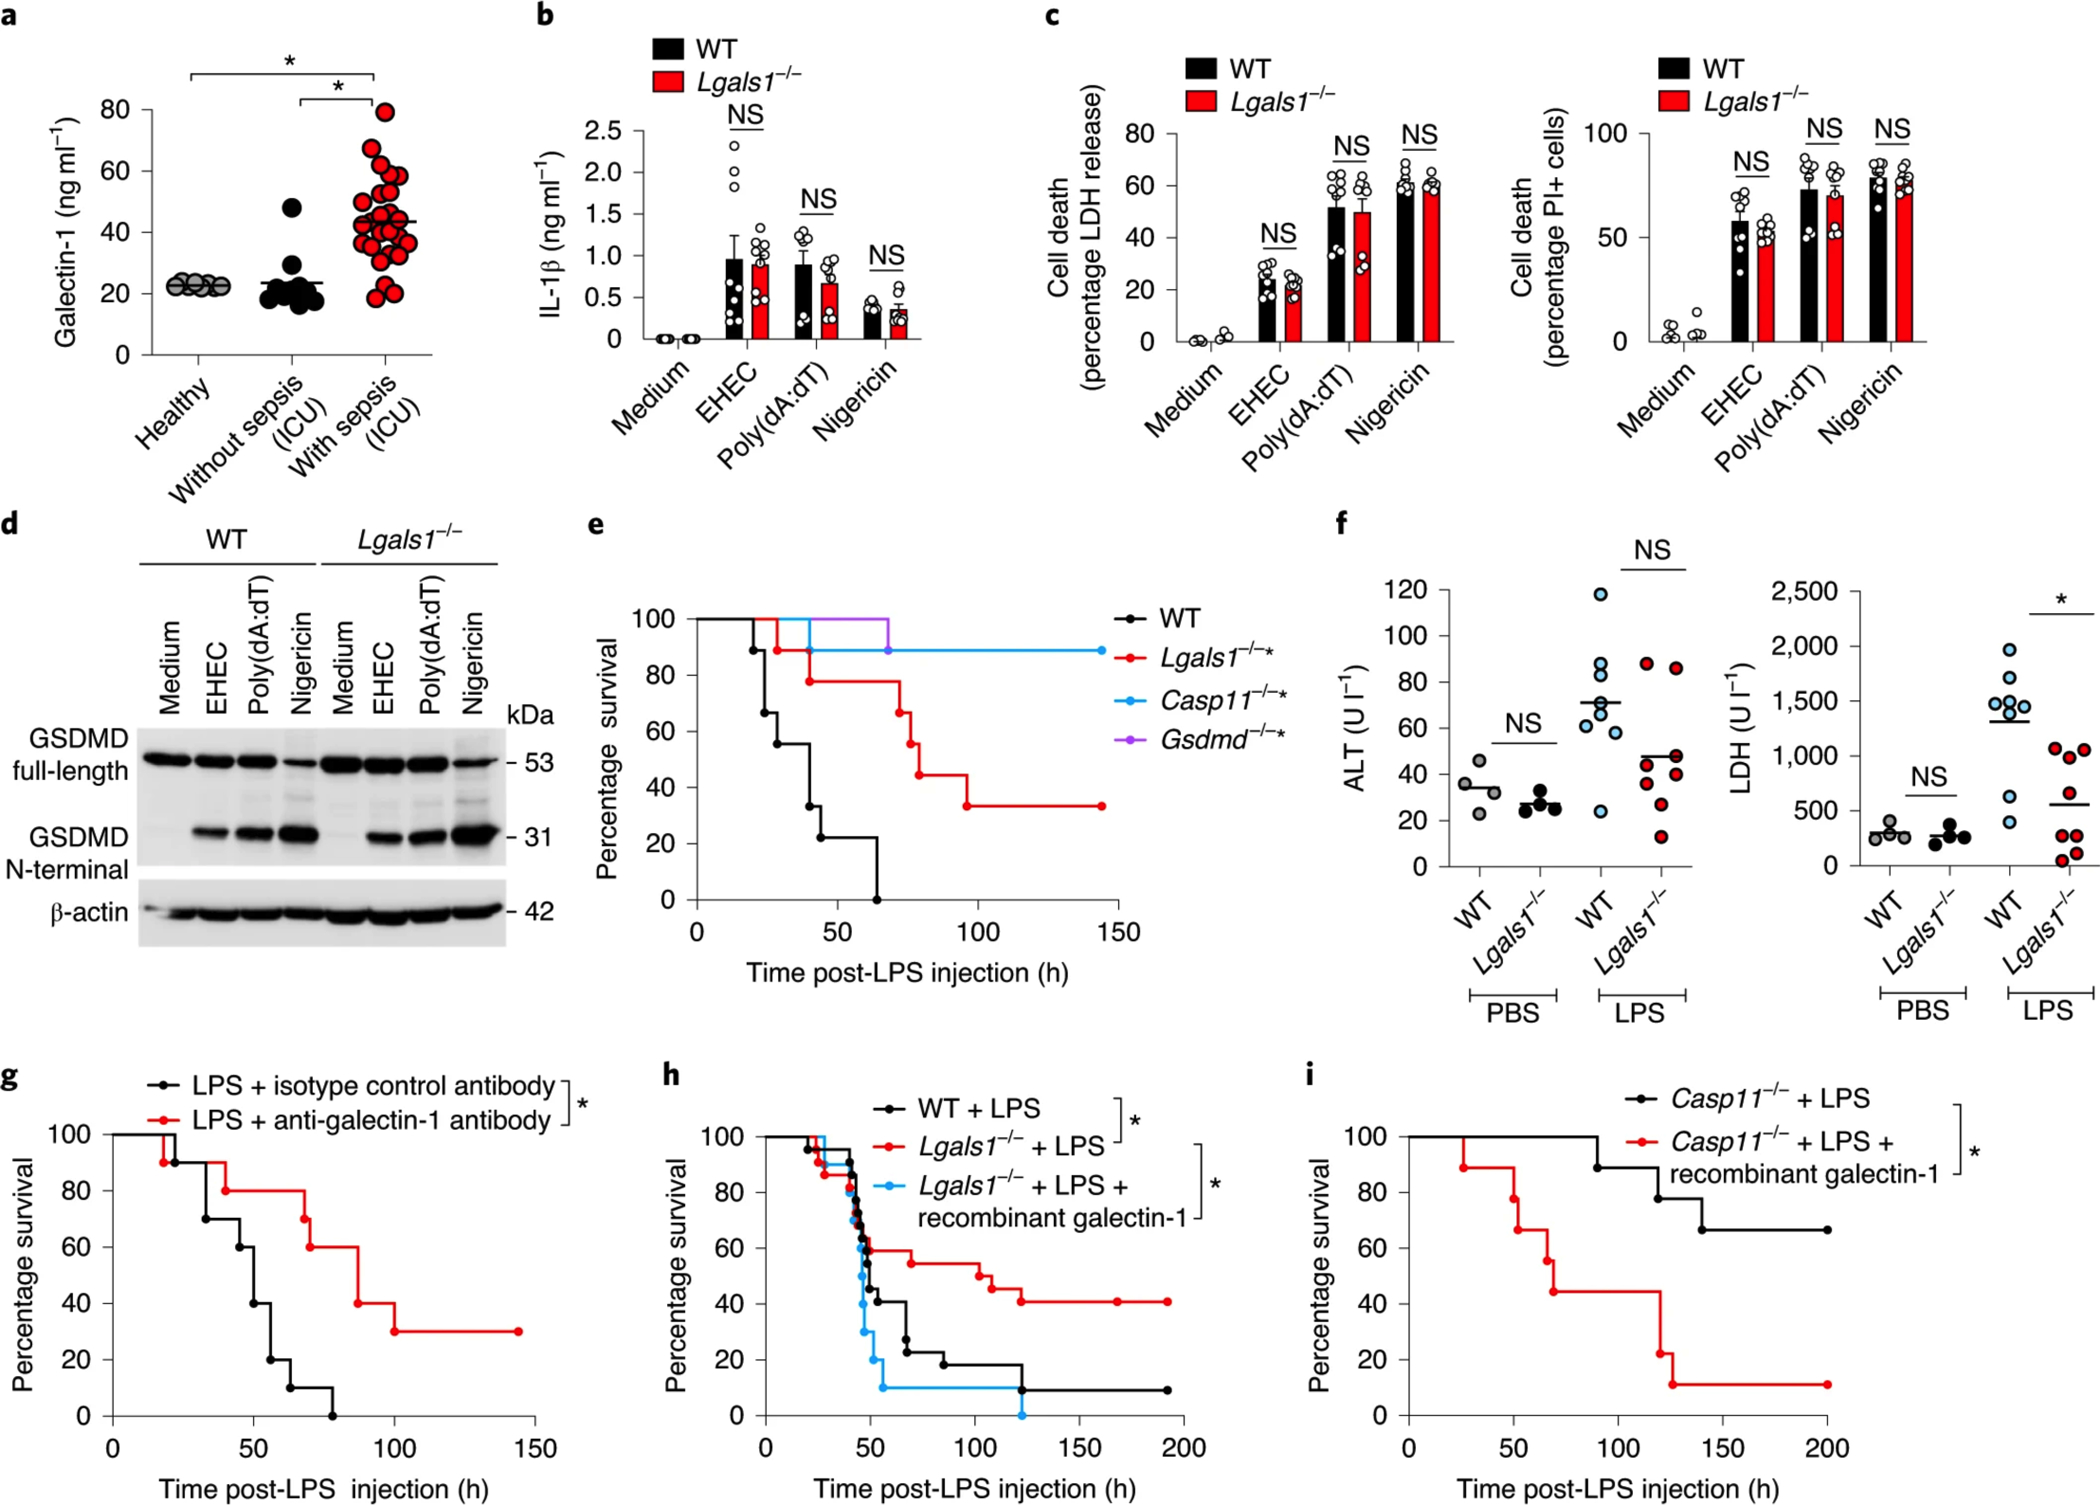
Inflammatory caspase sensing of cytosolic lipopolysaccharide (LPS) triggers pyroptosis and the concurrent release of damage-associated molecular patterns (DAMPs). Collectively, DAMPs are key determinants that shape the aftermath of inflammatory cell death. However, the identity and function of the individual DAMPs released are poorly defined. Our proteomics study revealed that cytosolic LPS sensing triggered the release of galectin-1, a β-galactoside-binding lectin. Galectin-1 release is a common feature of inflammatory cell death, including necroptosis. In vivo studies using galectin-1-deficient mice, recombinant galectin-1 and galectin-1-neutralizing antibody showed that galectin-1 promotes inflammation and plays a detrimental role in LPS-induced lethality. Mechanistically, galectin-1 inhibition of CD45 (Ptprc) underlies its unfavorable role in endotoxin shock. Finally, we found increased galectin-1 in sera from human patients with sepsis. Overall, we uncovered galectin-1 as a bona fide DAMP released as a consequence of cytosolic LPS sensing, identifying a new outcome of inflammatory cell death.


Conflict of interest statement

Competing interests

The authors declare no competing interests.

Figures

Extended Data Fig. 1
Extended Data Fig. 1. Galectin-1 is released as a consequence of inflammasome activation.
a, Experimental design for profiling caspase-11-mediated release of DAMPs by PF2D-based proteomics. WT and Casp11−/− BMDMs were infected with EHEC (MOI=50) for 16 h and supernatants were harvested and concentrated and processed on the Beckman Coulter ProteomeLab PF2D platform. b, Galectin-1 secretion by Pam3CSK4-primed WT and Lgals1/ BMDMs stimulated with EHEC (MOI=50) or poly(dA:dT) transfection for 16 h or 10 μM nigericin for 1 h. c, Immunoblot of galectin-1 (14.5 kDa) in the supernatant and lysates of BMDMs stimulated as in (b). d, IL-1α secretion by Pam3CSK4-primed WT, Casp11/, and Casp1/ BMDMs stimulated with 10 μM nigericin for 1 h. e, Immunoblot of caspase-11 and β-actin in lysates of MS1 endothelial cells transduced with LentiCRISPR V2 plasmid expressing control (GFP) sgRNA or caspase-11 sgRNA. f, Immunoblot of caspase-4 and β-actin in lysates of HeLa cells transduced with LentiCRISPR V2 plasmid expressing control (GFP) sgRNA or caspase-4 sgRNA. g, Immunoblot of GSDMD in the lysates of Pam3CSK4-primed WT BMDMs infected with EHEC or S. flexneri (MOI=50) for 16 h or 10 μM nigericin for 1 h in the presence or absence of 50 mM glycine. h, Galectin-1 release from liposomes packaged with galectin-1 and incubated with either 1 μg recombinant active caspase-11, 2 μg recombinant gasdermin D, both caspase-11 and gasdermin D, or 0.1% Triton X-100. Data are presented as mean ± SEM of one experiment representative of two (b,h; h is the replicate for the Fig. 2i). Combined data from two independent experiments (d) are shown as mean ± SEM. Immunoblots (c,eg) are representative of two independent experiments.
Extended Data Fig. 2
Extended Data Fig. 2. Galectin-1 contributes to lethality during sepsis.
a, Plasma amounts of ALT and LDH in WT, Lgals1−/−, Casp11/, and Gsdmd−/− mice injected i.p. with 5 mg/kg LPS for 18 h. b, Survival of WT (n=9), Lgals1/− (n=9), and Casp11/ mice (n=4) injected i.p. with E. coli (5×10⁸ CFU). c, Survival of Lgals1/ mice injected i.p. with LPS (3 mg/kg) followed by i.p. injection of PBS (n=4), 100 μg of recombinant GFP (n=4), or 100 μg rGal-1 (n=4) 1 h later. d, Survival of Lgals1−/− mice injected i.p. with LPS (3 mg/kg) followed by i.p. injection of 100 μg of rGal-1 (n=6) or heat inactivated rGal-1 (HI rGal-1) (n=6) 1 h later. e, TNF and IL-6 secretion by WT BMDMs stimulated with 5 μM rGal-1 or 1 μg LPS for 16 h. f, Survival of WT and Casp11−/− mice injected i.p. with PBS (n=3) or 100 μg of rGal-1 (n=3). Combined data from two independent experiments are shown (b,d, and e). In (e) data are presented as mean ± SEM. In (a), each circle represents a mouse and the horizontal lines represent mean. ns, not significant (one-way ANOVA). *p < 0.05, one-way ANOVA (a); Mantel-Cox test (d).
Extended Data Fig. 3
Extended Data Fig. 3. Galectin-1 amplifies systemic inflammatory responses during LPS shock.
a,b, Cytokine and chemokine levels in the lung (a) and spleen (b) homogenates of WT and Lgals1−/− mice injected i.p. with 5 mg/kg LPS for 20 h. Combined data from two independent experiments are shown. Each circle represents a mouse and the horizontal lines represent mean. *p < 0.05; unpaired two-tailed t test (ab); ns, not significant.
Extended Data Fig. 4:
Extended Data Fig. 4:. Galectin-1 amplifies systemic inflammatory responses during endotoxemia.
a, Indicated cytokine and chemokine levels in the plasma of WT (n=5), Lgals1−/− (n=5), Casp11−/− (n=5), and Gsdmd−/− (n=5) mice injected i.p. with 5 mg/kg LPS for 20 h. Each circle represents a mouse and the horizontal lines represent mean. *p < 0.05; one-way ANOVA followed by Sidak’s post-test.
Extended Data Fig. 5:
Extended Data Fig. 5:. Galectin-1 functions in a glycan-dependent manner during endotoxemia.
a, Survival of WT, Mgat5−/−, and C2gnt1−/− mice injected i.p. with 5 mg/kg LPS followed by i.p. injection of PBS or 100 μg of rGal-1 1 h later (WT LPS PBS n=6, WT LPS rGal-1 n=7, Mgat5/ LPS PBS n=5, Mgat5/ LPS rGal-1 n=5, C2gnt1/ LPS PBS n=9 and C2gnt1/ LPS rGal-1 n=11). b, Plasma amounts of ALT and LDH in WT (n=6), Mgat5−/− (n=5), and C2gnt1−/− (n=9) mice injected i.p. with 5 mg/kg LPS for 18 h. c, Galectin-1 levels in the plasma of WT (n=6), Mgat5−/− (n=5), and C2gnt1−/− (n=9) mice injected i.p. with 5 mg/kg LPS for 18 h. d, Immunoblot of CD45 that was immunoprecipitated with anti-CD45 antibody or IgG control antibody from the spleen homogenates of WT mice. Each circle represents a mouse and the horizontal lines represent mean (b,c). ns, not significant; one-way ANOVA followed by the Sidak’s post-test. Immunoblots (d) are representative of two independent experiments (d).
Fig. 1:
Fig. 1:. Proteomic identification of intracellular LPS-elicited release of galectin-1.
a, IL-1β and LDH release by Pam3CSK4 (0.5 μg ml−1)-primed WT and Casp11−/− BMDMs infected with EHEC or S. flexneri (MOI = 50) for 16 h or stimulated with 10 μM nigericin for 1 h. NS, not significant. b,c, 2D global proteomic maps of supernatants from EHEC-infected WT and Casp11−/− BMDMs generated by integrating the OD 214 nm absorbance of first- and second-dimension (hydrophobicity versus pH) fractions in the ProteoVue program (b). The chromatogram of a second-dimension fraction shows a peak in the WT but not in the Casp11−/− sample (c). d, LC– MS/MS analysis of the peaks shown in c identified galectin-1 only in the WT but not in the Casp11−/− sample. The amino acid sequence of galectin-1 and the matched peptides identified in LC–MS/MS (in bold red) are shown. a, The combined data from two independent experiments are shown as the mean ± s.e.m. *P < 0.05; two-way ANOVA followed by Šidák’s post-test.
Fig. 2:
Fig. 2:. Cytosolic LPS-induced galectin-1 release in vitro is dependent on caspase-11/4 and GSDMD.
a, Galectin-1 release by Pam3CSK4-primed WT and Casp11−/− BMDMs stimulated with LPS (1 μg ml−1) to activate TLR4 or infected with EHEC (MOI = 50) to activate caspase-11 or infected with F. novicida (MOI = 50) to activate AIM2 for 16 h as measured by ELISA. b, Immunoblot of galectin-1 (14.5 kDa) in the supernatant and lysates of BMDMs stimulated with LPS (1 μg ml−1) or EHEC (MOI = 50) for 16 h. c, Galectin-1 release and cell death (LDH release) in Pam3CSK4-primed WT, Casp11−/−, Gsdmd−/− and Nlrp3−/− BMDMs infected with EHEC or S. flexneri (MOI = 50) for 16 h or stimulated with 10 μM nigericin for 1 h as measured by ELISA. d, Immunoblot of galectin-1 (14.5 kDa) in the supernatants and lysates of BMDMs stimulated as in c. e, Galectin-1, IL-1α and IL-1β release and LDH release by Pam3CSK4-primed WT, Casp11−/− and Casp1−/− BMDMs infected with EHEC or S. flexneri (MOI = 50) for 16 h or stimulated with 10 μM nigericin for 1 h. f, Galectin-1 and LDH release by LPS-primed WT and Casp11-deficient MS1 endothelial cells electroporated with LPS (1 or 5 μg) for 2 h. Immunoblot of galectin-1 (14.5 kDa) in the supernatants and lysates of WT and Casp11-deficient MS1 endothelial cells stimulated as above. g, Galectin-1 and LDH release by LPS-primed WT and CASP4-deficient HeLa cells electroporated with LPS (1 or 5 μg) for 2 h. Immunoblot of galectin-1 (14.5 kDa) in the supernatants and lysates of WT and CASP4-deficient HeLa cells stimulated as above. h, LDH release, PI uptake, galectin-1 release and IL-1β release by Pam3CSK4-primed WT BMDMs infected with EHEC or S. flexneri (MOI = 50) for 16 h in the presence or absence of 50 mM glycine. i, Galectin-1 release from liposomes packaged with galectin-1 and incubated with either 1 μg of recombinant active caspase-11, 2 μg of recombinant GSDMD, both caspase-11 and GSDMD or 0.1% Triton X-100. Combined data from three (a,c,fh) or two (e) independent experiments are shown as the mean ± s.e.m. i, Data are presented as mean ± s.e.m. of one experiment representative of two (data from the replicate experiment are shown in Extended Data Fig. 1h). b,d,f,g, Immunoblots are representative of two independent experiments. *P < 0.05 for WT versus indicated knockouts; one-way (i) or two-way ANOVA (a,c,e,fh) followed by Šidák’s post-test.
Fig. 3:
Fig. 3:. Cytosolic LPS-induced release of galectin-1 is dependent on caspase-11 and GSDMD in vivo.
a,b, Galectin-1 levels in the plasma (a) and peritoneal lavage (b) of WT mice (n = 3) injected intraperitoneally with PBS or increasing amounts of LPS (50–200 μg) at 18 h post-injection as measured by ELISA. c,d, Galectin-1 levels in the plasma (c) and peritoneal lavage (d) of WT mice (n = 3) at 0, 6, 12 and 20 h post-LPS (200 μg) injection. e,f, Galectin-1, IL-18 and IL-1β levels in the plasma (e) and peritoneal lavage (f) of WT, Casp11−/− or Nlrp3−/− mice at 18 h post-LPS (200 μg) injection. g, Galectin-1, IL-18 and IL-1β in the plasma of WT and Gsdmd−/− mice at 18 h post-LPS (200 μg) injection. Data presented are from one experiment representative of two. ag, Each circle represents a mouse and the horizontal lines represent the mean. *P < 0.05; one-way ANOVA followed by Šidák’s post-test (af) or unpaired two-tailed t-test (g).
Fig. 4:
Fig. 4:. Necroptosis triggers galectin-1 release.
a, Galectin-1 and LDH release by L929 cells stimulated with DMSO, TNF + zVAD and poly(I:C) + zVAD in the presence or absence of the RIPK3 inhibitors GSK872 or GSK843 (1 μM). Cells were treated with inhibitors 1 h before stimulation and supernatants were collected at 18 h. The immunoblot of phospho-MLKL and total MLKL in the lysates of L929 cells stimulated as above is shown. b, Galectin-1 and LDH release by RAW 264.7 macrophages stimulated with DMSO, LPS + zVAD, poly(I:C) + zVAD and the SMAC mimetic LCL-161 + zVAD in the presence or absence of the RIPK3 inhibitors GSK872 or GSK843 (2.5 μM). Cells were treated with inhibitors 1 h before stimulations and supernatants were collected at 18 h. Immunoblot of phospho-MLKL and total MLKL in the lysates of RAW 264.7 macrophages stimulated as above. c, Galectin-1 levels in the plasma (left) and peritoneal cavity (right) of WT mice (n = 6) injected intraperitoneally with 500 μg kg−1 TNF at 6, 12 and 20 h. Combined data from three independent experiments are shown as the mean ± s.e.m. a,b, Immunoblots are representative of two independent experiments. c, Combined data from two independent experiments are shown; each circle represents a mouse and the horizontal lines represent the mean (n = 6). *P < 0.05; two-way (a,b) or oneway (c) ANOVA followed by Šidák’s post-test.
Fig. 5:
Fig. 5:. Galectin-1 plays a detrimental role during LPS septic shock.
a, Galectin-1 levels in the serum of humans (healthy volunteers (n = 8), patients without sepsis in the ICU (n = 10) or patients with sepsis in the ICU (n = 25)). b,c, IL-1β release (b), LDH release and PI uptake (c) in Pam3CSK4-primed WT and Lgals1−/− BMDMs stimulated with EHEC (MOI = 50) or poly(dA:dT) for 16 h or 10 μM nigericin for 1 h. d, Immunoblot of GSDMD in the lysates of WT and Lgals1−/− BMDMs stimulated as in b,c. e, Survival of WT, Lgals1−/−, Casp11−/− and Gsdmd−/− mice (n = 9) injected intraperitoneally with 5 mg kg−1 LPS. f, Plasma levels of ALT and LDH in WT and Lgals1−/− mice injected intraperitoneally with PBS (n = 4) or 5 mg kg−1 LPS (n = 8) for 18 h. g, Survival of WT mice injected intraperitoneally with 5 mg kg−1 LPS followed by intraperitoneal injection of 250 μg of anti-galectin-1 antibody or an isotype control antibody (n = 10). h, Survival of WT mice (n = 22) and Lgals1−/− mice (n = 22) injected intraperitoneally with 3–5 mg kg−1 LPS followed by PBS or 100 μg of recombinant galectin-1 (n = 10) 1 h later. i, Survival of Casp11−/− mice injected intraperitoneally with LPS (20 mg kg−1) followed by intraperitoneal injection of PBS (n = 9) or 100 μg of recombinant galectin-1 (n = 9) 1 h later. The combined data from three (b,c) or two (ei) independent experiments are shown. a, Each circle represents a human patient or healthy volunteer as indicated, and the horizontal lines represent the mean. b,c, Data are presented as the mean ± s.e.m. f, Each circle represents a mouse and the horizontal lines represent the mean. d, Immunoblots are representative of two independent experiments. *P < 0.05; one-way (a) or two-way ANOVA (b,c) followed by Šidák’s post-test, unpaired two-tailed t-test (f) or Mantel–Cox test (e,gi). e, *P < 0.05 for WT versus each genotype.
Fig. 6:
Fig. 6:. Galectin-1 amplifies systemic inflammatory responses during LPS shock.
a, Cytokines and chemokines in the plasma of WT and Lgals1−/− mice injected intraperitoneally with PBS or 5 mg kg−1 LPS for 20 h. b, Scatter plots of differentially expressed genes (red) in the spleens and lungs of WT and Lgals1−/− mice at 8 h post-LPS (5 mg kg−1) injection as identified by RNA-seq analysis. The RNA from the spleens and lungs of two mice was pooled and subjected to RNA-seq. c, Bar graphs of 39 canonical pathways (z-score and the −log P values > 2) that were differentially regulated in both the spleens and lungs of WT and Lgals1−/− mice treated as above. d, Heatmap of genes included in 39 canonical pathways that were differentially regulated in both the spleens and lungs of WT and Lgals1−/− mice treated as above. Only genes that were differentially expressed in both organs are shown. a, Combined data from two independent experiments are shown. Each circle represents a mouse and the horizontal lines represent the mean. *P < 0.05; unpaired two-tailed t-test.
Fig. 7:
Fig. 7:. Galectin-1 inhibition of CD45 underlies its detrimental role in endotoxin shock.
a, Survival of WT, Mgat5−/− and C2gnt1−/− mice (n = 10) injected intraperitoneally with 5 mg kg−1 LPS. b, Cytokines and chemokines in the plasma of WT, Mgat5−/− and C2gnt1−/− mice injected intraperitoneally with 5 mg kg−1 LPS for 18 h. c, CD45-specific phosphatase activity in the spleen homogenates of WT and Lgals1−/− mice injected intraperitoneally with 5 mg kg−1 LPS for 20 h (normalized using a CD45 phosphatase inhibitor). d, Phosphatase activity of CD45 immunoprecipitated from the spleen homogenates of WT and Lgals1−/− mice injected intraperitoneally with 5 mg kg−1 LPS for 20 h (normalized using a CD45 phosphatase inhibitor). The immunoblot of CD45 that was immunoprecipitated from the spleen homogenates of WT and Lgals1−/− mice, treated as described above, with anti-CD45 antibody or IgG isotype control is shown. e, Immunoblot of phospho-Src and non-phospho-Src family proteins in the spleen lysates of WT and Lgals1−/− mice injected intraperitoneally with 5 mg kg−1 LPS for 20 h. Densitometric analysis of phospho-Src in WT versus Lgals1−/− spleens normalized to non-phospho-Src. f, Survival of Lgals1−/− mice injected intraperitoneally with 5 mg kg−1 LPS followed by intraperitoneal injection of either neutralizing anti-CD45 antibody (n = 6) or an isotype control antibody (n = 6) 1 h later. b, Each circle represents a mouse and the horizontal lines represent the mean. ce, Each circle represents a mouse and the data are presented as the mean ± s.e.m. (n = 5). d,e, Immunoblots are representative of two independent experiments. *P < 0.05; Mantel–Cox test (a,f), one-way ANOVA followed by Šidák’s post-test (b) and unpaired two-tailed t-test (ce).

References

    1. Rathinam VAK & Fitzgerald KA Inflammasome complexes: emerging mechanisms and effector functions. Cell 165, 792–800 (2016). - PMC - PubMed
    1. Kayagaki N et al. Caspase-11 cleaves gasdermin D for non-canonical inflammasome signalling. Nature 526, 666–671 (2015). - PubMed
    1. Shi J et al. Cleavage of GSDMD by inflammatory caspases determines pyroptotic cell death. Nature 526, 660–665 (2015). - PubMed
    1. Shi J et al. Inflammatory caspases are innate immune receptors for intracellular LPS. Nature 514, 187–192 (2014). - PubMed
    1. Kayagaki N et al. Noncanonical inflammasome activation by intracellular LPS independent of TLR4. Science 341, 1246–1249 (2013). - PubMed

Publication types

MeSH terms