Review
. 2021 Feb;18(2):144-155.
doi: 10.1038/s41592-020-01013-2. Epub 2021 Jan 4.

A practical guide to cancer subclonal reconstruction from DNA sequencing

Affiliations
Review

A practical guide to cancer subclonal reconstruction from DNA sequencing

Maxime Tarabichi et al. Nat Methods. 2021 Feb.

Abstract

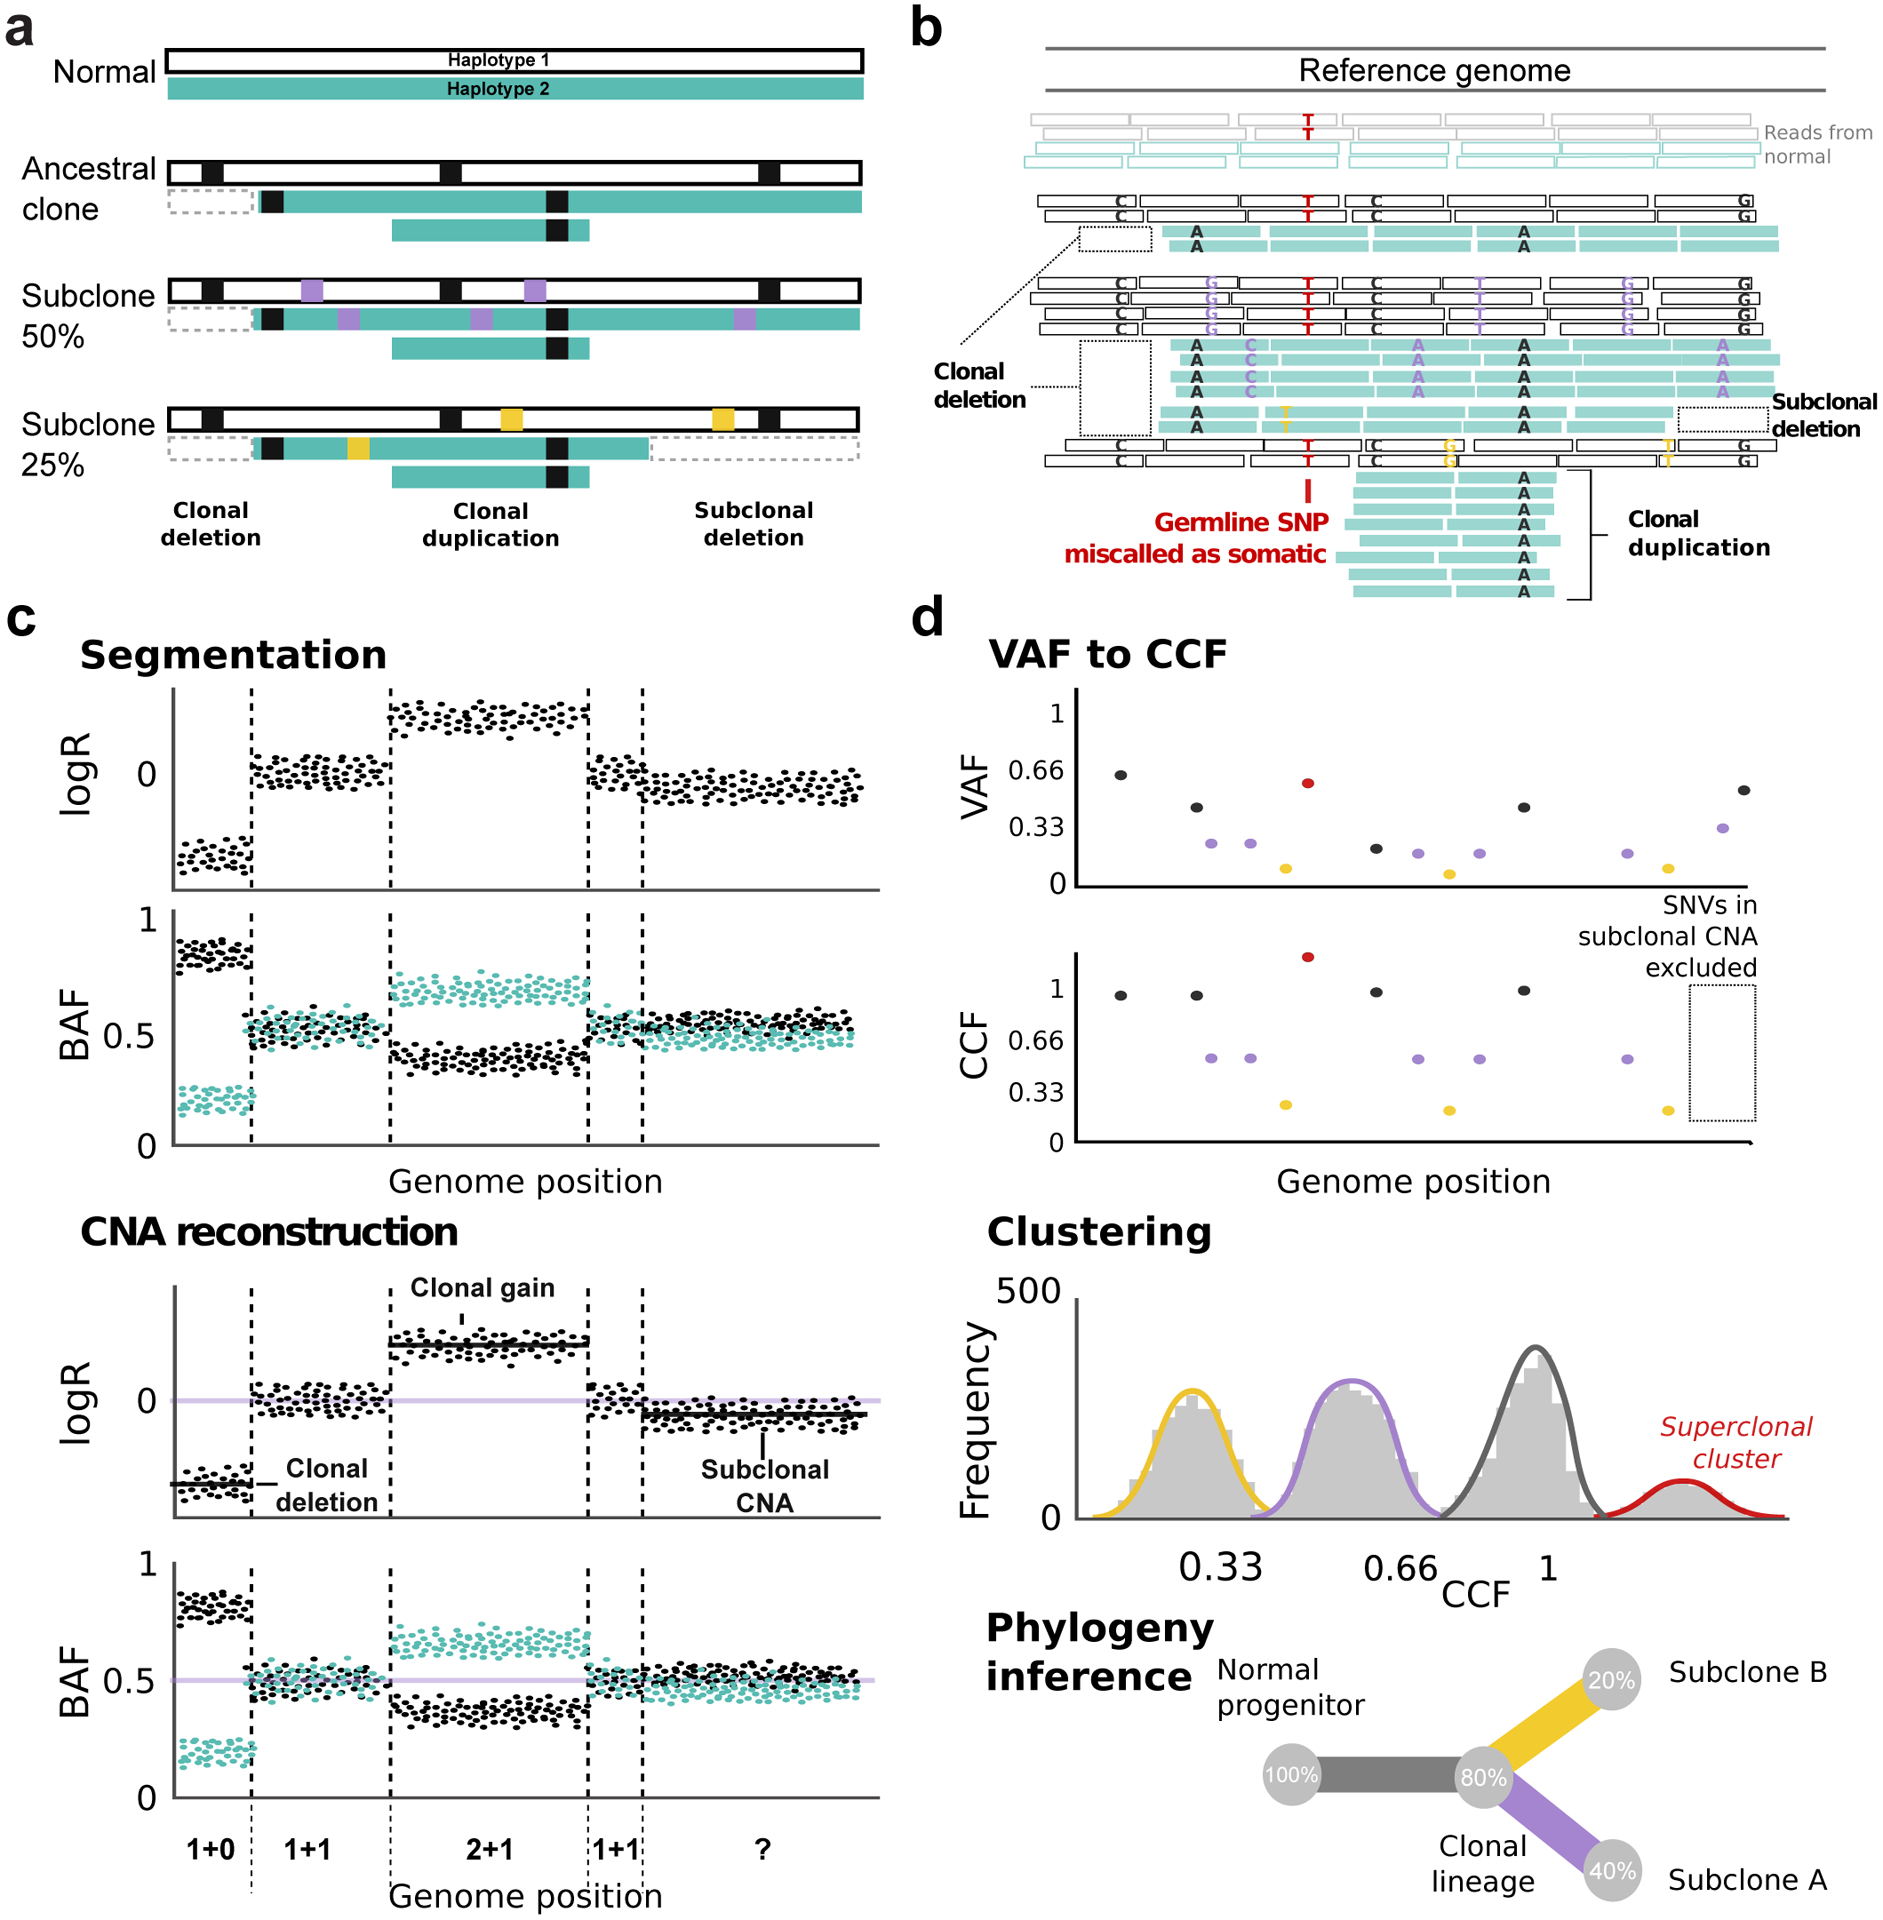
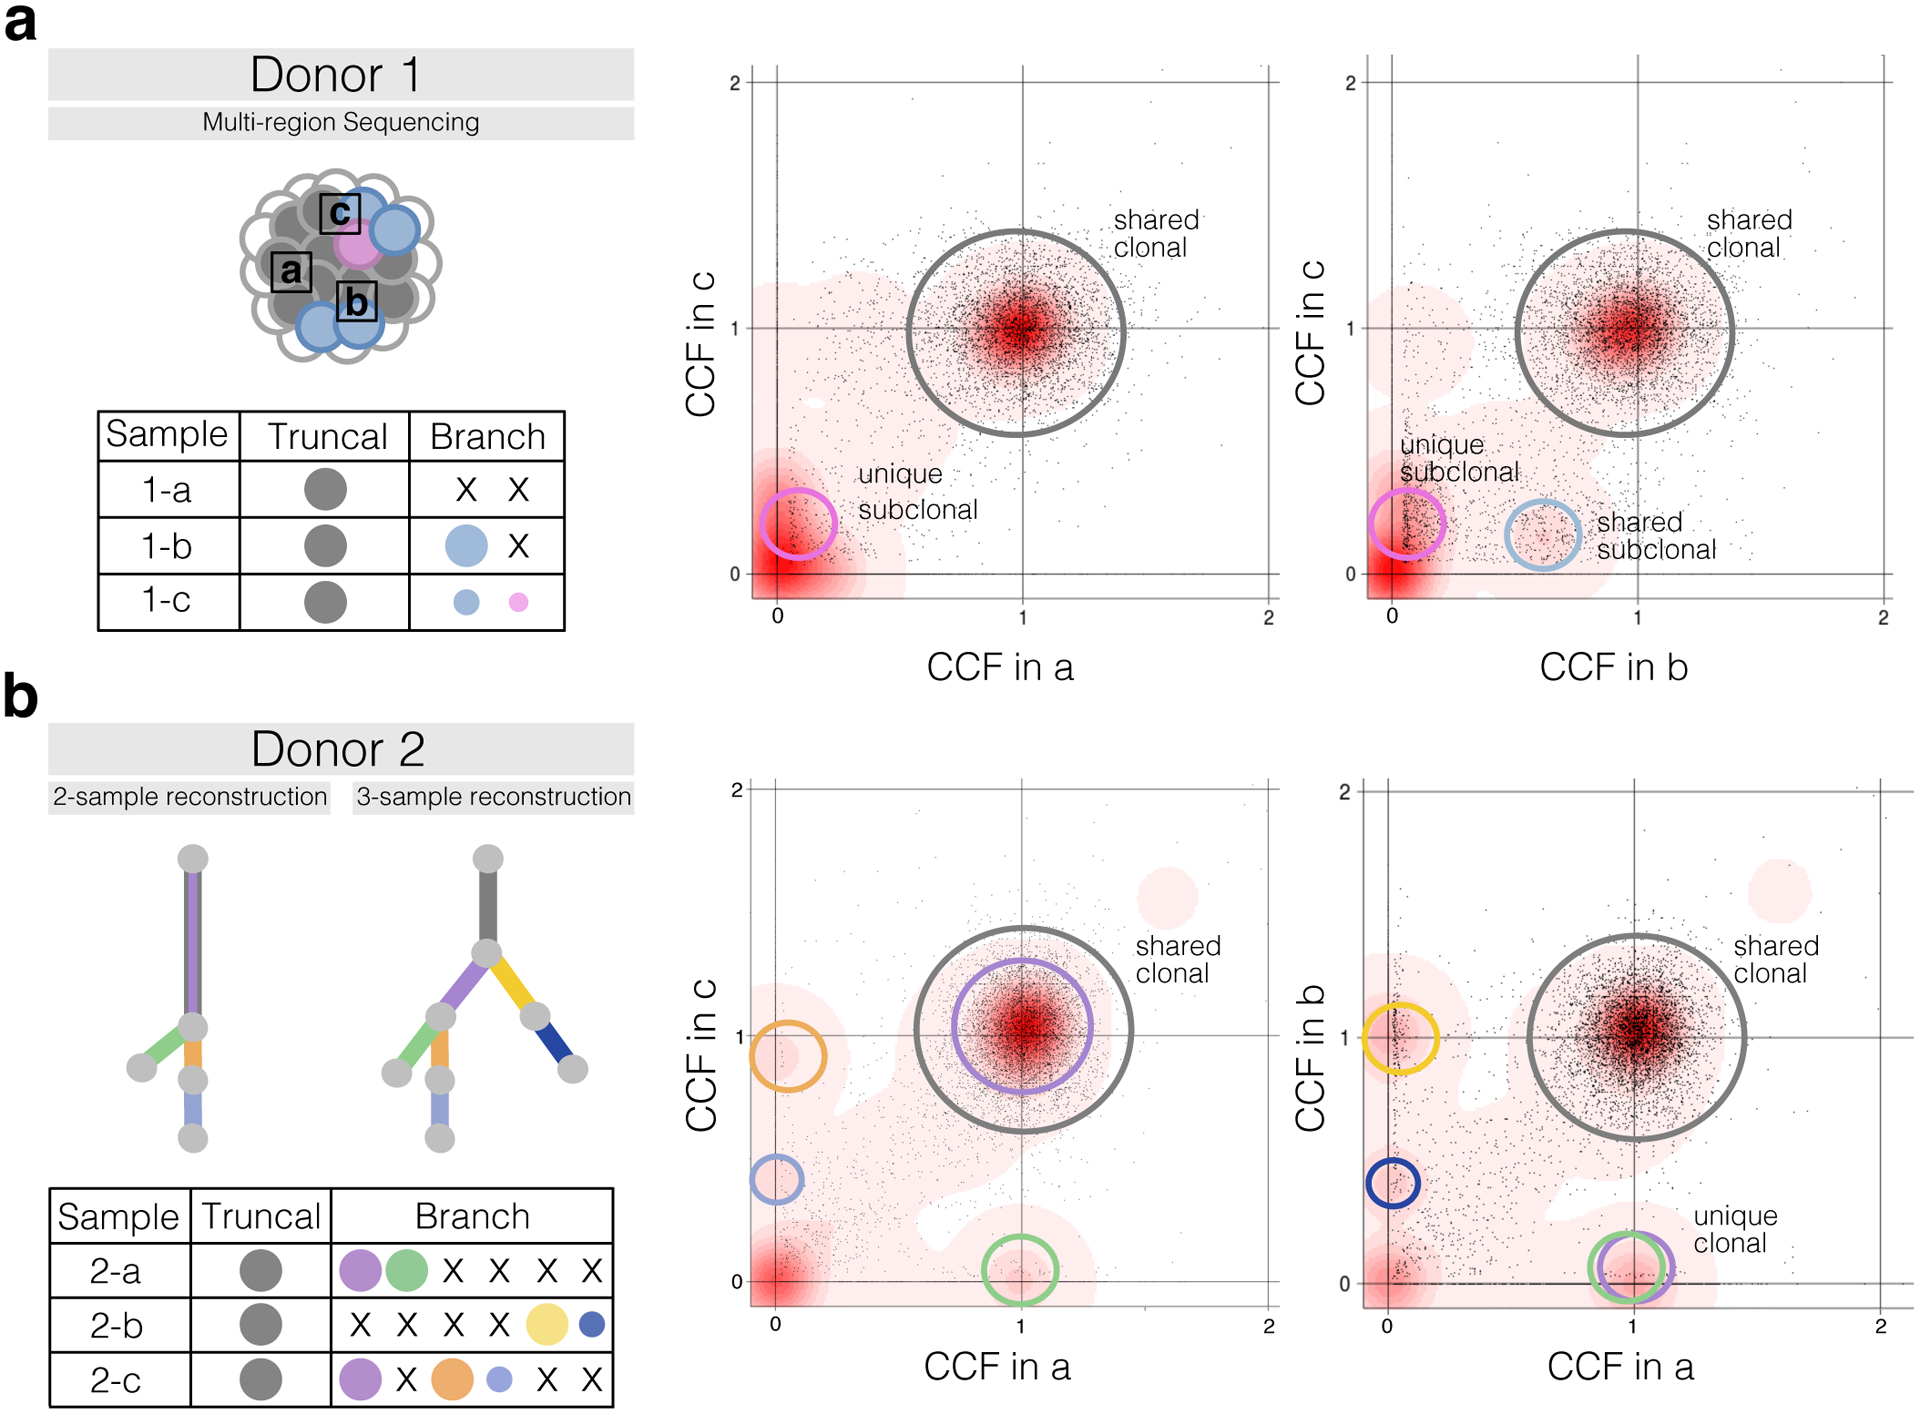
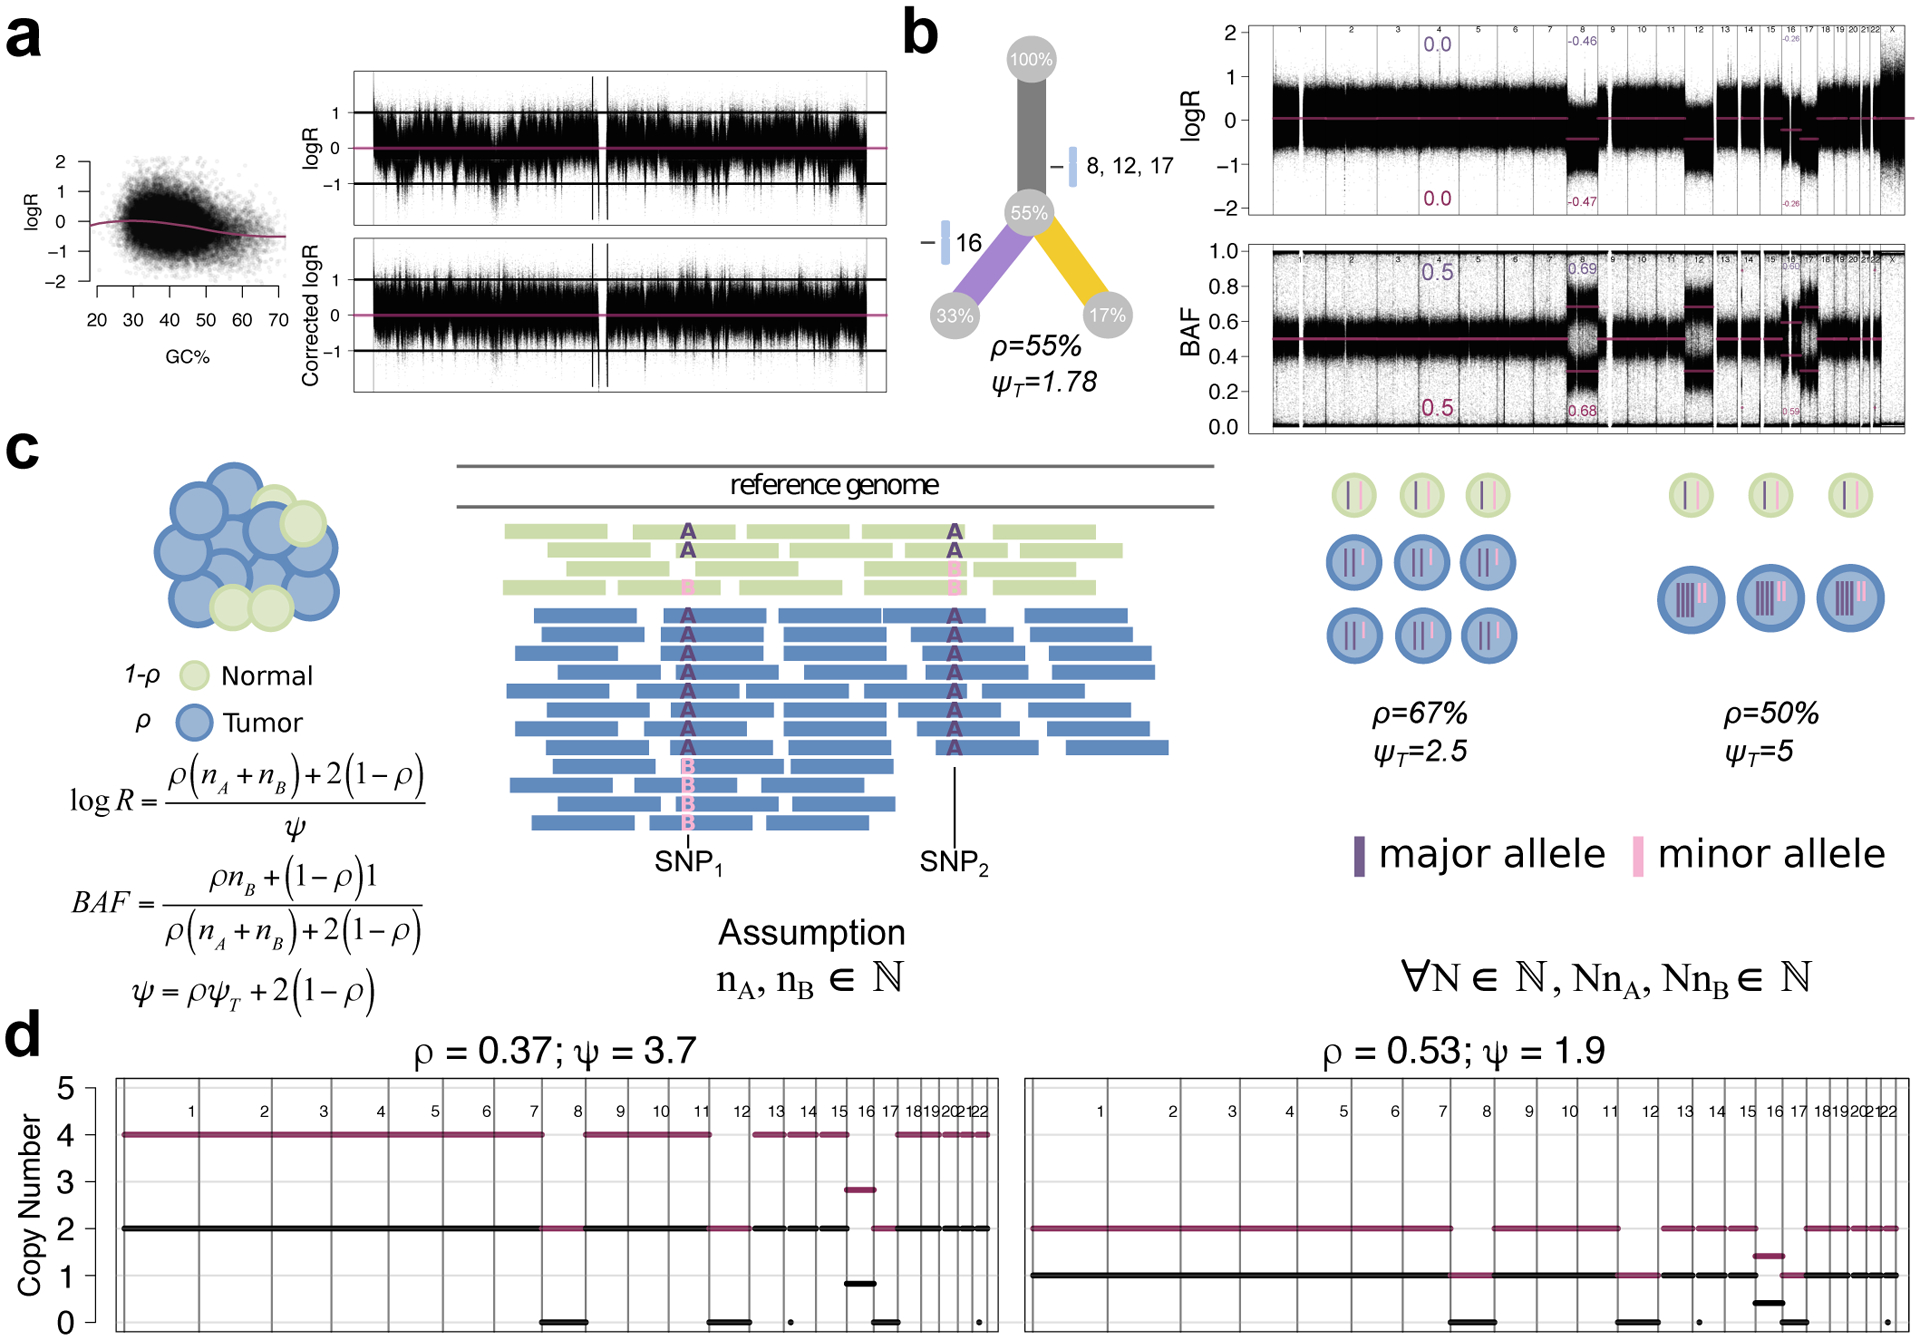
Subclonal reconstruction from bulk tumor DNA sequencing has become a pillar of cancer evolution studies, providing insight into the clonality and relative ordering of mutations and mutational processes. We provide an outline of the complex computational approaches used for subclonal reconstruction from single and multiple tumor samples. We identify the underlying assumptions and uncertainties in each step and suggest best practices for analysis and quality assessment. This guide provides a pragmatic resource for the growing user community of subclonal reconstruction methods.


Conflict of interest statement

Competing interests

P.C.B is a member of the Scientific Advisory Boards of BioSymetrics Inc. and Intersect Diagnostics Inc. M.T., A.S., A.G.D., M.N.L., J.W., D.C.W., Q.D.M., and P.V.L. declare no competing interests.

Figures

Figure 1 |
Figure 1 |. Standard Workflow and Input Data for Subclonal Reconstruction
(a) A simplified example of tumor clonal genotypes. We illustrate a tumor containing two subclones at 50% (purple) and 25% (yellow) CCF, both descended from a common ancestral clone (100% CCF, black). The remaining 25% of tumor cells are indistinguishable from the ancestor. (b) First, somatic mutations are called from aligned reads. Read depth must be much higher (coverage >60x) than illustrated for mutation calling and subclonal reconstruction. Similarly, an elevated local mutation burden is illustrated. A somatic variant caller identifies somatic SNVs by comparing to a matched normal, although germline SNP contamination may occur (see main text). (c) Second, CNA reconstruction is performed. It typically uses read depth and B-allele frequency (BAF) data for heterozygous SNPs. (d) Third, CNAs are used to translate the measured SNV VAF to a CCF/CP estimate. This procedure relies on an accurate SNV multiplicity estimates (see Lexicon) which are typically inaccurate in subclonal CNAs so we exclude these regions from the analysis. SNV CCFs are then clustered to identify (sub)clonal lineages in the sample. False positive SNVs or inaccurate CNAs can cause spurious superclonal clusters (i.e. with CCF>1. Finally, phylogenetic reconstruction infers the ancestral relationships among lineages.
Figure 2 |
Figure 2 |. Subclonal Reconstruction Using Multiple Samples
(a) Multiple samples can reveal additional subclones. Left: a tumor with three sequenced samples (a,b,c). The table, shows clones in each sample with color-coded circles proportional to their CCF in size. Truncal is defined as CCF = 1 in all samples and branch as CCF < 1 in at least one sample. Right: two sample density plots for the tumor. SNV CCFs from each sample are plotted along the axes. Circles indicate clone clusters, while the red background shows SNV density. SNVs clustered around (1,1) occur in all tumour cells in both samples; subclones on the axes are sample-specific, and clusters off the axes appear subclonal in both samples. For example, a subclonal cluster occurs in ~15% of cells in c but is absent in a. However, region (b) shows that this cluster was a mixture of two subclones: one unique to c and one shared by b and c. (b) Sequencing multiple samples clarifies clonal relationships. Left: phylogenetic trees for 2- and 3-sample subclonal reconstruction from multi-region sequencing (a, b, c). Subclones are represented by color-coded circles, as in (a). Right: density plots, as in (a). Looking only at samples a and c, mutations from the purple cluster appear clonal. However, it is absent in sample (b) and thus subclonal.
Figure 3 |
Figure 3 |. CNA reconstructions and Uncertainty from Whole Genome Duplications
(a) Effect of GC-content on logR. Left: the GC content (% in 500 kbp bins) around SNPs vs. logR for a PCAWG tumour with a loess fit (purple). Right: chromosome 22 logR before (top) and after GC and replication timing correction (bottom). (b) logR and BAF reflect relative allele-specific DNA content. Left: the subclonal structure for a tumour with clonal and subclonal chromosomal CNAs. Right: genome-wide logR and BAF with expected (violet) and measured (purple) values for CNAs. (c) Schematic illustration of ploidy ambiguity. The bulk sample contains tumor (blue) and non-tumor (green) cells. The number of reads from each allele from normal and the tumor cells depends on the number of allelic copies. We show a toy example with two heterozygous SNP positions (A and B alleles). logR and BAF can be expressed as a function of purity ρ, tumor ploidy ψT and the number of major and minor allele copies (nA and nB) in the tumor, which clonally should be integers. Combinations of purity and ploidy values that best align nA and nB to integers are often used to derive copy number profiles. However, multiple combinations can explain the observed data -- multiples of 2ΨT (i.e. a whole genome duplication; WGD) apart. In this example, ΨT = 2.5 and ΨT = 2 × 2.5 = 5 both explain the data. (d) Copy number profiles inferred by Battenberg. Left: along the genome (x-axis) copy number of the major (violet) and minor (grey) allele (default fit, which favored a WGD solution because it fit the subclonal event on chromosome 16 near integers). Right: same as left, after manual refitting.

References

    1. Hanahan D & Weinberg RA Hallmarks of Cancer : The Next Generation. Cell 144, 646–674 (2011). - PubMed
    1. Nowell PC The clonal evolution of tumor cell populations. Science 194, 23–28 (1976). - PubMed
    1. Gundem G et al. The Evolutionary History of Lethal Metastatic Prostate Cancer. Nature 520, 353–357 (2015). - PMC - PubMed
    1. Hong MKH et al. Tracking the origins and drivers of subclonal metastatic expansion in prostate cancer. Nature Communications 6, 1–12 (2015). - PMC - PubMed
    1. Mitchell TJ et al. Timing the landmark events in the evolution of clear cell renal cell cancer: TRACERx renal. Cell 173, 611–623 (2018). - PMC - PubMed

Publication types