Meta-Analysis
. 2021 Jan;53(1):65-75.
doi: 10.1038/s41588-020-00748-0. Epub 2021 Jan 4.

Trans-ancestry genome-wide association meta-analysis of prostate cancer identifies new susceptibility loci and informs genetic risk prediction

David V Conti #  1 Burcu F Darst #  1 Lilit C Moss  1 Edward J Saunders  2 Xin Sheng  1 Alisha Chou  1 Fredrick R Schumacher  3   4 Ali Amin Al Olama  5   6 Sara Benlloch  5 Tokhir Dadaev  2 Mark N Brook  2 Ali Sahimi  1 Thomas J Hoffmann  7   8 Atushi Takahashi  9   10 Koichi Matsuda  11   12 Yukihide Momozawa  13 Masashi Fujita  14 Kenneth Muir  15   16 Artitaya Lophatananon  15 Peggy Wan  1 Loic Le Marchand  17 Lynne R Wilkens  17 Victoria L Stevens  18 Susan M Gapstur  18 Brian D Carter  18 Johanna Schleutker  19   20 Teuvo L J Tammela  21 Csilla Sipeky  19 Anssi Auvinen  22 Graham G Giles  23   24   25 Melissa C Southey  25 Robert J MacInnis  23   24 Cezary Cybulski  26 Dominika Wokołorczyk  26 Jan Lubiński  26 David E Neal  27   28   29 Jenny L Donovan  30 Freddie C Hamdy  31   32 Richard M Martin  30   33   34 Børge G Nordestgaard  35   36 Sune F Nielsen  35   36 Maren Weischer  36 Stig E Bojesen  35   36 Martin Andreas Røder  37 Peter Iversen  37 Jyotsna Batra  38   39 Suzanne Chambers  40 Leire Moya  38   39 Lisa Horvath  41   42 Judith A Clements  38   39 Wayne Tilley  43 Gail P Risbridger  44   45 Henrik Gronberg  46 Markus Aly  46   47   48 Robert Szulkin  46   49 Martin Eklund  46 Tobias Nordström  46   50 Nora Pashayan  51   52   51 Alison M Dunning  52 Maya Ghoussaini  53 Ruth C Travis  54 Tim J Key  54 Elio Riboli  55 Jong Y Park  56 Thomas A Sellers  56 Hui-Yi Lin  57 Demetrius Albanes  58 Stephanie J Weinstein  58 Lorelei A Mucci  59 Edward Giovannucci  59 Sara Lindstrom  60 Peter Kraft  61 David J Hunter  62 Kathryn L Penney  63 Constance Turman  61 Catherine M Tangen  64 Phyllis J Goodman  64 Ian M Thompson Jr  65 Robert J Hamilton  66   67 Neil E Fleshner  66 Antonio Finelli  68 Marie-Élise Parent  69   70 Janet L Stanford  71   72 Elaine A Ostrander  73 Milan S Geybels  71 Stella Koutros  58 Laura E Beane Freeman  58 Meir Stampfer  63 Alicja Wolk  74   75 Niclas Håkansson  74 Gerald L Andriole  76 Robert N Hoover  58 Mitchell J Machiela  58 Karina Dalsgaard Sørensen  77   78 Michael Borre  78   79 William J Blot  80   81 Wei Zheng  80 Edward D Yeboah  82   83 James E Mensah  82   83 Yong-Jie Lu  84 Hong-Wei Zhang  85 Ninghan Feng  86 Xueying Mao  84 Yudong Wu  87 Shan-Chao Zhao  88 Zan Sun  89 Stephen N Thibodeau  90 Shannon K McDonnell  91 Daniel J Schaid  91 Catharine M L West  92 Neil Burnet  93 Gill Barnett  94 Christiane Maier  95 Thomas Schnoeller  96 Manuel Luedeke  97 Adam S Kibel  98 Bettina F Drake  76 Olivier Cussenot  99 Géraldine Cancel-Tassin  99   100 Florence Menegaux  101 Thérèse Truong  101 Yves Akoli Koudou  102 Esther M John  103 Eli Marie Grindedal  104 Lovise Maehle  104 Kay-Tee Khaw  105 Sue A Ingles  106 Mariana C Stern  106 Ana Vega  107   108   109 Antonio Gómez-Caamaño  110 Laura Fachal  5   107   108   109 Barry S Rosenstein  111   112 Sarah L Kerns  113 Harry Ostrer  114 Manuel R Teixeira  115   116 Paula Paulo  115   117 Andreia Brandão  115   117 Stephen Watya  118 Alexander Lubwama  118 Jeannette T Bensen  119   120 Elizabeth T H Fontham  58 James Mohler  120   121 Jack A Taylor  122   123 Manolis Kogevinas  124   125   126   127 Javier Llorca  127   128 Gemma Castaño-Vinyals  124   125   126   127 Lisa Cannon-Albright  129   130 Craig C Teerlink  129   130 Chad D Huff  131 Sara S Strom  131 Luc Multigner  132 Pascal Blanchet  133 Laurent Brureau  133 Radka Kaneva  134 Chavdar Slavov  135 Vanio Mitev  134 Robin J Leach  136 Brandi Weaver  136 Hermann Brenner  137   138   139 Katarina Cuk  137 Bernd Holleczek  140 Kai-Uwe Saum  137 Eric A Klein  141   142 Ann W Hsing  143 Rick A Kittles  144 Adam B Murphy  145 Christopher J Logothetis  146 Jeri Kim  146 Susan L Neuhausen  147 Linda Steele  147 Yuan Chun Ding  147 William B Isaacs  148 Barbara Nemesure  149 Anselm J M Hennis  149   150 John Carpten  151 Hardev Pandha  152 Agnieszka Michael  152 Kim De Ruyck  153 Gert De Meerleer  154 Piet Ost  154 Jianfeng Xu  155 Azad Razack  156 Jasmine Lim  156 Soo-Hwang Teo  157 Lisa F Newcomb  72   158 Daniel W Lin  72   158 Jay H Fowke  159 Christine Neslund-Dudas  160 Benjamin A Rybicki  160 Marija Gamulin  161 Davor Lessel  162 Tomislav Kulis  163 Nawaid Usmani  164   165 Sandeep Singhal  164 Matthew Parliament  164   165 Frank Claessens  166 Steven Joniau  167 Thomas Van den Broeck  166   167 Manuela Gago-Dominguez  168   169 Jose Esteban Castelao  170 Maria Elena Martinez  171 Samantha Larkin  172 Paul A Townsend  152   173 Claire Aukim-Hastie  152 William S Bush  174 Melinda C Aldrich  175 Dana C Crawford  174 Shiv Srivastava  176 Jennifer C Cullen  176 Gyorgy Petrovics  176 Graham Casey  177 Monique J Roobol  178 Guido Jenster  178 Ron H N van Schaik  179 Jennifer J Hu  180 Maureen Sanderson  181 Rohit Varma  182 Roberta McKean-Cowdin  1 Mina Torres  182 Nicholas Mancuso  1 Sonja I Berndt  58 Stephen K Van Den Eeden  183   184 Douglas F Easton  5 Stephen J Chanock  58 Michael B Cook  58 Fredrik Wiklund  46 Hidewaki Nakagawa  14 John S Witte  7   8   184 Rosalind A Eeles  2   185 Zsofia Kote-Jarai  2 Christopher A Haiman  186
Affiliations
Meta-Analysis

Trans-ancestry genome-wide association meta-analysis of prostate cancer identifies new susceptibility loci and informs genetic risk prediction

David V Conti et al. Nat Genet. 2021 Jan.

Erratum in

  • Publisher Correction: Trans-ancestry genome-wide association meta-analysis of prostate cancer identifies new susceptibility loci and informs genetic risk prediction.
    Conti DV, Darst BF, Moss LC, Saunders EJ, Sheng X, Chou A, Schumacher FR, Olama AAA, Benlloch S, Dadaev T, Brook MN, Sahimi A, Hoffmann TJ, Takahashi A, Matsuda K, Momozawa Y, Fujita M, Muir K, Lophatananon A, Wan P, Le Marchand L, Wilkens LR, Stevens VL, Gapstur SM, Carter BD, Schleutker J, Tammela TLJ, Sipeky C, Auvinen A, Giles GG, Southey MC, MacInnis RJ, Cybulski C, Wokołorczyk D, Lubiński J, Neal DE, Donovan JL, Hamdy FC, Martin RM, Nordestgaard BG, Nielsen SF, Weischer M, Bojesen SE, Røder MA, Iversen P, Batra J, Chambers S, Moya L, Horvath L, Clements JA, Tilley W, Risbridger GP, Gronberg H, Aly M, Szulkin R, Eklund M, Nordström T, Pashayan N, Dunning AM, Ghoussaini M, Travis RC, Key TJ, Riboli E, Park JY, Sellers TA, Lin HY, Albanes D, Weinstein SJ, Mucci LA, Giovannucci E, Lindstrom S, Kraft P, Hunter DJ, Penney KL, Turman C, Tangen CM, Goodman PJ, Thompson IM Jr, Hamilton RJ, Fleshner NE, Finelli A, Parent MÉ, Stanford JL, Ostrander EA, Geybels MS, Koutros S, Freeman LEB, Stampfer M, Wolk A, Håkansson N, Andriole GL, Hoover RN, Machiela MJ, Sørensen KD, Borre M, Blot WJ, Zheng W, Yeboah ED, Mensah JE, Lu YJ, Zhang HW, Feng N, Mao X, Wu Y, Zhao SC, Sun Z, Thibodeau SN, M… See abstract for full author list ➔ Conti DV, et al. Nat Genet. 2021 Mar;53(3):413. doi: 10.1038/s41588-021-00786-2. Nat Genet. 2021. PMID: 33473200 No abstract available.

Abstract

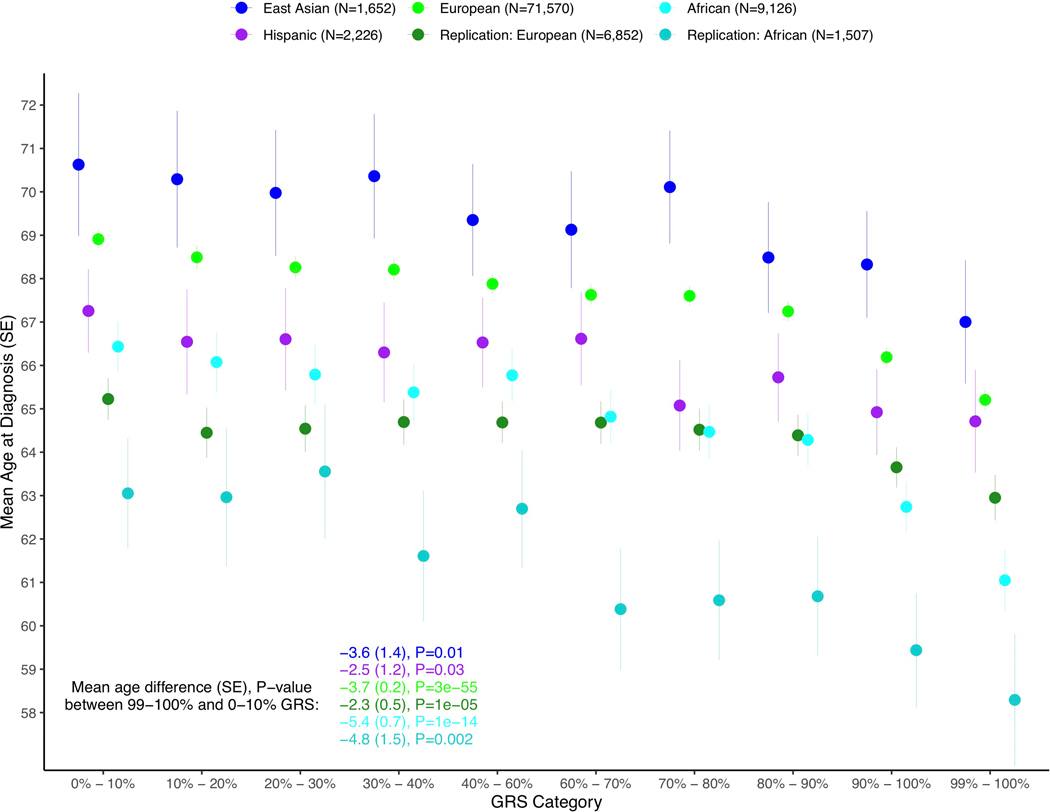
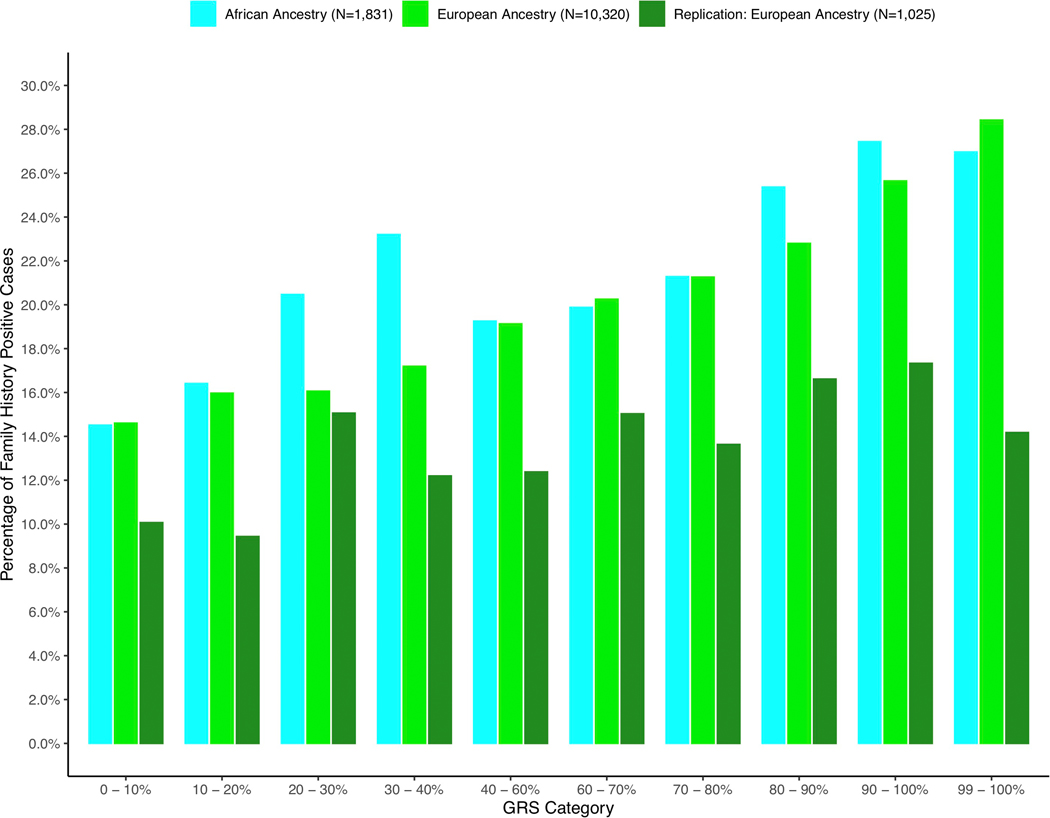
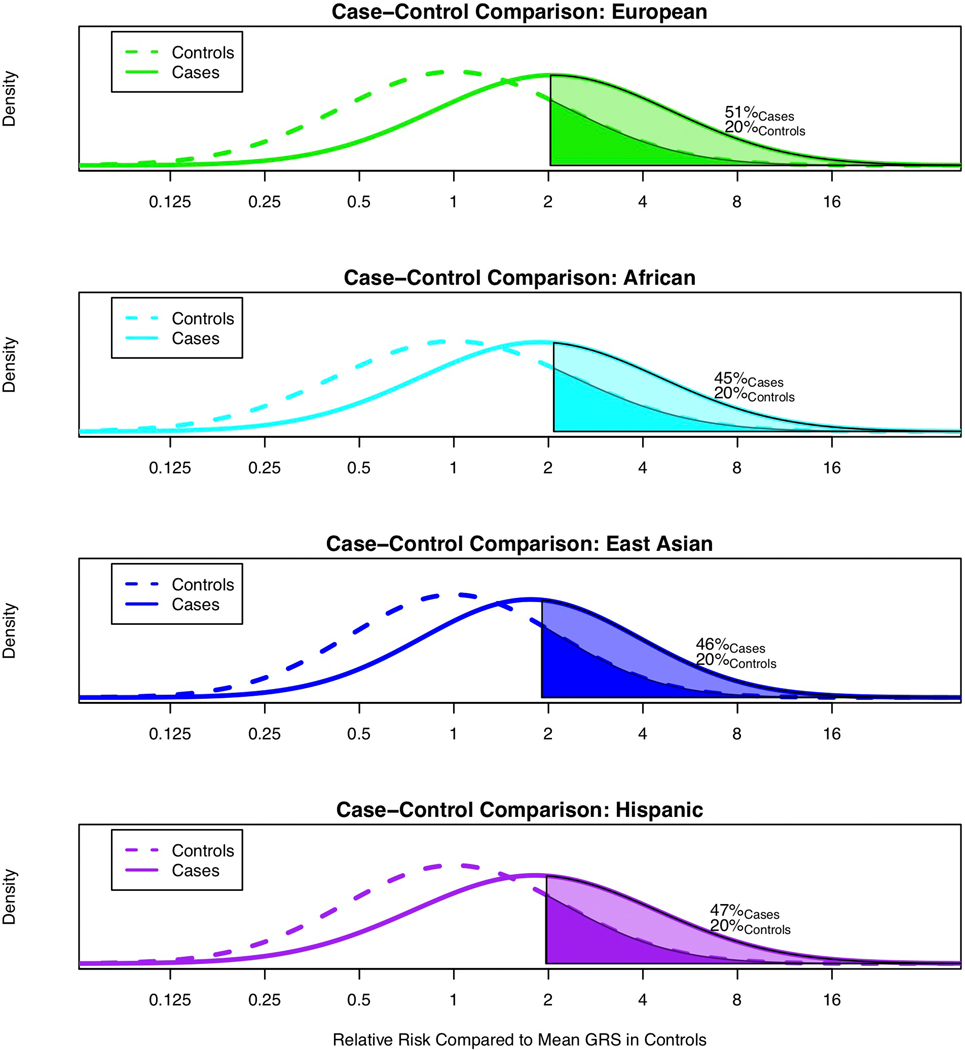
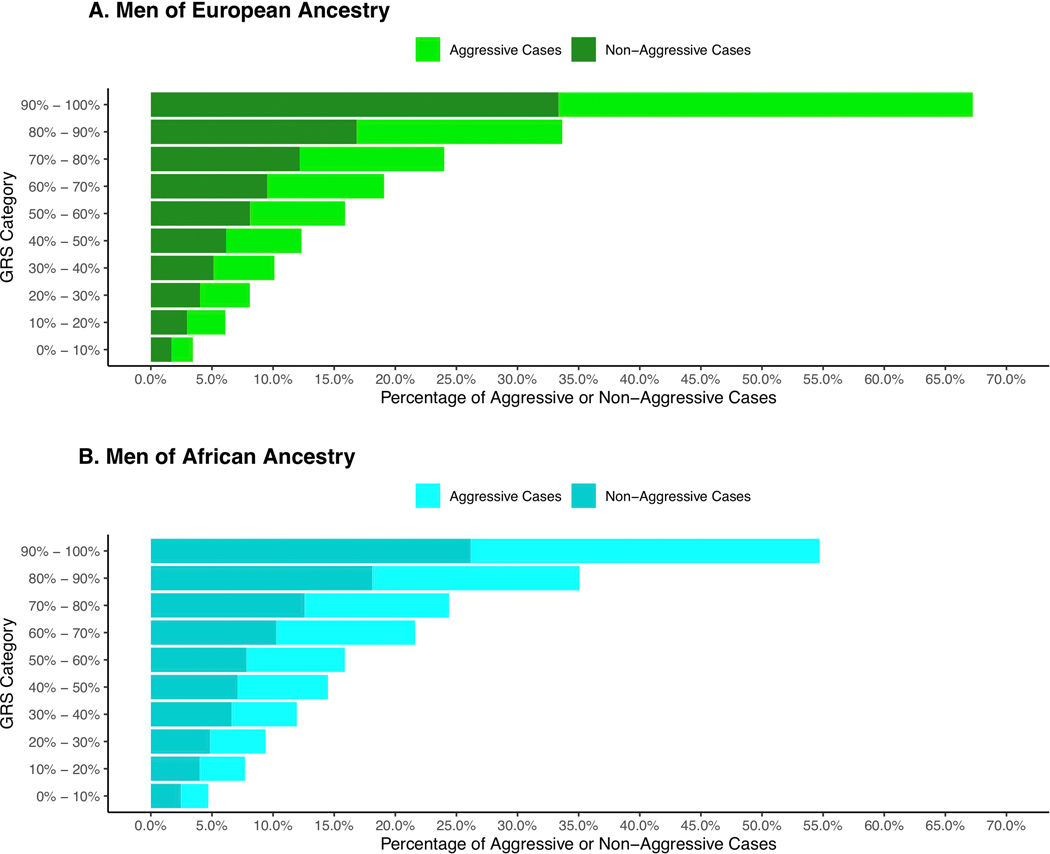
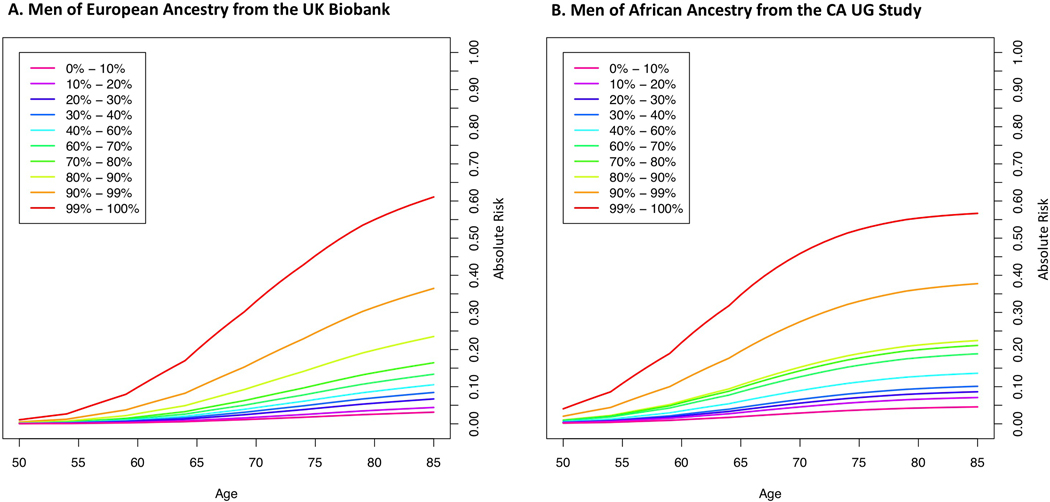
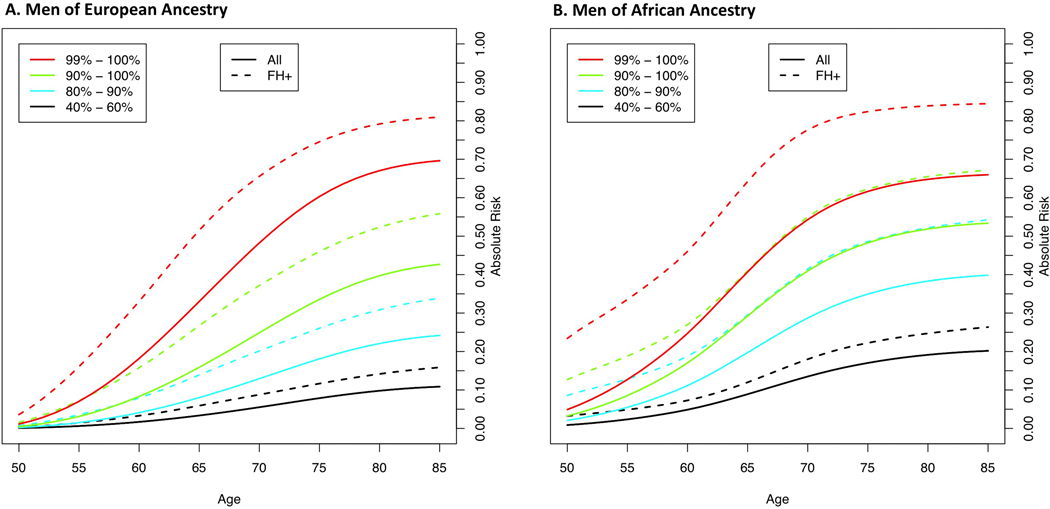
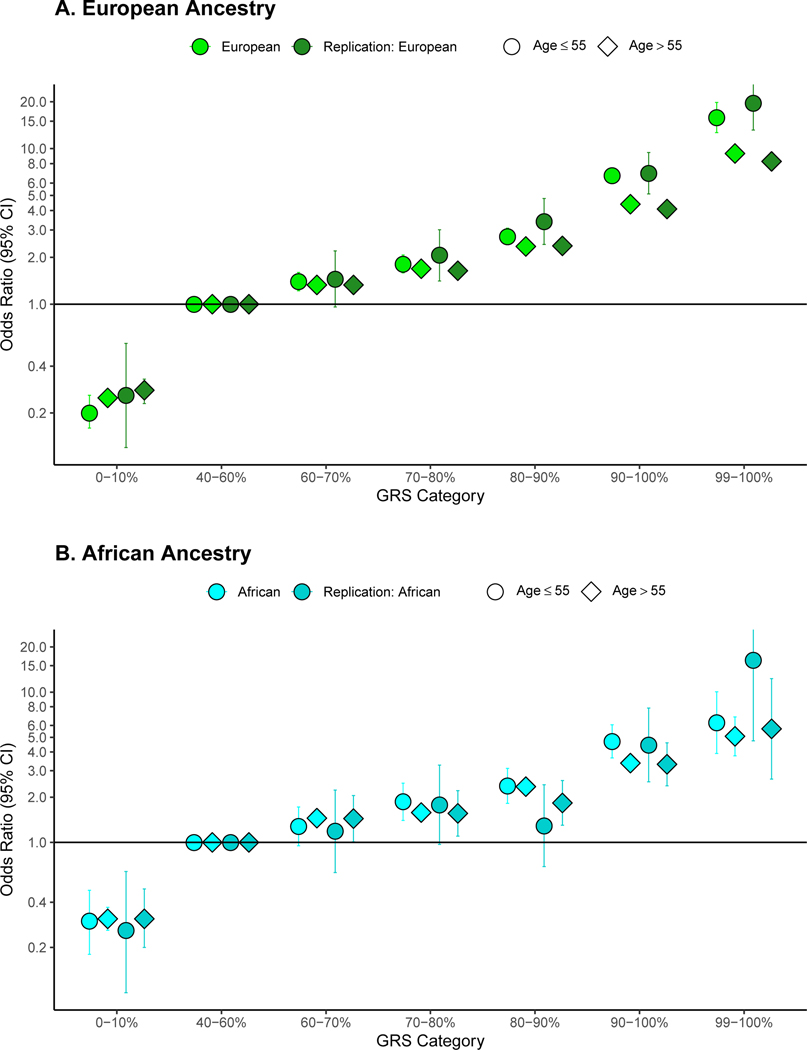
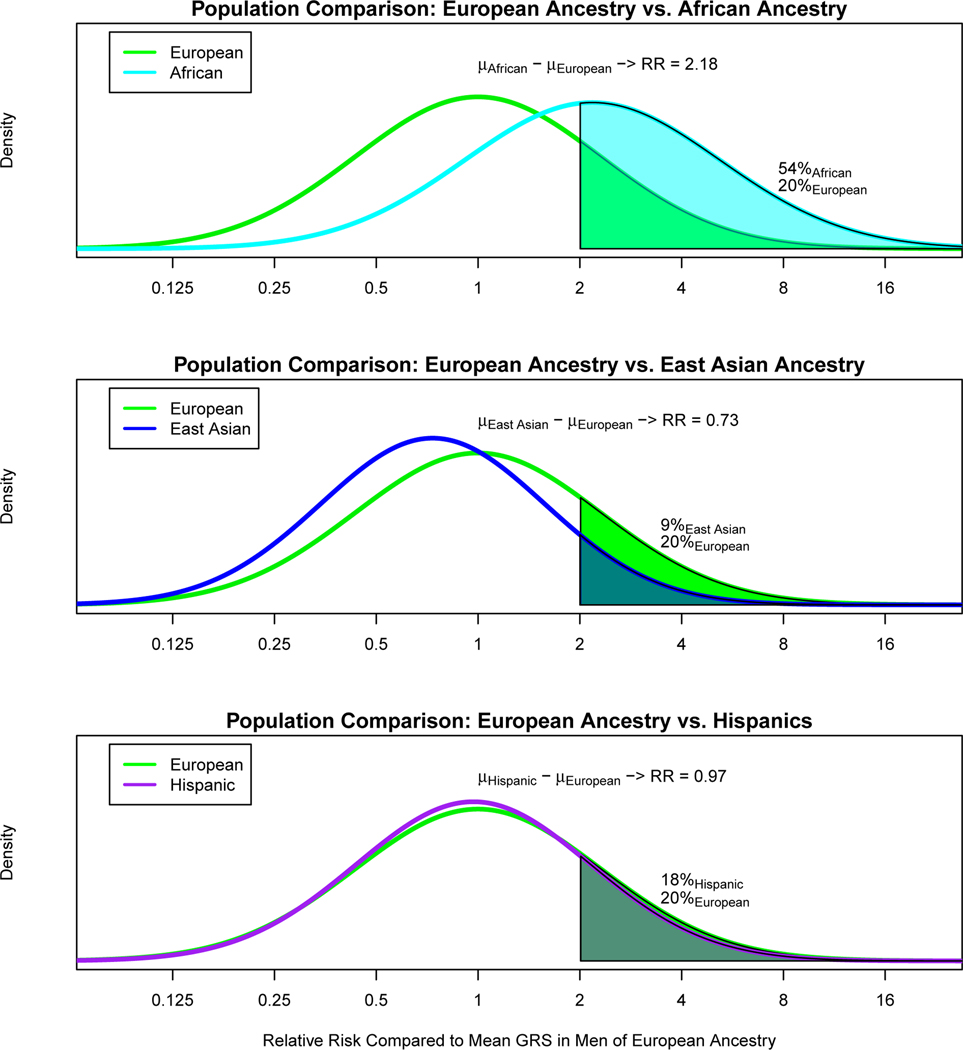
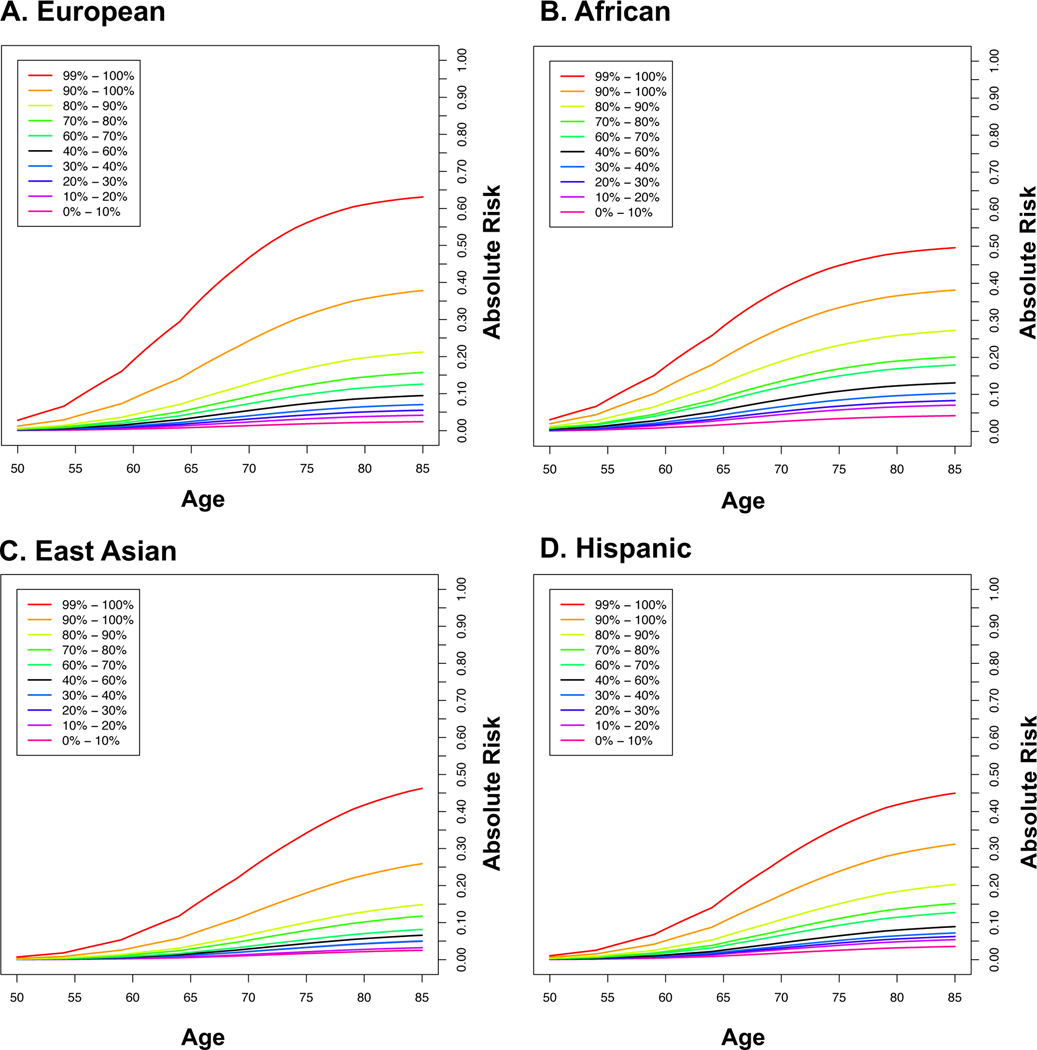
Prostate cancer is a highly heritable disease with large disparities in incidence rates across ancestry populations. We conducted a multiancestry meta-analysis of prostate cancer genome-wide association studies (107,247 cases and 127,006 controls) and identified 86 new genetic risk variants independently associated with prostate cancer risk, bringing the total to 269 known risk variants. The top genetic risk score (GRS) decile was associated with odds ratios that ranged from 5.06 (95% confidence interval (CI), 4.84-5.29) for men of European ancestry to 3.74 (95% CI, 3.36-4.17) for men of African ancestry. Men of African ancestry were estimated to have a mean GRS that was 2.18-times higher (95% CI, 2.14-2.22), and men of East Asian ancestry 0.73-times lower (95% CI, 0.71-0.76), than men of European ancestry. These findings support the role of germline variation contributing to population differences in prostate cancer risk, with the GRS offering an approach for personalized risk prediction.


Figures

Extended Data Fig. 1
Extended Data Fig. 1. Effect comparisons of the 269 prostate cancer risk variants between younger (age≤55) and older (age>55) men of European and African ancestry
Variants above the identity line have larger effects in younger men, and variants below the identity line have larger effects in older men. Blue dots indicate effect differences with an unadjusted P-value < 0.05. 188/269 (69.9%) of tested variants have larger effects in younger vs. older men and 31/269 (11.5%) of tested variants have larger effects in younger vs. older men at a P-value < 0.05 threshold. All statistical tests were two-sided. Results presented figure are also provided in Supplementary Table 8. SE: standard error.
Extended Data Fig. 2
Extended Data Fig. 2. Effect correlations of the 269 prostate cancer risk variants between populations
Figure is annotated to show risk allele frequency (RAF) differences between Europeans and non-Europeans for each variant. Effects and RAF are compared between European (EUR) ancestry men and A) African (AFR) ancestry men, B) East Asian (EAS) ancestry men, and C) Hispanic (HIS) men. SE: standard error.
Extended Data Fig. 3
Extended Data Fig. 3. Discriminative ability and highest GRS decile odds ratio of the multiancestry genome-wide GRS upon iteratively adding each variant to the GRS model
Discriminative ability is shown in men of A) European ancestry from the UK Biobank and B) African ancestry from the California Uganda (CA UG) study. Variants are sorted first within the 269-genetic risk score (GRS) variants then for other genome-wide variants by the multiancestry genome-wide association study (GWAS) meta-analysis P-values (with four P-value thresholds indicated by dotted vertical lines), and GRS weights are based on multiancestry GWAS meta-analysis results. Black lines represent the area under the curve (AUC) and correspond to the left y-axis, while blue lines represent the 90–100% GRS odds ratio (OR; relative to 40–60% GRS) and correspond to the right y-axis. All statistical tests were two-sided. PCs: principal components.
Extended Data Fig. 4
Extended Data Fig. 4. Discriminative ability and highest GRS decile odds ratio of the African ancestry genome-wide GRS upon iteratively adding each variant to the GRS model
Discriminative ability is shown in men of A) European ancestry from the UK Biobank and B) African ancestry from the California Uganda (CA UG) study. Variants are sorted first within the 269-genetic risk score (GRS) variants then for other genome-wide variants by the African ancestry genome-wide association study (GWAS) meta-analysis P-values (with four P-value thresholds indicated by dotted vertical lines), and GRS weights are based on African ancestry GWAS meta-analysis results. Black lines represent the area under the curve (AUC) and correspond to the left y-axis, while blue lines represent the 90–100% GRS odds ratio (OR; relative to 40–60% GRS) and correspond to the right y-axis. All statistical tests were two-sided. PCs: principal components.
Extended Data Fig. 5
Extended Data Fig. 5. Distribution of age at prostate cancer diagnosis by GRS category and population
Differences between populations reflect sampling differences rather than population differences in age at diagnosis. SE: standard deviation, GRS: genetic risk score.
Extended Data Fig. 6
Extended Data Fig. 6. Distribution of cases with a family history of prostate cancer by GRS decile and population
The percentage of family history positive cases in each genetic risk score (GRS) category are shown in men of European and African ancestry. The x-axis indicates the GRS category and the y-axis is the percentage of family history positive prostate cancer cases.
Extended Data Fig. 7
Extended Data Fig. 7. Comparison of the GRS distributions between cases and controls
A) Men of European ancestry and B) Men of African Ancestry; C) Men of Asian ancestry; and D) Hispanic men. The x-axis indicates the relative risk calculated by exponentiation of the difference in the mean genetic risk score (GRS) in controls and the mean GRS in cases for each population. The y-axis indicates the GRS density. Solid areas and corresponding percentages are the proportion of cases and controls with a GRS above 20% in the controls.
Extended Data Fig. 8
Extended Data Fig. 8. Distribution of aggressive and non-aggressive prostate cancer cases by GRS category
A) Men of European ancestry and B) Men of African ancestry. The x-axis indicates the percentage of aggressive or non-aggressive prostate cancer cases and the y-axis indicates the genetic risk score (GRS) category.
Extended Data Fig. 9
Extended Data Fig. 9. Absolute risks of prostate cancer by GRS category
A) Men of European ancestry from the UK Biobank and B) Men of African ancestry from the California Uganda (CA UG) study. The x-axis indicates the age of an individual and the y-axis indicates the absolute risk by a given age. Colored lines correspond to the indicated genetic risk score (GRS) category.
Extended Data Fig. 10
Extended Data Fig. 10. Absolute risks of prostate cancer by GRS category including individuals with a positive first-degree family history for prostate cancer (FH+)
A) Men of European ancestry and B) Men of African ancestry. The x-axis indicates the age of an individual and the y-axis indicates the absolute risk by a given age. Colored lines correspond to the indicated genetic risk score (GRS) category. FH+: family history positive.
Figure 1:
Figure 1:
Odds ratio for prostate cancer by genetic risk score (GRS) category stratified by age. Results are shown for A. Men of European ancestry (N=124,101 from the genome-wide association study [GWAS] and 199,969 from independent replication) and B. Men of African ancestry (N=17,828 from the GWAS and 2,633 from independent replication). The x-axis indicates the GRS category [0–10% (low-risk), 40–60% (average risk), 60–70%, 80–90%, 90–100% (high-risk) and 99–100% (high-risk)]. The y-axis indicates odds ratios with error bars representing 95% confidence intervals (Cis) for each GRS category compared to the 40–60% GRS as the reference. The horizontal line corresponds to an odds ratio of one. Odds ratios and 95% CIs for each decile and strata are provided in Supplementary Table 20.
Figure 2.
Figure 2.
Comparison of prostate cancer GRS distributions for controls. A. Men of European ancestry versus men of African ancestry; B. Men of European ancestry versus men of East Asian ancestry; and C. Men of European ancestry versus Hispanic men. The x-axis indicates the relative risk calculated by exponentiation of the difference in the mean GRS in controls for men of European ancestry and the mean GRS in controls for each of the other populations. The y-axis indicates the GRS density. Solid areas and corresponding percentages indicate the proportion of a given population with a relative risk greater than or equal to 2.0 in comparison to the mean GRS for men of European ancestry.
Figure 3.
Figure 3.
Absolute risks of prostate cancer by GRS category. A. European ancestry; B. African ancestry; C. East Asian ancestry; and D. Hispanic. SEER data is used for mortality and incidence rates corresponding to non-Hispanic White, Black, Asian and Hispanic men. The x-axis indicates the age of an individual and the y-axis is the absolute risk by a given age.

References

    1. Groups., U.S.C.S.W. U.S. Cancer Statistics Data Visualizations Tool, based November 2018 submission data (1999–2016). U.S. Department of Health and Human Services, Centers for Disease Control and Preventions and National Cancer Institute; www.cdc.gov/cancer/dataviz, (June 2019).
    1. Mucci LA et al. Familial Risk and Heritability of Cancer Among Twins in Nordic Countries. JAMA 315, 68–76 (2016). - PMC - PubMed
    1. Freedman ML et al. Admixture mapping identifies 8q24 as a prostate cancer risk locus in African-American men. Proc Natl Acad Sci U S A 103, 14068–73 (2006). - PMC - PubMed
    1. Al Olama AA et al. A meta-analysis of 87,040 individuals identifies 23 new susceptibility loci for prostate cancer. Nat Genet 46, 1103–9 (2014). - PMC - PubMed
    1. Amundadottir LT et al. A common variant associated with prostate cancer in European and African populations. Nat Genet 38, 652–8 (2006). - PubMed

Methods-only References

    1. Li Y, Willer CJ, Ding J, Scheet P. & Abecasis GR MaCH: using sequence and genotype data to estimate haplotypes and unobserved genotypes. Genet Epidemiol 34, 816–34 (2010). - PMC - PubMed
    1. Das S. et al. Next-generation genotype imputation service and methods. Nat Genet 48, 1284–1287 (2016). - PMC - PubMed
    1. Howie BN, Donnelly P. & Marchini J. A flexible and accurate genotype imputation method for the next generation of genome-wide association studies. PLoS Genet 5, e1000529 (2009). - PMC - PubMed
    1. Bycroft C. et al. The UK Biobank resource with deep phenotyping and genomic data. Nature 562, 203–209 (2018). - PMC - PubMed
    1. Purcell S. et al. PLINK: a tool set for whole-genome association and population-based linkage analyses. Am J Hum Genet 81, 559–75 (2007). - PMC - PubMed

Publication types