

Short-term forecast in the early stage of the COVID-19 outbreak in Italy. Application of a weighted and cumulative average daily growth rate to an exponential decay model
- PMID: 33398249
- PMCID: PMC7773318
- DOI: 10.1016/j.idm.2020.12.007
Short-term forecast in the early stage of the COVID-19 outbreak in Italy. Application of a weighted and cumulative average daily growth rate to an exponential decay model
Abstract
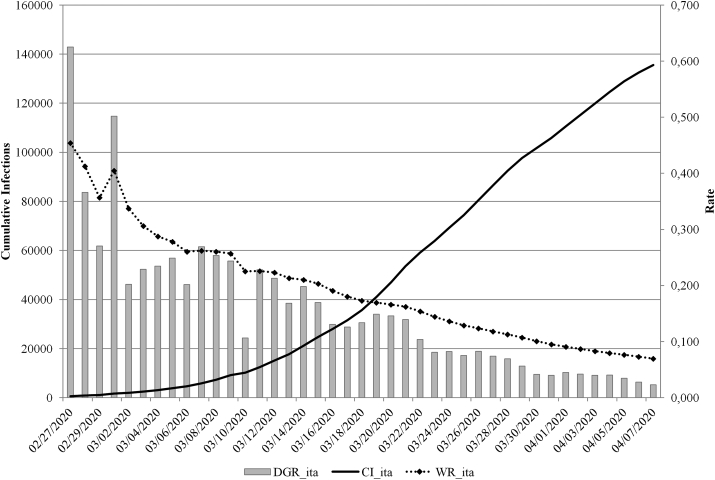
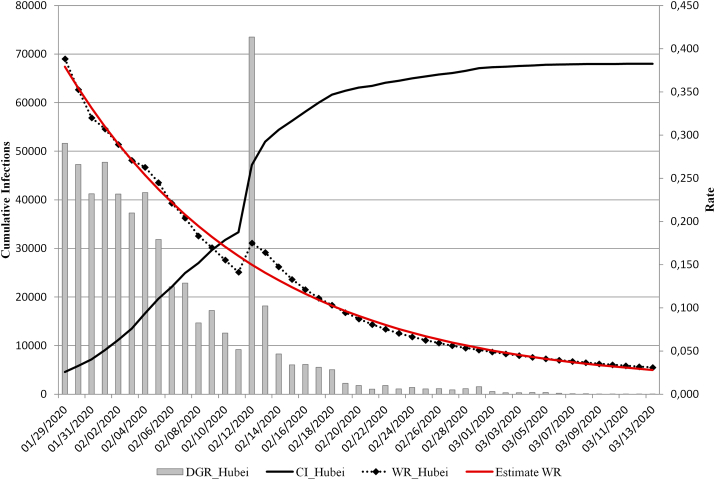
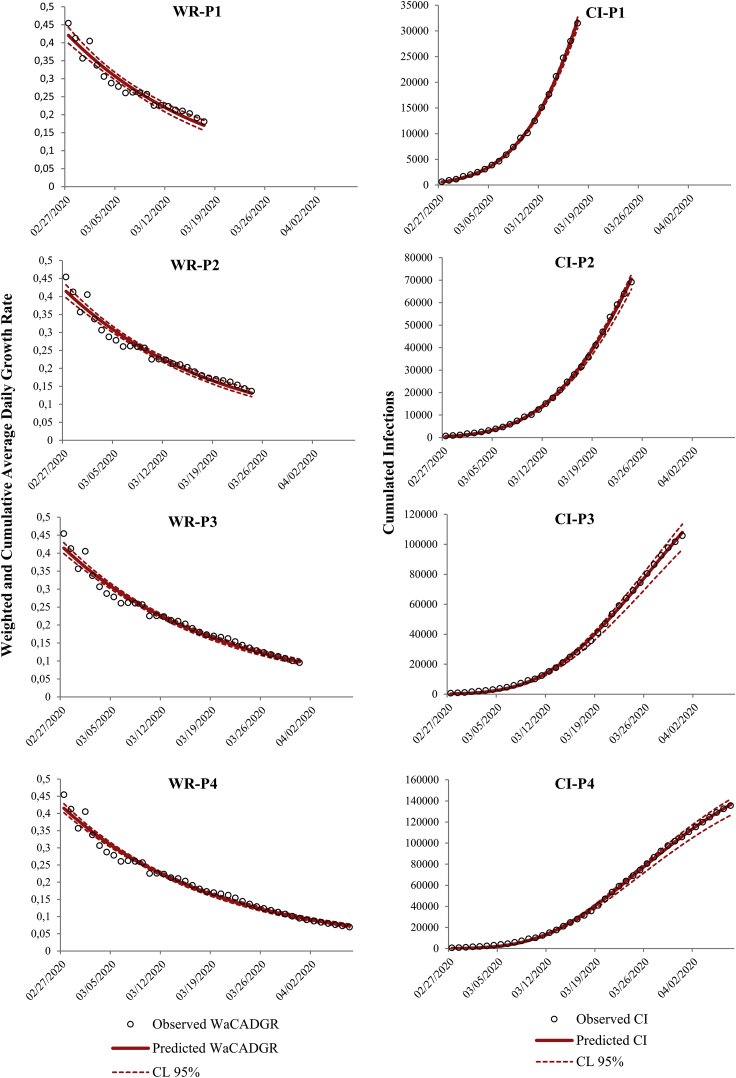
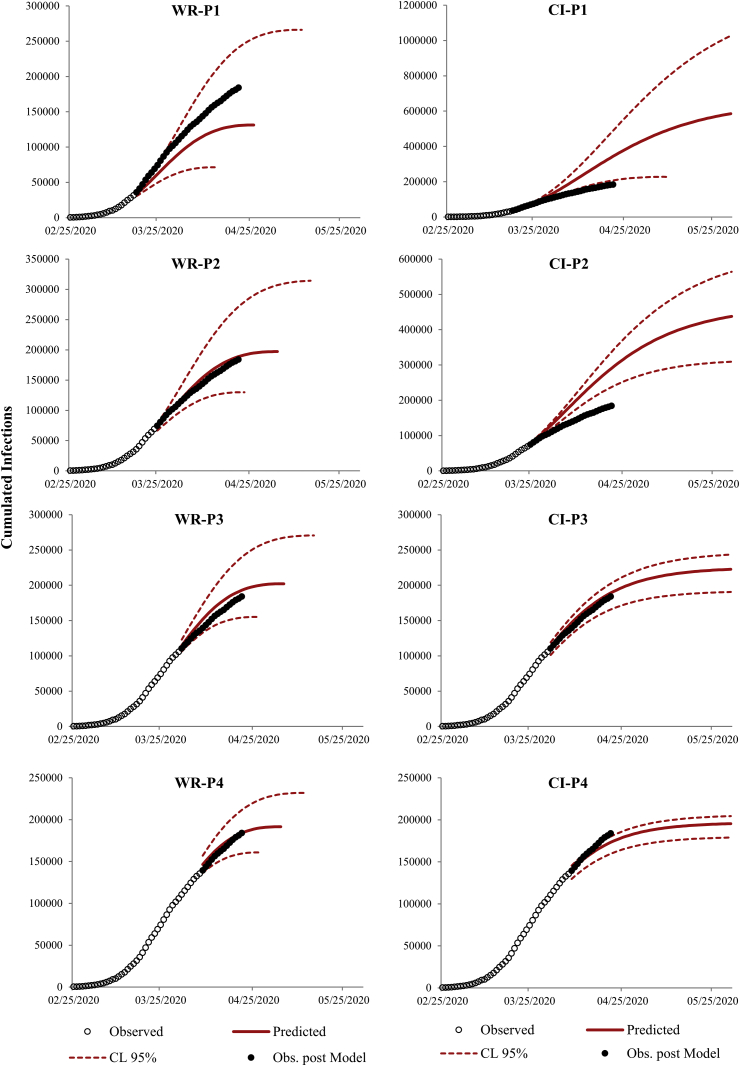
To estimate the size of the novel coronavirus (COVID-19) outbreak in the early stage in Italy, this paper introduces the cumulated and weighted average daily growth rate (WR) to evaluate an epidemic curve. On the basis of an exponential decay model (EDM), we provide estimations of the WR in four-time intervals from February 27 to April 07, 2020. By calibrating the parameters of the EDM to the reported data in Hubei Province of China, we also attempt to forecast the evolution of the outbreak. We compare the EDM applied to WR and the Gompertz model, which is based on exponential decay and is often used to estimate cumulative events. Specifically, we assess the performance of each model to short-term forecast of the epidemic, and to predict the final epidemic size. Based on the official counts for confirmed cases, the model applied to data from February 27 until the 17th of March estimate that the cumulative number of infected in Italy could reach 131,280 (with a credibility interval 71,415-263,501) by April 25 (credibility interval April 12 to May 3). With the data available until the 24st of March the peak date should be reached on May 3 (April 23 to May 23) with 197,179 cumulative infections expected (130,033-315,269); with data available until the 31st of March the peak should be reached on May 4 (April 25 to May 18) with 202,210 cumulative infections expected (155.235-270,737); with data available until the 07st of April the peak should be reached on May 3 (April 26 to May 11) with 191,586 (160,861-232,023) cumulative infections expected. Based on the average mean absolute percentage error (MAPE), cumulated infections forecasts provided by the EDM applied to WR performed better across all scenarios than the Gompertz model. An exponential decay model applied to the cumulated and weighted average daily growth rate appears to be useful in estimating the number of cases and peak of the COVID-19 outbreak in Italy and the model was more reliable in the exponential growth phase.
Keywords: CI, cumulative infections; Coronavirus; Covid-19; DGR, daily growth rate; DI, daily infections; Daily grow rate; EDM, exponential decay model; Exponential decay model; Italy; Short-term forecasts; WR, weighted and cumulated average of the daily growth rate.
© 2021 The Authors.
Conflict of interest statement
We know of no conflicts of interest associated with this publication, and there has been no significant financial support for this work that could have influenced its outcome. As Corresponding Author, I confirm that the manuscript has been read and approved for submission by all the named authors.
Figures
References
-
- Andrej-Nikolai Spiess propagate: Propagation of Uncertainty. R package version 1.0-6. 2018. https://CRAN.R-project.org/package=propagate
-
- Chintalapudi N., Battineni G., Amenta F. COVID-19 virus outbreak forecasting of registered and recovered cases after sixty day lockdown in Italy: A data driven model approach. Journal of Microbiology, Immunology, and Infection. 2020 doi: 10.1016/j.jmii.2020.04.004. pii: S1684-1182(20)30098-0. - DOI - PMC - PubMed
-
- Grothendieck G. nls2: Non-linear regression with brute force. R package version 0.2. 2013. https://CRAN.R-project.org/package=nls2
LinkOut - more resources
Full Text Sources
Other Literature Sources
Miscellaneous
