[Preprint]. 2020 Dec 24:2020.12.22.20248736.
doi: 10.1101/2020.12.22.20248736.

REAL-TIME MECHANISTIC BAYESIAN FORECASTS OF COVID-19 MORTALITY

REAL-TIME MECHANISTIC BAYESIAN FORECASTS OF COVID-19 MORTALITY

Graham C Gibson et al. medRxiv. .

Update in

Abstract

The COVID-19 pandemic emerged in late December 2019. In the first six months of the global outbreak, the US reported more cases and deaths than any other country in the world. Effective modeling of the course of the pandemic can help assist with public health resource planning, intervention efforts, and vaccine clinical trials. However, building applied forecasting models presents unique challenges during a pandemic. First, case data available to models in real-time represent a non-stationary fraction of the true case incidence due to changes in available diagnostic tests and test-seeking behavior. Second, interventions varied across time and geography leading to large changes in transmissibility over the course of the pandemic. We propose a mechanistic Bayesian model (MechBayes) that builds upon the classic compartmental susceptible-exposed-infected-recovered (SEIR) model to operationalize COVID-19 forecasting in real time. This framework includes non-parametric modeling of varying transmission rates, non-parametric modeling of case and death discrepancies due to testing and reporting issues, and a joint observation likelihood on new case counts and new deaths; it is implemented in a probabilistic programming language to automate the use of Bayesian reasoning for quantifying uncertainty in probabilistic forecasts. The model has been used to submit forecasts to the US Centers for Disease Control, through the COVID-19 Forecast Hub. We examine the performance relative to a baseline model as well as alternate models submitted to the Forecast Hub. Additionally, we include an ablation test of our extensions to the classic SEIR model. We demonstrate a significant gain in both point and probabilistic forecast scoring measures using MechBayes when compared to a baseline model and show that MechBayes ranks as one of the top 2 models out of 10 submitted to the COVID-19 Forecast Hub. Finally, we demonstrate that MechBayes performs significantly better than the classical SEIR model.


Figures

Figure 1.
Figure 1.
Flow diagram for MechBayes. Susceptibles (S) become exposed (E) with a rate of βtIN (proportional to the number of infected and infection probability times average number of contacts). Exposed individuals become infections with a mean time of 1σ. Infectious individuals can either recover or enter a D1 compartment, reperesenting individuals who will eventually succumb to the disease, with probability ρ and after a mean time of 1γ. Individuals in D1 then enter the final death compartment D2 with mean time 1λ. The distinction between D1 and D2 aids in accounting, and helps separate out a parameter governing the time between infectiousness and death, which is useful for model parameterization.
Figure 2.
Figure 2.
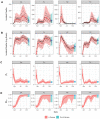
A,B. Example posterior fits as well as 1–4 week ahead forecasts made on October 18, 2020 for four selected states. Shaded regions show 95% prediction intervals for in-sample (red) and forecast (blue) posterior predictive distributions; lines show posterior medians; points show observed data. C. Posterior median and 95% credible interval of time-varying contact rate βt for each of the four states. D. Posterior median and 95% credible interval of the time-varying ratio between cases and deaths parameter (pt,c).
Figure 3.
Figure 3.
A Quantile-quantile plot of absolute error distribution for MechBayes (y-axis) vs. baseline model (x-axis) over every combination of location, forecast date, and target, along with summary metrics. MechBayes absolute error is lower than the baseline error at every quantile except the largest. B Quantile-quantile plot of absolute error distribution zoomed in to errors less than 200 deaths. There are more significant improvements relative to the baseline when the baseline error is high (e.g. more than 60). C Quantile-quantile plot of absolute error distribution for MechBayes (y-axis) vs. alternate models (x-axis) submitted to the Forecast Hub. Each point represents the absolute error for a combination of location, forecast date, and target. D Mean, median and 0.95 quantile of the absolute error distribution for MechBayes (y-axis) and alternate models (x-axis). MechBayes median and mean of the absolute error distribution is lower for all but one model.
Figure 4.
Figure 4.
A Mean absolute errors for MechBayes and the baseline model averaged over all forecast dates and targets for each location. Notice that for states with the largest number of deaths, New Jersey (NJ), New York (NY), Florida (FL), Texas (TX), California (CA), MechBayes uniformly outperforms the baseline. B Mean absolute error box plots for MechBayes and baseline model by target. Each box plot shows the distribution of MAE values for all forecast dates, where one data point is the MAE over all locations for a single date. MechBayes has lower quartiles of mean absolute error across all targets. C Mean absolute errors for MechBayes and the baseline model averaged over all regions and targets by target end date: a point on panel B represents the absolute error of the 1–4 week ahead forecast made for that date. MechBayes has lower mean absolute error for 21 of the 23 forecast dates. D Percent of observations (y-axis) falling within the prediction interval at the given level of confidence (x-axis) for both MechBayes and the baseline model. MechBayes intervals are better calibrated than the baseline at high confidence levels and slightly too wide at lower confidence levels.
Figure 5.
Figure 5.
A Absolute error quantiles of MechBayes Full (y-axis) against the reduced models, MechBayes Fixed-Detection Death-Only and MechBayes Fixed-Detection. MechBayes Full uniformly improves over MechBayes Fixed-Detection and improves in all but the maximum quantile over MechBayes Fixed-Detection Death-Only. B Percent of observations (y-axis) falling within the prediction interval at the given confidence level (x-axis). MechBayes Fixed Detection seems to be closest to the nominal level of coverage, suggesting that adding the uncertainty in the ratio between observed cases and observed deaths made the model slightly under-confident. In contrast, using only observations on deaths significantly compromised model uncertainty.

References

    1. Ray Evan L, Wattanachit Nutcha, Niemi Jarad, Kanji Abdul Hannan, House Katie, Cramer Estee Y, Bracher Johannes, Zheng Andrew, Yamana Teresa K, Xiong Xinyue, et al. Ensemble Forecasts of Coronavirus Disease 2019 (COVID-19) in the us. medRxiv, 2020.
    1. Lutz Chelsea S, Huynh Mimi P, Schroeder Monica, Anyatonwu Sophia, Dahlgren F Scott, Danyluk Gregory, Fernandez Danielle, Greene Sharon K, Kipshidze Nodar, Liu Leann, et al. Applying infectious disease forecasting to public health: a path forward using influenza forecasting examples. BMC Public Health, 19(1):1659, 2019. - PMC - PubMed
    1. Myers Monica F, Rogers DJ, Cox J, Flahault Antoine, and Hay Simon I. Forecasting disease risk for increased epidemic preparedness in public health In Advances in parasitology, volume 47, pages 309–330. Elsevier, 2000. - PMC - PubMed
    1. Kermack William Ogilvy and McKendrick Anderson G. A contribution to the mathematical theory of epidemics. Proceedings of the royal society of london. Series A, Containing papers of a mathematical and physical character, 115(772):700–721, 1927.
    1. Korolev Ivan. Identification and Estimation of the SEIRD epidemic model for COVID-19. Binghamton University. http://dx.doi.org/10.2139/ssrn, 3569367, 2020. - PMC - PubMed

Publication types