. 2021 Jan 25;49(2):986-1005.
doi: 10.1093/nar/gkaa1229.

Expansion and re-classification of the extracytoplasmic function (ECF) σ factor family

Affiliations

Expansion and re-classification of the extracytoplasmic function (ECF) σ factor family

Delia Casas-Pastor et al. Nucleic Acids Res. .

Abstract

Extracytoplasmic function σ factors (ECFs) represent one of the major bacterial signal transduction mechanisms in terms of abundance, diversity and importance, particularly in mediating stress responses. Here, we performed a comprehensive phylogenetic analysis of this protein family by scrutinizing all proteins in the NCBI database. As a result, we identified an average of ∼10 ECFs per bacterial genome and 157 phylogenetic ECF groups that feature a conserved genetic neighborhood and a similar regulation mechanism. Our analysis expands previous classification efforts ∼50-fold, enriches many original ECF groups with previously unclassified proteins and identifies 22 entirely new ECF groups. The ECF groups are hierarchically related to each other and are further composed of subgroups with closely related sequences. This two-tiered classification allows for the accurate prediction of common promoter motifs and the inference of putative regulatory mechanisms across subgroups composing an ECF group. This comprehensive, high-resolution description of the phylogenetic distribution of the ECF family, together with the massive expansion of classified ECF sequences and an openly accessible data repository called 'ECF Hub' (https://www.computational.bio.uni-giessen.de/ecfhub), will serve as a powerful hypothesis-generator to guide future research in the field.


Figures

Figure 1.
Figure 1.
ECF retrieval pipeline. (A) We collected and aligned ECF sequences from previous classification efforts (1,4,5) and built an HMM from the area containing σ2, linker and σ4 regions. (B) In order to define a HMMER bit-score threshold for ECF extraction, we used the ECFs from (A) as positives and the σ factors containing a σ3 domain in the Pfam database as negatives. We scored positives and negatives using the HMM model from (A) and derived a threshold that produced the largest specificity and sensitivity in the classification process. (C) We used the HMM model from (A) to score all proteins from NCBI as per February 2017, using as threshold the bit-score defined in (B). Putative ECFs without σ2 or σ4 domain, or with σ3 domain, or proteins with characters that do not denote amino acids, were discarded. The final set of non-redundant ECFs includes 177 910 proteins.
Figure 2.
Figure 2.
Taxonomic analysis of the ECF library. (A) Taxonomic composition of the input genomes, ECFs and average number of ECFs per genome in the original ECF classification (1,4,5) and in this work. For the data of this work, we only included ECFs and genomes from complete and non-metagenomic assemblies tagged as ‘representative’ or ‘reference’ in NCBI (https://www.ncbi.nlm.nih.gov/genome/browse#!/prokaryotes/), selecting RefSeq assemblies when both RefSeq and GenBank assemblies are available for the same genome. (B) Number of ECFs per genome for phyla with >20 complete genomes available. Average number of ECFs per genome is shown.
Figure 3.
Figure 3.
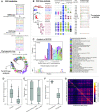
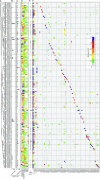
ECF clustering pipeline. (A) The ECF clustering pipeline starts with non-redundant ECF σ factor sequences stripped to their σ2 and σ4 domains, which were clustered using MMSeqs2 and refined using bisecting K-means until the maximum intra-cluster distance was ≤0.6. Subgroups with less than 10 sequences were not further considered. The consensus sequences of the resulting subgroups were hierarchically clustered, resulting in the ECF σ factor phylogenetic tree, which was used as the basis for the ECF group definition (see Supplemental material for details). (B) Example of the resulting ECF tree for the clade composed of groups ECF267, ECF268, ECF269, ECF02 and ECF32. Leaves of the phylogenetic tree represent the consensus sequence of a subgroup. Every branch is associated to a bootstrap value. High bootstrap values are usually present in branches that define groups. The presence of shared conserved protein domain architectures (>50% conservation) in the genetic neighborhoods of subgroups that form monophyletic clades was used as a criterion for the ECF group definition. The number of non-redundant ECFs and ECFs from ‘representative’ and ‘reference’ genomes is included as a column (N/N(rep/ref)). Target promoter motifs were predicted for subgroups as explained in Supplemental material. Subgroups with non-self-regulated ECFs do not feature a conserved promoter motif (see ECF32 description). (C) Example analysis of group ECF02. The bar plot shows the position-dependent frequency of domain architectures in the genetic context of members of ECF02 from ‘representative’ or ‘reference’ organisms (N = 832). Only domain architectures that appear in >20% of the proteins encoded in a certain position are shown. Note that the architecture frequency might be underestimated due to the presence of higher scoring overlapping domains that interfere with the automatic domain identification (see Supplemental material: ECF group analysis). The predicted target promoter motif for ECF02 is also shown and has been confirmed for several members of ECF02 (see description of ECF02). (D) ECF group and subgroup size distribution, represented as box-plot. Size is expressed as the number of non-redundant proteins. (E) Bootstrap value distribution in branches that define groups compared to branches that do not define groups. Bootstrap values tend to be larger in the former. (F) Permutation validation of ECF subgroups. Average k-tuple distance for ECF subgroups and 100 sets of randomly generated clusters with the same size distribution as ECF subgroups. The difference in score distribution is statistically significant (Student's t-test P-value < 1e–16). (G) Thumbnail of the average normalized bit-score of each ECF group (x-axis) against each HMM (y-axis). See Supplementary Figure S2 for the complete version of this graph.
Figure 4.
Figure 4.
ECF σ factor tree. Phylogenetic tree of the consensus sequences of ECF subgroups. Clades are colored and named according to their group. Ring #1 shows which ECF groups the clusters would have been assigned to, if they were based on the original ECF classification. Original ECF groups with <1% sequences are shown under ‘Other’. Ring #2 shows the phylogenetic origin of the majority of ECFs in a given subgroup.
Figure 5.
Figure 5.
ECF abundance in different phyla. The heatmap shows the average number of ECFs from a certain ECF group in a certain phylum. We also show ECFs that are grouped against subgroups that are not part of groups and ECFs that remain ungrouped. Underrepresented phyla are rich in the latter category. These values were calculated using the set of ECFs present in complete, non-metagenomic genomes from ‘reference’ or ‘representative’ organisms, selecting only RefSeq assemblies when both RefSeq and GenBank are available for the same organism. Organisms not assigned to any phyla are represented by ‘-‘.
Figure 6.
Figure 6.
Genetic context analysis of ECF groups. (A) Schematic representation of the ECF σ factor tree. (B, C) Bar plot with the average length after σ4 domain (C-terminal) or before σ2 domain (N-terminal), respectively. Error bars indicate standard deviation. (D) Average number of regulatory domains in genetic neighborhoods per ECF. (E) Number of predicted transmembrane helices of the putative anti-σ factor encoded in the genetic neighborhood of groups. (F) Average number of anti-σ factor domains per ECF, predicted in the genetic neighborhood of ECF group members.
Figure 7.
Figure 7.
Genetic neighborhood of ECF groups that lack a canonical regulator. The left side shows the typical positions of genes encoding a certain protein domain architecture (present in >50% of the genetic contexts). Only positions ±3 from the ECF coding sequence are displayed. The direction of the arrow indicates the most common orientation of the coding sequence. The cumulative percentage of proteins with a certain domain architecture is shown on the right. Only proteins from reference and representative organisms, taking only RefSeq proteins when both RefSeq and GenBank assemblies exist for the same genome, are considered. Only for groups ECF202 and ECF210 (marked with stars) sequences deriving from non-representative organisms were included, since these ECF groups contain less than 10 proteins in representative organisms.
Figure 8.
Figure 8.
Schematic overview of the ECF Hub's capabilities. ECF Hub enables access to novel classification, which can be interactively explored based on taxonomy, ECF groups and literature. For this purpose, a variety of high-quality visualizations and statistics are provided. With the ECF Hub, scientist can upload and process own protein sequences in order to detect and classify ECFs. Moreover, the ECF Hub serves as a collaborative platform where users are able to comment on existing content or propose new features. Finally, registered users have their own private area for analyses, favorites, and community interaction.
Figure 9.
Figure 9.
Comparison between ECFfinder and ECF Hub assignment for selected genomes. Selected genomes were processed with the ECFfinder website and the ECF Hub classification tool. Left: ECF predictions obtained from ECFfinder and ECF Hub are generally in accordance. Right: The ECF Hub, which incorporates the new classification scheme, enables a larger fraction of ECFs to be classified.

References

    1. Staroń A., Sofia H.J., Dietrich S., Ulrich L.E., Liesegang H., Mascher T.. The third pillar of bacterial signal transduction: classification of the extracytoplasmic function (ECF) σ factor protein family. Mol. Microbiol. 2009; 74:557–581. - PubMed
    1. Helmann J.D. The extracytoplasmic function (ECF) sigma factors. Adv. Microb. Physiol. 2002; 46:47–110. - PubMed
    1. Paget M.S.B., Helmann J.D.. The σ70 family of sigma factors. Genome Biol. 2003; 4:203. - PMC - PubMed
    1. Jogler C., Waldmann J., Huang X., Jogler M., Glöckner F.O., Mascher T.. Identification of proteins likely to be involved in morphogenesis, cell division, and signal transduction in planctomycetes by comparative genomics. J. Bacteriol. 2012; 194:6419–6430. - PMC - PubMed
    1. Huang X., Pinto D., Fritz G., Mascher T.. Environmental sensing in Actinobacteria: a comprehensive survey on the signaling capacity of this phylum. J. Bacteriol. 2015; 197:2517–2535. - PMC - PubMed

Publication types

LinkOut - more resources