. 2021 Jan 25;49(2):1075-1093.
doi: 10.1093/nar/gkaa1225.

A deafness-associated tRNA mutation caused pleiotropic effects on the m1G37 modification, processing, stability and aminoacylation of tRNAIle and mitochondrial translation

Affiliations

A deafness-associated tRNA mutation caused pleiotropic effects on the m1G37 modification, processing, stability and aminoacylation of tRNAIle and mitochondrial translation

Feilong Meng et al. Nucleic Acids Res. .

Abstract

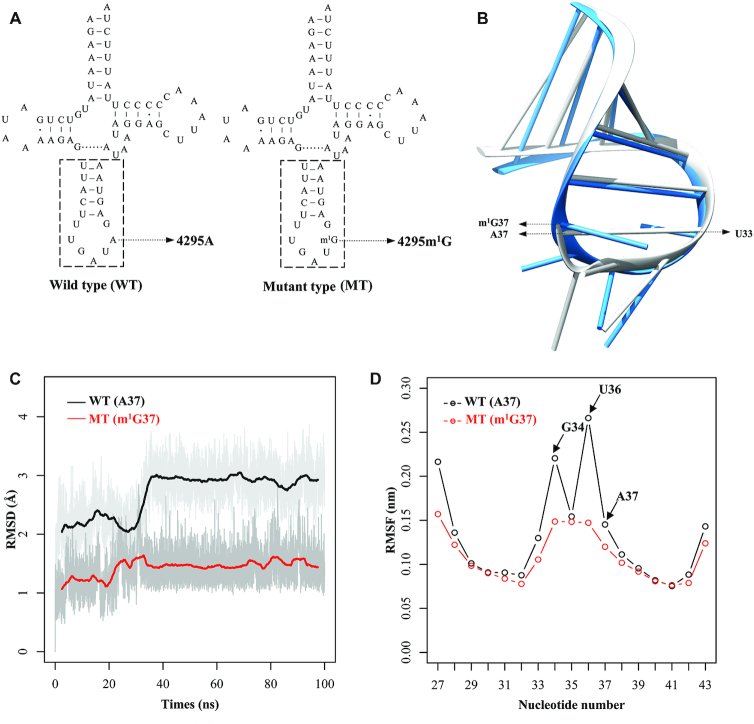
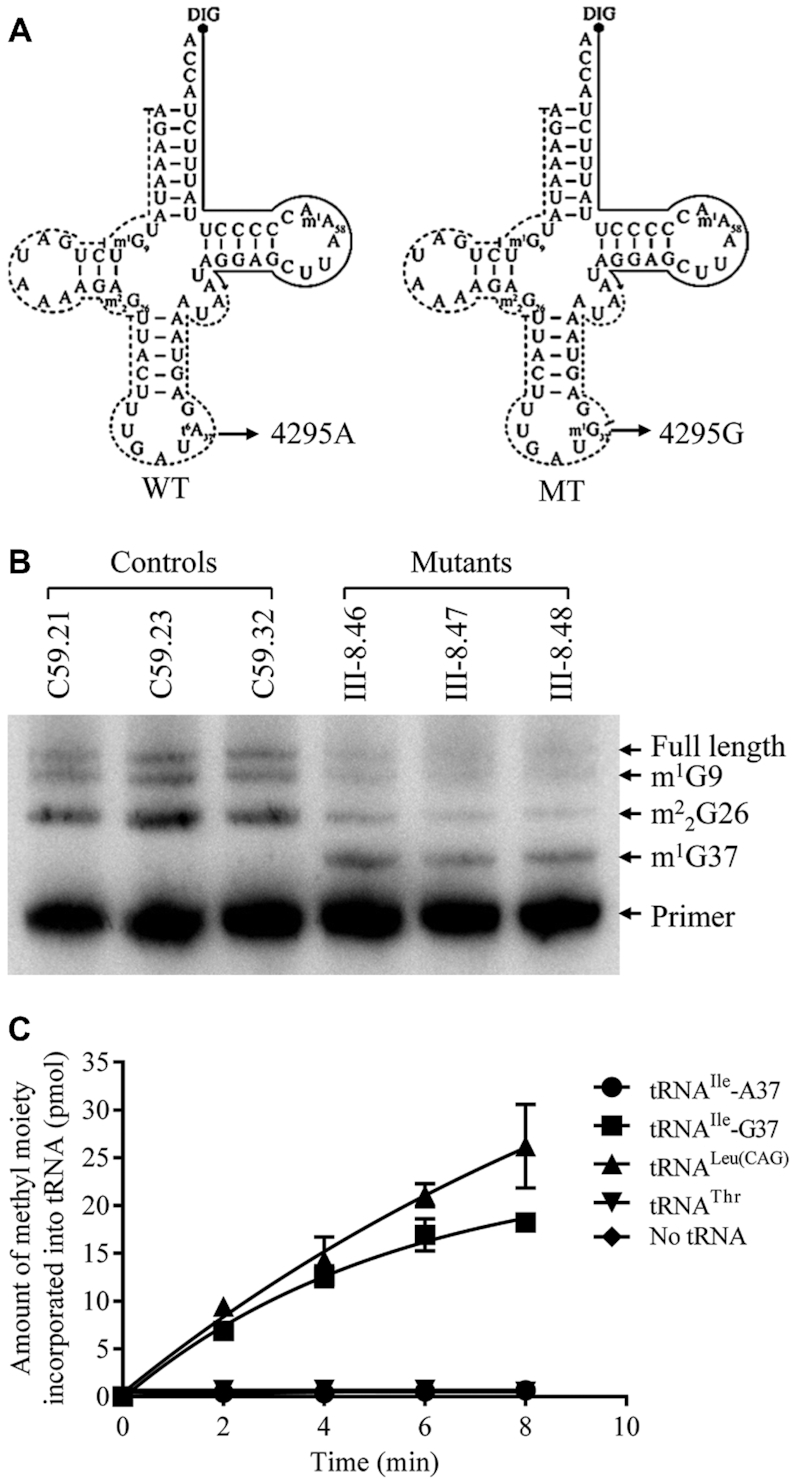
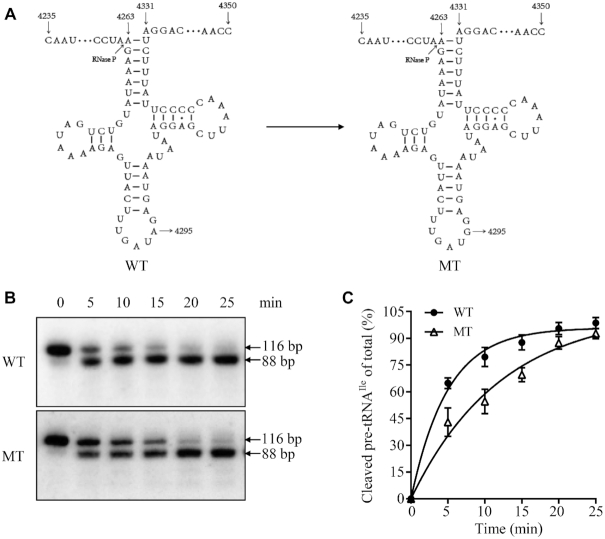
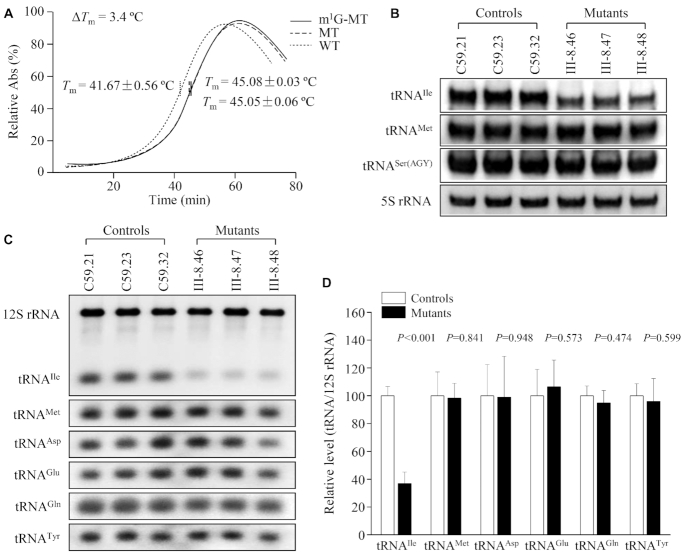
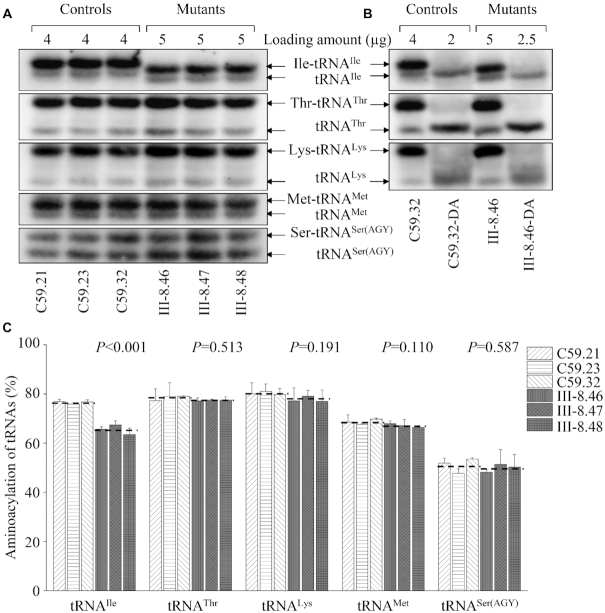
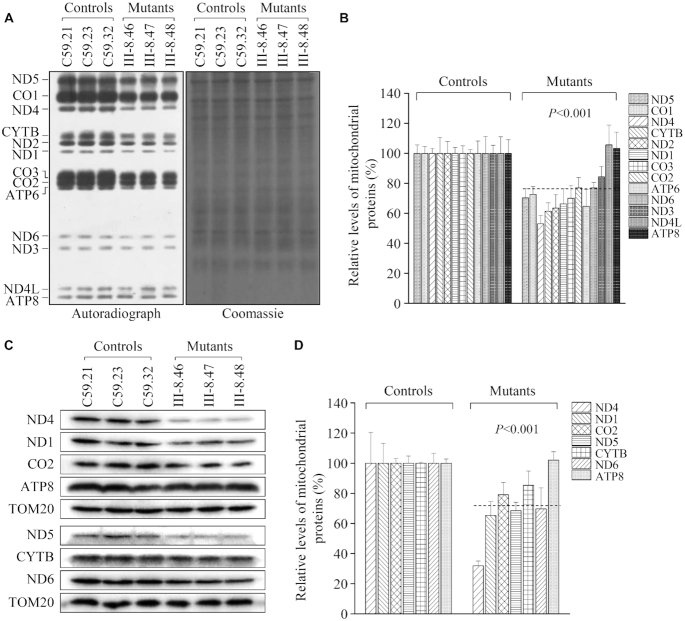
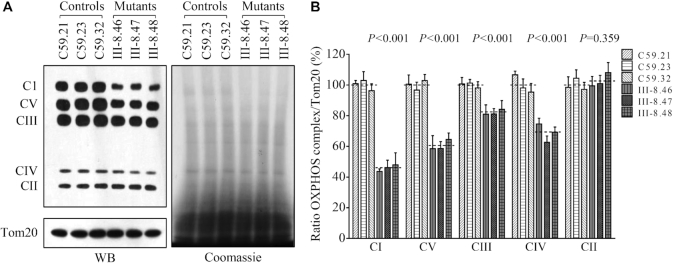
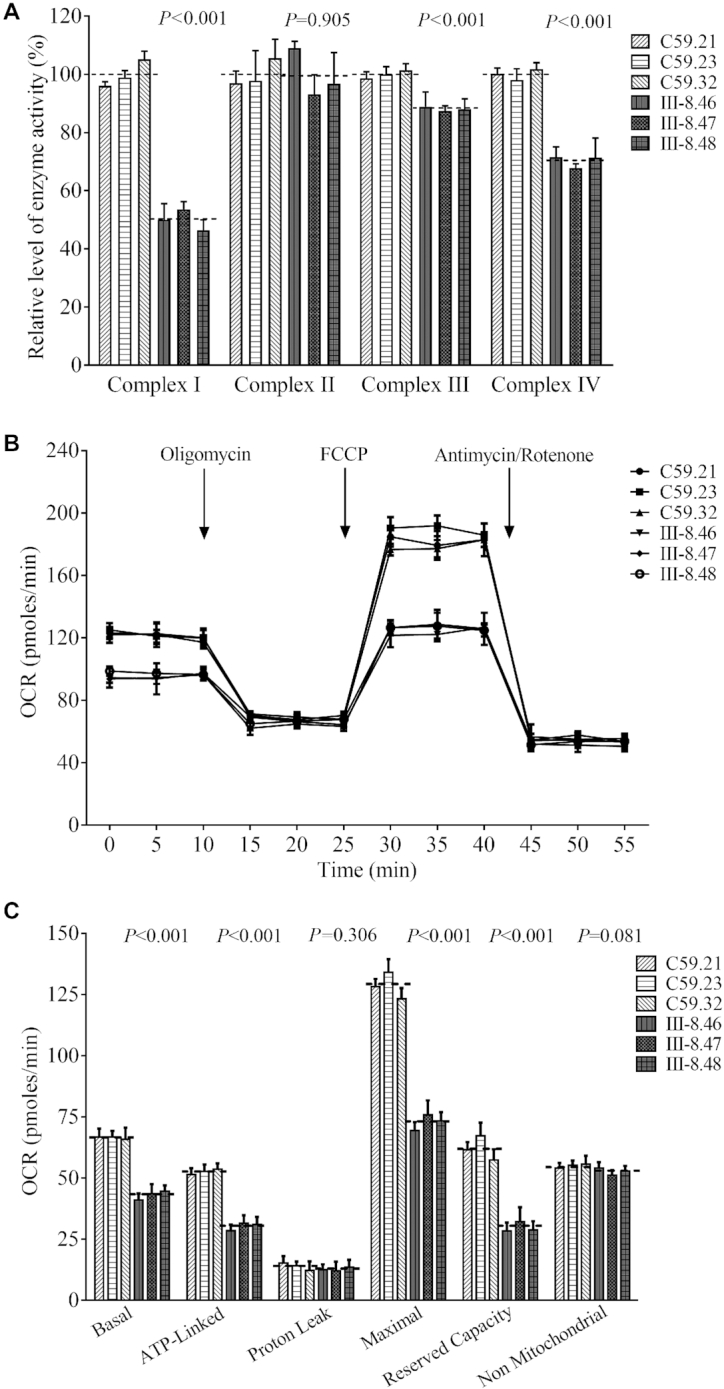
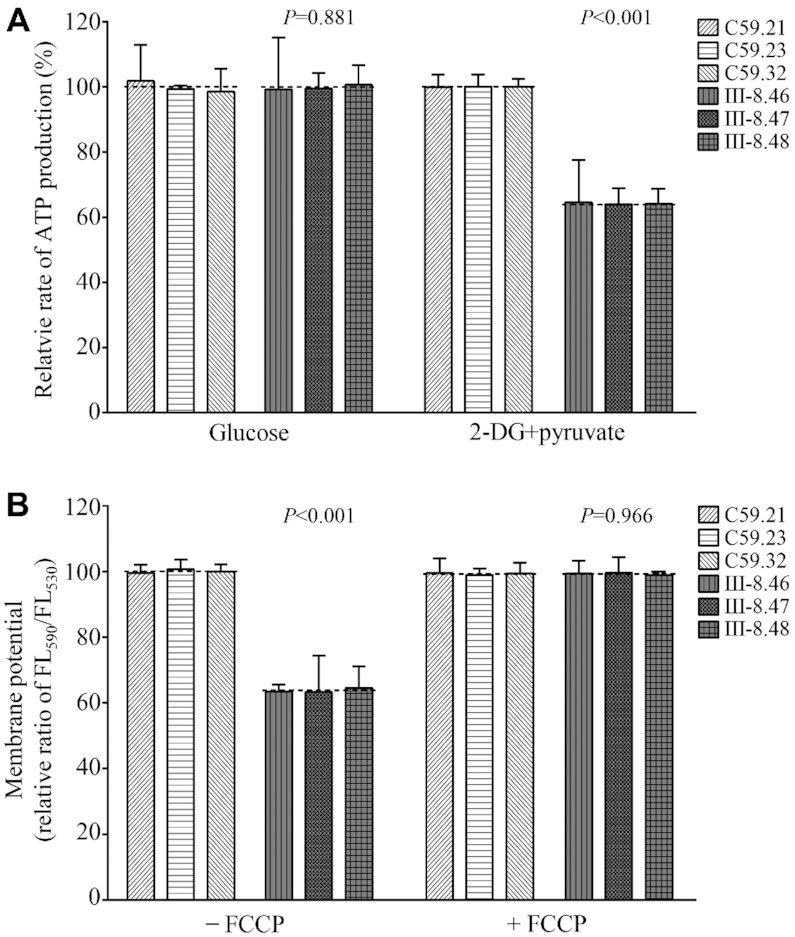
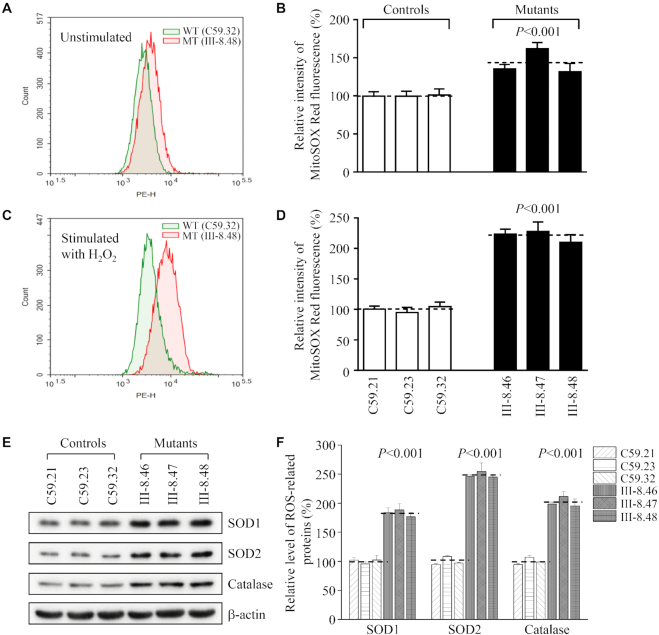
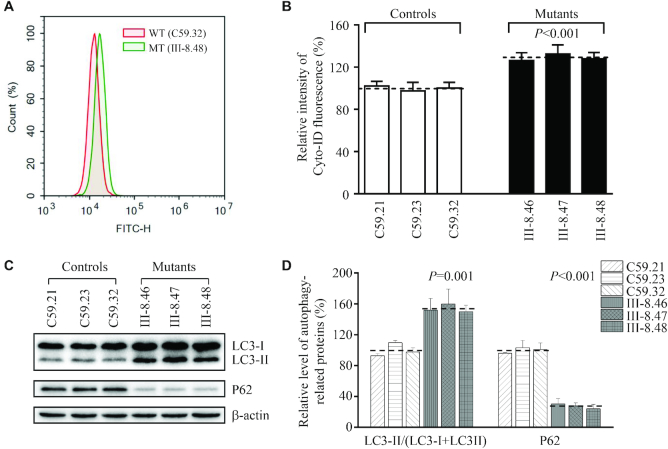
Defects in the posttranscriptional modifications of mitochondrial tRNAs have been linked to human diseases, but their pathophysiology remains elusive. In this report, we investigated the molecular mechanism underlying a deafness-associated tRNAIle 4295A>G mutation affecting a highly conserved adenosine at position 37, 3' adjacent to the tRNA's anticodon. Primer extension and methylation activity assays revealed that the m.4295A>G mutation introduced a tRNA methyltransferase 5 (TRMT5)-catalyzed m1G37 modification of tRNAIle. Molecular dynamics simulations suggested that the m.4295A>G mutation affected tRNAIle structure and function, supported by increased melting temperature, conformational changes and instability of mutated tRNA. An in vitro processing experiment revealed that the m.4295A>G mutation reduced the 5' end processing efficiency of tRNAIle precursors, catalyzed by RNase P. We demonstrated that cybrid cell lines carrying the m.4295A>G mutation exhibited significant alterations in aminoacylation and steady-state levels of tRNAIle. The aberrant tRNA metabolism resulted in the impairment of mitochondrial translation, respiratory deficiency, decreasing membrane potentials and ATP production, increasing production of reactive oxygen species and promoting autophagy. These demonstrated the pleiotropic effects of m.4295A>G mutation on tRNAIle and mitochondrial functions. Our findings highlighted the essential role of deficient posttranscriptional modifications in the structure and function of tRNA and their pathogenic consequence of deafness.


Figures

Figure 1.
Figure 1.
MD simulations on the anticodon stem-loop of wild-type and mutated tRNAIle. (A) Cloverleaf structure of human mitochondrial tRNAIle. An arrow indicated the location of the m.4295A>m1G mutation. Nucleotides at the dashed box in the anticodon stem–loop of tRNAIle were used for MD simulation. (B) The tertiary structures of the anticodon stem-loop for the wild-type (gray) and mutated (dodger blue) tRNAIle. (C) Time evolution of the root mean square deviation (RMSD) values of all backbone atoms on the anticodon stem–loop for the wild-type (WT) (black curve) and mutant (MT) (red curve) of tRNAIle. (D) RMSF curves calculated from the backbone atoms for the wild-type (black lines) and mutated (red lines) anticodon stem-loop of tRNAIle.
Figure 2.
Figure 2.
The m.4295A>G mutation introduced the m1G37 modification of tRNAIle. (A) Schematic of methylation shown in the cloverleaf structures of the human mitochondrial tRNAIle. An arrow denotes the location of the m.4295A>G mutation. Solid lines represent the DIG-labeled oligonucleotide probe specific for mt-tRNAIle. Broken lines represent the potential stops of primer extension and m1G or m2G. (B) Primer extension demonstrated the creation of m1G37 in the tRNAIle carrying the m.4295A>G mutation. The primer extension termination products are showed as m1G9, m22G26 and m1G37. (C) Methylation activity assays. The unmodified human mitochondrial wild type (A37) and mutant (G37) tRNAIle, cytosolic tRNALeu(CAG) and tRNAThr were generated from in vitro transcription. The unmodified tRNA transcripts were incubated with M. jannaschii (Mj-Trm5) in the presence of S-adenosyl-l-methionine. Samples were withdrawn and stopped after 2, 4, 6 or 8 min, respectively. The relative modification efficiency was calculated from the initial phase of the reaction. The calculations were based on three independent determinations.
Figure 3.
Figure 3.
In vitro assay for the processing of mitochondrial tRNAIle precursors. (A) Mitochondrial tRNAIle precursors. Twenty-nine nucleotides (nt) of 5′ end leaders of tRNAIle were shown, including the m.4295A>G substitution. (B) In vitro processing assays. Processing assays with mitochondrial RNase P were carried out in parallel for wild type and mutant substrates. Samples were withdrawn and stopped after 5, 10, 15, 20 or 25 min, respectively. Reaction products were resolved by denaturing polyacrylamide gel electrophoresis and reacted with a chemiluminescent substrate CDP-Star™ to detect the chemiluminescent. The graph shows the results of a representative experiment of 25 min reaction. (C) Relative processing efficiencies of tRNAIle precursors catalyzed by RNase P. The relative processing efficiencies were calculated from the initial phase of the reaction. The calculations were based on three independent determinations.
Figure 4.
Figure 4.
Analysis of conformation and stability of tRNAIle. (A) Thermal stability of wild type (A37), mutant (unmodified G37 and m1G37) tRNAIle. ΔTm indicates the difference of Tm values between wild type (A37) and mutant (G37) tRNAIle. The calculations were based on three independent experiments. (B) Northern blot analysis of tRNA under native condition. Two microgram of total mitochondrial RNA from various cell lines were electrophoresed through native polyacrylamide gel, electroblotted and hybridized with DIG-labeled oligonucleotide probes specific for the tRNAIle, tRNAMet and tRNASer(AGY), respectively. (C) Northern blot analysis of tRNA under denaturing condition. Two microgram of total mitochondrial RNA from various cell lines were electrophoresed through a denaturing polyacrylamide gel, electroblotted and hybridized with DIG-labeled oligonucleotide probes specific for the tRNAIle, tRNAMet, tRNAAsp, tRNAGlu, tRNALys and 12S rRNA, respectively. (D) Quantification of tRNA levels. Average relative tRNAs content per cell, was normalized to the average content per cell of reference 12S rRNA in three cybrid cell lines derived from one hearing-impaired subject (III-8) and three cybrid cell lines derived from one control subject (C59). The values for the latter are expressed as percentages of the average values for the control cell lines. The calculations were based on three independent determinations of each tRNA content in each cell line and three determinations of the content of reference tRNA marker in each cell line. The error bars indicate two standard deviations. P indicates the significance, according to the t-test, of the differences between mutant and control cell lines.
Figure 5.
Figure 5.
In vivo aminoacylation assays. (A) Various amount of total mitochondrial RNA purified from six cell lines under acid conditions were electrophoresed at 4°C through an acid (pH 5.0) 10% polyacrylamide–8 M urea gel, electroblotted and hybridized with a DIG-labeled oligonucleotide probe specific for the mt-tRNAIle. The blots were then stripped and rehybridized with mt-tRNAThr, tRNALys, tRNAMet and tRNASer(AGY), respectively. (B) The samples from one control (C59.32) and mutant (III-8.46) cell lines were deacylated (DA) by heating for 10 min at 60°C at pH.8.3 and electrophoresed as above. (C) Qualification of aminoacylated proportions of tRNAs in the mutant and control cell lines. The calculations were based on three independent determinations. Graph details and symbols are explained in the legend to the Figure 4.
Figure 6.
Figure 6.
Analysis of mitochondrial translation. (A) Representative gel for electrophoretic patterns of the mitochondrial translation products of six cybrid cell lines labeled for 30 min with [35S]methionine in the presence of 100 μg/ml of emetine and corresponding Coomassie Brilliant Blue stained gel used as loading control. Samples containing equal amounts of protein (30 μg) were run in SDS/polyacrylamide gradient gels. CO1, CO2 and CO3 indicate subunits I, II, and III of cytochrome c oxidase; ND1, ND2, ND3, ND4, ND4L, ND5 and ND6, subunits 1, 2, 3, 4, 4L, 5 and 6 of the respiratory chain reduced nicotinamide-adenine dinucleotide dehydrogenase; A6 and A8, subunits 6 and 8 of the H+-ATPase; and CYTB, apocytochrome b. (B) Quantification of the rates of the mitochondrial translation labeling. The rates of mitochondrial protein labeling were expressed as percentages of the value for average values of three control cybrids in each gel, with error bars representing two SDs. A total of three independent labeling experiments and three electrophoretic analyses of each labeled preparation were performed on cell lines. (C) Twenty micrograms of total cellular proteins from various cell lines were electrophoresed through a denaturing polyacrylamide gel, electroblotted and hybridized with 7 mtDNA encoded subunits in mutant and control cells with TOM20 as a loading control. (D) Quantification of mitochondrial protein levels. Average relative ND1, ND4, ND5, ND6, CO2, ATP8 and CYTB content per cell, were normalized to the average content per cell of TOM20 in three mutant cell lines carrying the m.4295A>G mutation and three control cell lines lacking the mutation.
Figure 7.
Figure 7.
Blue-native gel analysis of OXPHOS complexes. (A) The steady-state levels of five OXPHOS complexes by Blue-Native gel electrophoresis. Thirty microgram of mitochondrial proteins from mutant and control cell lines were electrophoresed through a Blue-Native gel, electroblotted and hybridized with antibody cocktail specific for subunits of each OXPHOS complex as well as Tom20 and Coomassie staining as a loading control. (B) Quantification of levels of complexes I, II, III, IV and V in mutant and control cell lines. The calculations were based on three independent experiments. Graph details and symbols are explained in the legend to Figure 4.
Figure 8.
Figure 8.
Respiration assays. (A) Enzymatic activities of respiratory chain complexes. The activities of respiratory complexes were investigated by enzymatic assay on complexes I, II, III, and IV in mitochondria isolated from various cell lines. (B) An analysis of O2 consumption in the various cell lines using different inhibitors. The rates of O2 (OCR) were first measured on 2 × 10⁴ cells of each cell line under basal condition and then sequentially added to oligomycin (1.5 μM), carbonyl cyanide p-(trifluoromethoxy) phenylhydrazone (FCCP) (0.5 μM), rotenone (1 μM) and antimycin A (1 μM) at indicated times to determine different parameters of mitochondrial functions. (C) Graphs presented the ATP-linked OCR, proton leak OCR, maximal OCR, reserve capacity and non-mitochondrial OCR in mutant and control cell lines. Non-mitochondrial OCR was determined as the OCR after rotenone/antimycinA treatment. Basal OCR was determined as OCR before oligomycin minus OCR after rotenone/antimycin A. ATP-linked OCR was determined as OCR before oligomycin minus OCR after oligomycin. Proton leak was determined as Basal OCR minus ATP-linked OCR. Maximal was determined as the OCR after FCCP minus non-mitochondrial OCR. Reserve Capacity was defined as the difference between Maximal OCR after FCCP minus Basal OCR. OCR values were expressed in picomoles of oxygen/minute. The average of 4 determinations for each cell line is shown, the horizontal dashed lines represent the average value for each group. Graph details and symbols are explained in the legend to Figure 4.
Figure 9.
Figure 9.
Measurement of mitochondrial ATP levels and membrane potential analysis. (A) Measurement of mitochondrial and cell ATP levels. Cells were incubated with 10 mM glucose or 5 mM 2-deoxy-d-glucose plus 5 mM pyruvate to determine ATP generation under mitochondrial ATP synthesis for 2 h. Average rates of mitochondrial and cellular ATP level per cell line are shown. (B) Mitochondrial membrane potential analysis. The mitochondrial membrane potential (ΔΨm) was measured in mutant and control cell lines using a fluorescence probe JC-10 assay system. The ratio of fluorescence intensities Ex/Em = 490/590 nm and 490/530 nm (FL590/FL530) were recorded to delineate the ΔΨm level of each sample. Relative ratios of JC-10 fluorescence intensities at Ex/Em = 490/525 and 490/590 nm in the absence and presence of 10 μM of FCCP in three control cell lines and three mutant cell lines were shown. The average of 3–4 determinations for each cell line is shown. Graph details and symbols are explained in the legend to Figure 4.
Figure 10.
Figure 10.
Measurement of mitochondrial ROS production. The levels of ROS generation by mitochondria in living cells from mutant and control cell lines were determined using the mitochondrial superoxide indicator MitoSOX-Red. Fluorescence was measured using a FACS Calibur instrument (BD Biosciences), with excitation at 488 nm and emission at 580 nm. The data were analyzed with Flow Jo software. (A, C) Flow cytometry histogram showing MitoSOX-Red fluorescence of control cybrids (C59.32) (Green) and mutant cybrids (III-8.48) (Red) with or without H2O2 stimulation. (B, D) Relative ratios of MitoSOX-Red fluorescence intensity of control cybrids (C59.32) and mutant cybrids (III-8.48) with or without H2O2 stimulation. (E) Western blotting analysis of antioxidative enzymes SOD1, SOD2 and catalase in six cell lines with β-actin as a loading control. (F) Quantification of SOD1, SOD2 and catalase. Average relative values of SOD1, SOD2 and catalase were normalized to the average values of β-actin in various cell lines. The values for the latter are expressed as percentages of the average values for the control cell lines. The average of three independent determinations for each cell lines is shown. Graph details and symbols are explained in the legend to Figure 4.
Figure 11.
Figure 11.
Assessment of autophagy. (A) Histogram of flow cytometric analysis of mutant cybrids (III-8.48) and control cybrids (C59.32) using CYTOID® Autophagy Detection Kit. Three control and three mutant cybrids were incubated with DMEM in the absence and presence of rapamycin (inducers of autophagy) and chloroquine (lysosomal inhibitor) at 37°C for 18 h, added to CYTO-ID®-Green dye and analyzed using a Novocyte flow cytometer (ACEA Biosciences). (B) Relative ratios of Cyto-ID fluorescence intensity from three mutant and three control cell lines. Three independent determinations were done in each cell line. (C) Western blot analysis for autophagic response proteins: LC3-I/II and p62. Twenty micrograms of total cellular proteins from various cell lines were electrophoresed, electroblotted and hybridized with LC3, p62 and with β-actin as a loading control. (D) Quantification of autophagy markers LC3 I/II and p62 in mutant and control cell lines were determined as described elsewhere (70). Three independent determinations were done in each cell line. G. Graph details and symbols are explained in the legend to Figure 4.

References

    1. Phizicky E.M., Hopper A.K.. tRNA biology charges to the front. Genes Dev. 2010; 24:1832–1860. - PMC - PubMed
    1. El Yacoubi B., Bailly M., de Crécy-Lagard V.. Biosynthesis and function of posttranscriptional modifications of transfer RNAs. Annu. Rev. Genet. 2012; 46:69–95. - PubMed
    1. Bohnsack M.T., Sloan K.E.. The mitochondrial epitranscriptome: the roles of RNA modifications in mitochondrial translation and human disease. Cell Mol. Life Sci. 2018; 75:241–260. - PMC - PubMed
    1. Asano K., Suzuki T., Saito A., Wei F.Y., Ikeuchi Y., Numata T., Tanaka R., Yamane Y., Yamamoto T., Goto T. et al. .. Metabolic and chemical regulation of tRNA modification associated with taurine deficiency and human disease. Nucleic Acids Res. 2018; 46:1565–1583. - PMC - PubMed
    1. Suzuki T., Nagao A., Suzuki T.. Human mitochondrial tRNAs: biogenesis, function, structural aspects, and diseases. Annu. Rev. Genet. 2011; 45:299–329. - PubMed

Publication types

MeSH terms

LinkOut - more resources