. 2021 Jul;48(7):2259-2271.
doi: 10.1007/s00259-020-05152-8. Epub 2021 Jan 4.

Comparing ATN-T designation by tau PET visual reads, tau PET quantification, and CSF PTau181 across three cohorts

Affiliations

Comparing ATN-T designation by tau PET visual reads, tau PET quantification, and CSF PTau181 across three cohorts

Karine Provost et al. Eur J Nucl Med Mol Imaging. 2021 Jul.

Abstract

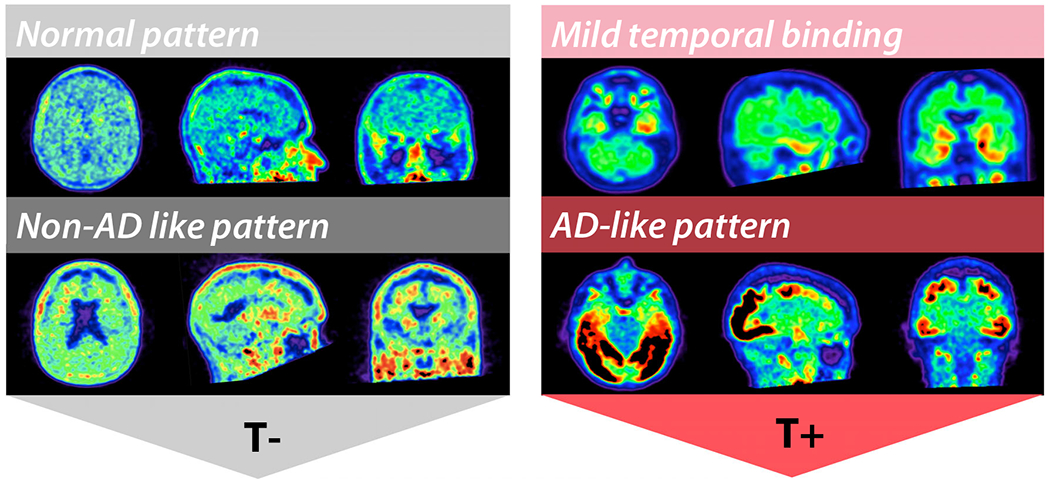
Purpose: To compare rates of tau biomarker positivity (T-status) per the 2018 Alzheimer's Disease (AD) Research Framework derived from [18F]flortaucipir (FTP) PET visual assessment, FTP quantification, and cerebrospinal fluid (CSF) phosphorylated Tau-181 (PTau181).

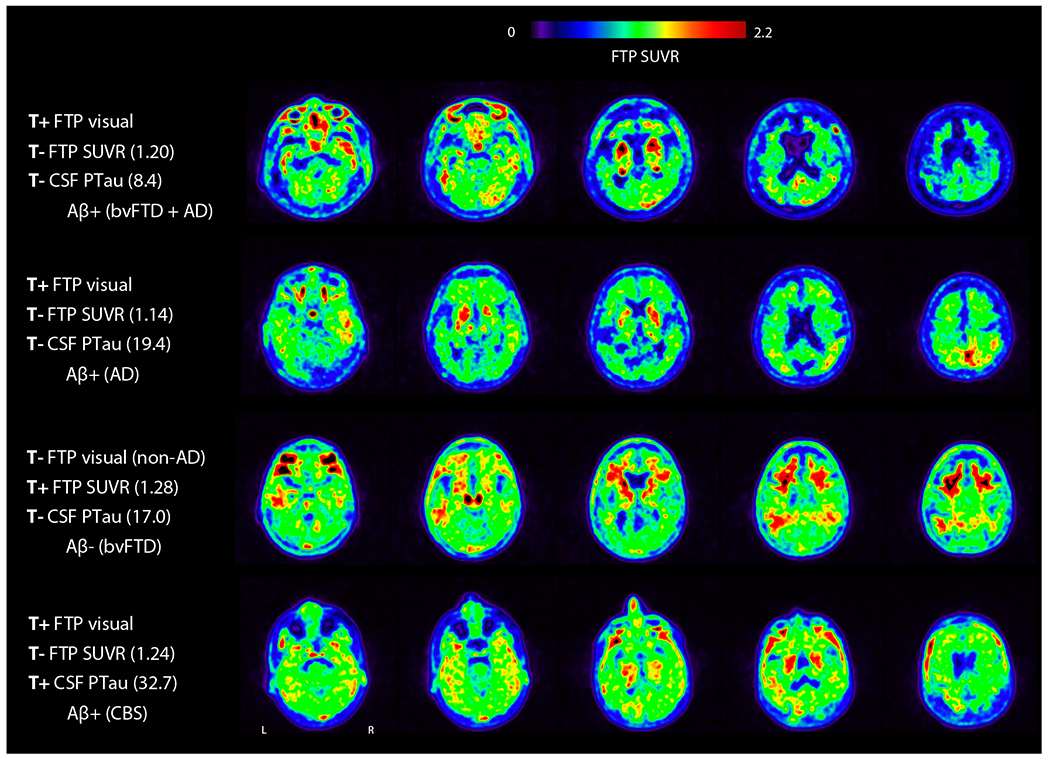
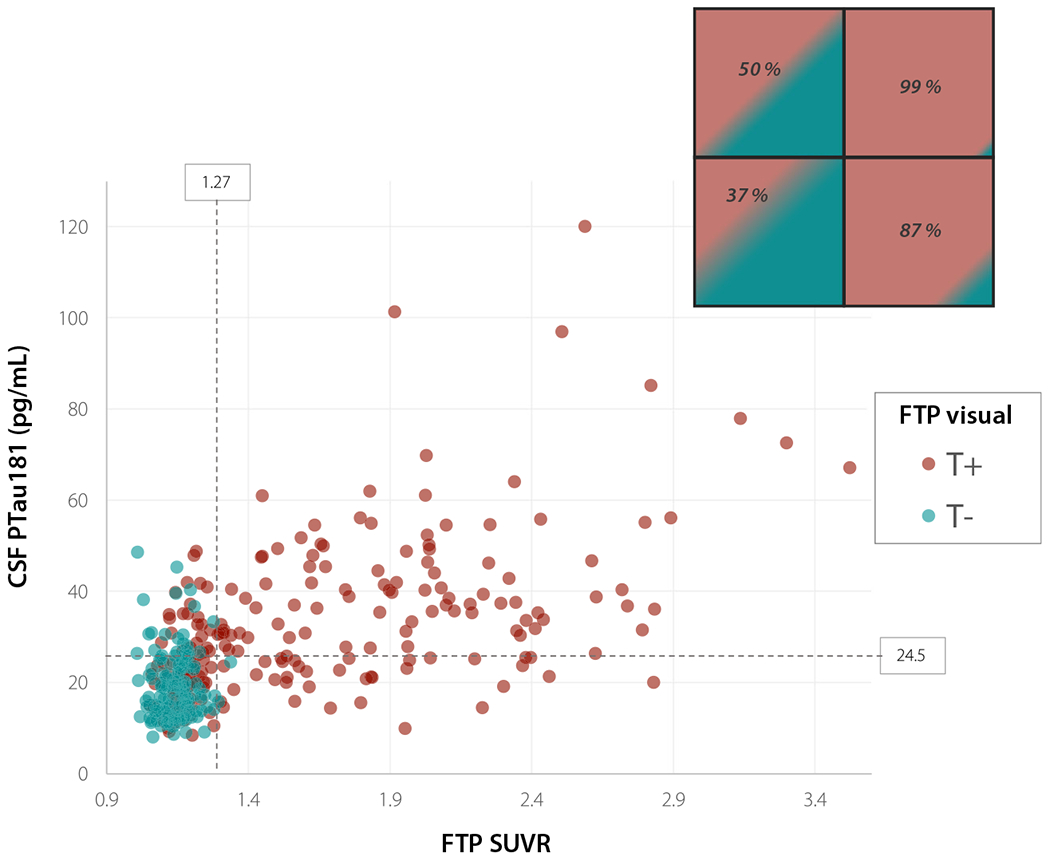
Methods: We included 351 subjects with varying clinical diagnoses from three cohorts with available FTP PET and CSF PTau181 within 18 months. T-status was derived from (1) FTP visual assessment by two blinded raters; (2) FTP standardized uptake value ratio (SUVR) quantification from a temporal meta-ROI (threshold: SUVR ≥1.27); and (3) Elecsys® Phospho-Tau (181P) CSF (Roche Diagnostics) concentrations (threshold: PTau181 ≥ 24.5 pg/mL).

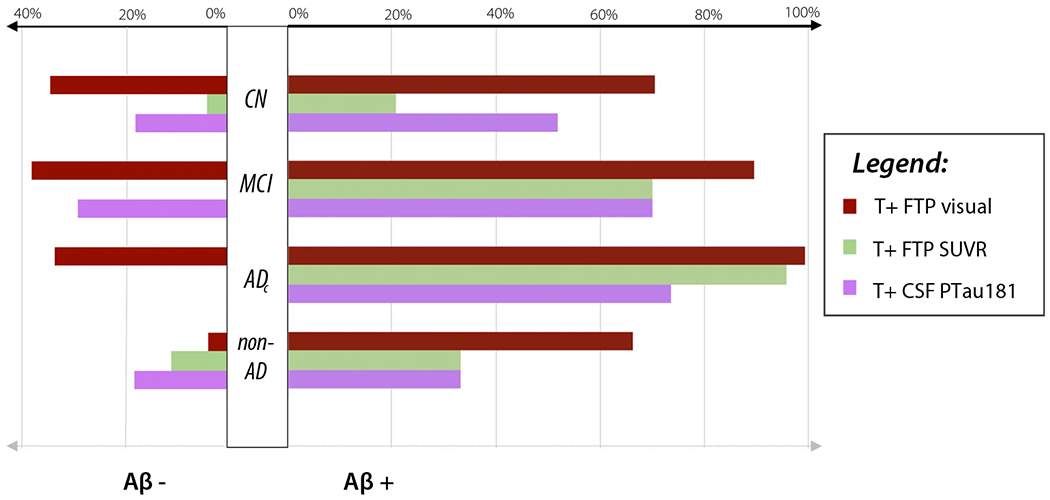
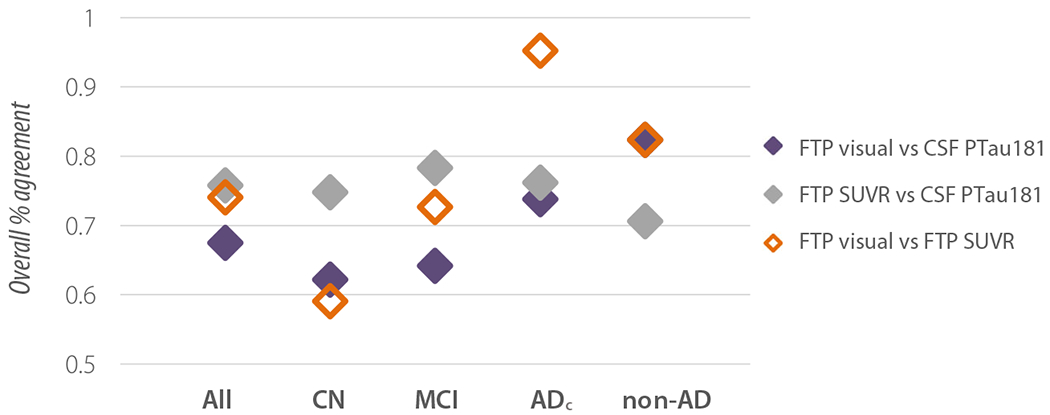
Results: FTP visual reads yielded the highest rates of T+, while T+ by SUVR increased progressively from cognitively normal (CN) through mild cognitive impairment (MCI) and AD dementia. T+ designation by CSF PTau181 was intermediate between FTP visual reads and SUVR values in CN, similar to SUVR in MCI, and lower in AD dementia. Concordance in T-status between modality pairs ranged from 68 to 76% and varied by clinical diagnosis, being highest in patients with AD dementia. In discriminating Aβ + MCI and AD subjects from healthy controls and non-AD participants, FTP visual assessment was most sensitive (0.96) but least specific (0.60). Specificity was highest with FTP SUVR (0.91) with sensitivity of 0.89. Sensitivity (0.73) and specificity (0.72) were balanced for PTau181.

Conclusion: The choice of tau biomarker may differ by disease stage and research goals that seek to maximize sensitivity or specificity. Visual interpretations of tau PET enhance sensitivity compared to quantification alone, particularly in early disease stages.

Keywords: Alzheimer’s disease; Biomarkers; CSF; Flortaucipir; PET; Tau.


Conflict of interest statement

Conflict of interest U.E. is an employee of Roche. O.H. has received research support (for the institution) from Roche, GE Healthcare, Biogen, AVID Radiopharmaceuticals, Fujirebio, and Euroimmun. In the past 2 years, he has received consultancy/speaker fees (paid to the institution) from Lilly, Roche, and Fujirebio. B.L.M. serves as Medical Director for the John Douglas French Foundation; Scientific Director for the Tau Consortium; Director/Medical Advisory Board of the Larry L. Hillblom Foundation; Scientific Advisory Board Member for the National Institute for Health Research Cambridge Biomedical Research Centre and its subunit, the Biomedical Research Unit in Dementia (UK); and Board Member for the American Brain Foundation. W.J. has served as a consultant to Genentech, Biogen, Bioclinica, CuraSen, and Grifols. G.D.R. receives research support from Avid Radiopharmaceuticals, GE Healthcare, and Life Molecular Imaging and has received consulting fees or speaking honoraria from Axon Neurosciences, Roche, Eisai, and Genentech. All other authors have no relevant financial or non-financial interests to disclose.

Figures

Fig. 1
Fig. 1
Rating scheme for visual assessment of FTP pattern of binding to define T-status. Normal pattern of binding and non-AD-like pattern (for example, mild-to-moderate signal in the frontal white matter) were assigned T-status. Classic AD-like pattern following Braak and Braak distribution extending beyond the temporal lobes, and mild temporal binding (confluent binding restricted to the temporal lobes) were assigned T+ status
Fig. 2
Fig. 2
Percentage of T+ by modality, clinical diagnosis, and amyloid status. CN, cognitively normal; MCI, mild cognitive impairment; ADc, Alzheimer’s disease dementia; non-AD, non-AD disorders
Fig. 3
Fig. 3
Examples of discordant T-status between FTP visual assessment, SUVR quantification, and CSF PTau181. Selected axial slices of FTP are shown. Amyloid status is based on PET. Clinical diagnosis is indicated in parentheses. bvFTD, behavioral variant frontotemporal dementia; CBS, corticobasal syndrome
Fig. 4
Fig. 4
Inter-modality overall percent agreement between modalities by clinical diagnosis. CN, cognitively normal; MCI, mild cognitive impairment; ADc, Alzheimer’s disease dementia; non-AD, non-AD disorders
Fig. 5
Fig. 5
Scatterplot of CSF PTau181 and FTP SUVR values in T+ and T− patients by FTP visual assessment. Dotted lines show threshold of positivity for CSF PTau181 and FTP temporal meta-ROI SUVR. Insert in the top right corner shows percentage of T+ cases by visual assessment for each quadrant of the scatterplot

References

    1. Lowe VJ, Curran G, Fang P, Liesinger AM, Josephs KA, Parisi JE, et al. An autoradiographic evaluation of AV-1451 tau PET in dementia. Acta Neuropathol Commun. 2016;4:58. 10.1186/s40478-016-0315-6. - DOI - PMC - PubMed
    1. Marquie M, Normandin MD, Vanderburg CR, Costantino IM, Bien EA, Rycyna LG, et al. Validating novel tau positron emission tomography tracer [F-18]-AV-1451 (T807) on postmortem brain tissue. Ann Neurol. 2015;78:787–800. 10.1002/ana.24517. - DOI - PMC - PubMed
    1. Scholl M, Maass A, Mattsson N, Ashton NJ, Blennow K, Zetterberg H, et al. Biomarkers for tau pathology. Mol Cell Neurosci. 2019;97:18–33. 10.1016/j.mcn.2018.12.001. - DOI - PMC - PubMed
    1. Olsson B, Lautner R, Andreasson U, Ohrfelt A, Portelius E, Bjerke M, et al. CSF and blood biomarkers forthe diagnosis of Alzheimer’s disease: a systematic review and meta-analysis. Lancet Neurol. 2016;15:673–84. 10.1016/S1474-4422(16)00070-3. - DOI - PubMed
    1. Cummings J The National Institute on Aging-Alzheimer’s association framework on Alzheimer’s disease: application to clinical trials. Alzheimers Dement. 2019;15:172–8. 10.1016/j.jalz.2018.05.006. - DOI - PMC - PubMed

Publication types

LinkOut - more resources