. 2021 May;30(5):1283-1292.
doi: 10.1007/s11136-020-02727-8. Epub 2021 Jan 5.

Response-shift effects in neuromyelitis optica spectrum disorder: estimating response-shift-adjusted scores using equating

Affiliations

Response-shift effects in neuromyelitis optica spectrum disorder: estimating response-shift-adjusted scores using equating

Carolyn E Schwartz et al. Qual Life Res. 2021 May.

Abstract

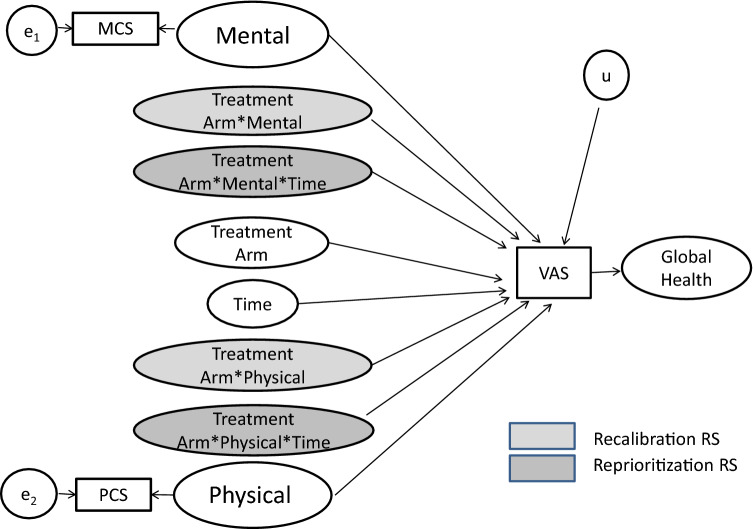
Background: In our companion paper, random intercept models (RIMs) investigated response-shift effects in a clinical trial comparing Eculizumab to Placebo for people with neuromyelitis optica spectrum disorder (NMOSD). RIMs predicted Global Health using the EQ-5D Visual Analogue Scale item (VAS) to encompass broad criteria that people might consider. The SF36™v2 mental and physical component scores (MCS and PCS) helped us detect response shift in VAS. Here, we sought to "back-translate" the VAS into the MCS/PCS scores that would have been observed if response shift had not been present.

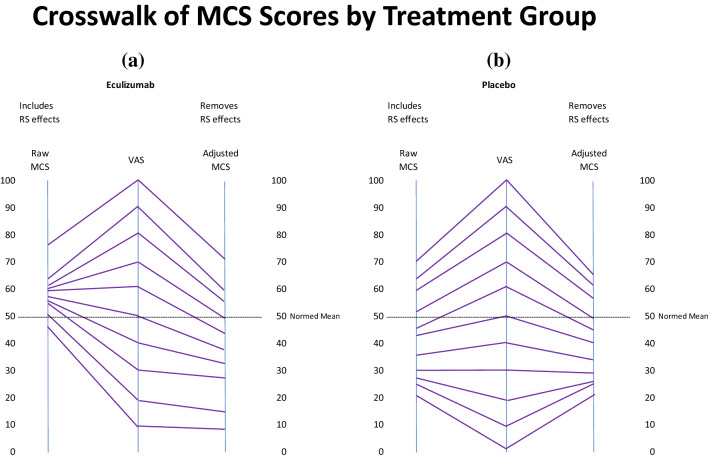
Methods: This secondary analysis utilized NMOSD clinical trial data evaluating the impact of Eculizumab in preventing relapses (n = 143). Analyses began by equating raw scores from the VAS, MCS, and PCS, and computing scores that removed response-shift effects. Correlation analysis and descriptive displays provided a more comprehensive examination of response-shift effects.

Results: MCS and PCS crosswalks with VAS equated the scores that include and exclude response-shift effects. These two sets of scores had low shared variance for MCS for both groups, suggesting that corresponding mental health constructs were substantially different. The shared variance contrast for physical health was distinct only for the Placebo group. The larger MCS response-shift effects were found at end of study for Placebo only and were more prominent at extremes of the MCS score distribution.

Conclusions: Our results reveal notable treatment group differences in MCS but not PCS response shifts, which can explain null results detected in previous work. The method introduced herein provides a way to provide further information about response-shift effects in clinical trial data.

Keywords: Clinical trial; Clinician-assessed outcome; Definitive neuromyelitis optica; Interpretation of change; Neurologic; Neuromyelitis optica spectrum disorder; Patient-reported outcome; Response shift.


Conflict of interest statement

All authors declare that they have no potential conflicts of interest and report no disclosures.

Figures

Fig. 1
Fig. 1
Conceptual model underlying response-shift analyses. Global Health was the latent variable of central focus in the analysis, and was operationalized as the EQ-5D VAS score. To capture how Treatment Arm group differentially emphasized physical and mental health overall and over time, recalibration was defined as a significant MCS (or PCS) * group interaction in predicting VAS (lightest grey shading); and reprioritization was defined as a significant MCS (or PCS) * group * time interaction predicting VAS (darker grey shading)
Fig. 2
Fig. 2
Pie chart illustrating how VAS scores without (a) and with (b) response-shift (RS) effects are estimated. We sought to compare VAS scores with and without response-shift effects in the model. Accordingly, we wanted to estimate a VAS score that removed variance related to recalibration and reprioritization response shifts (i.e., group-by-MCS [or PCS] and group-by-MCS [or PCS]-by-time). This figure shows the logic using two pie charts, not drawn to scale, of the variance components in the random intercept models. In order to obtain the desired score, we estimated VAS in two ways: with response-shift terms in the model (the full model as shown in a) and without (as shown in b). In the model without response shift terms, what would be in the response shift terms is left in the error variance (b). In the model with response shift terms, response shift is removed from the error variance (a). In order to obtain VAS scores with and without response-shift effects—the score that would be as if there were no response shift—we took the predicted score without response shift and added in the error term from the full model (i.e., the error term without response shift)
Fig. 3
Fig. 3
Crosswalk between VAS and MCS scores, including and excluding response-shift effects by Treatment Group. This graphic presentation of the crosswalk between the VAS and the MCS scores illustrates how response-shift effects may alter the apparent treatment group differences in the clinical trial data. The left-most crosswalk shows the linkage for the Eculizumab patients (a), showing that the MCS scores that include response-shift effects (on the left) have a more truncated range and are higher than the population norm compared to those that exclude response-shift effects (on the right). The right-most crosswalk shows the linkage for Placebo patients (b), exhibiting a similar range and similar linked scores for MCS scores that include and exclude response-shift effects
Fig. 4
Fig. 4
Crosswalk between VAS and PCS scores, including and excluding response-shift effects by Treatment Group. This graphic presentation of the crosswalk between the VAS and the PCS scores illustrate a similar pattern to the MCS crosswalk. Eculizumab patients (a) show a more truncated distribution for the Eculizumab group’s scores that include response-shift effects. In contrast to this group’s MCS scores, the PCS scores that include response-shift effects reflect worse physical functioning compared to population norms. The Placebo group’s crosswalk (b) exhibits a similar range and similar linked scores for PCS scores that include and exclude response-shift effects
Fig. 5
Fig. 5
Bar chart showing magnitude of response-shift effects in MCS scores. Bar charts illustrate MCS scores excluding response-shift effects at baseline versus end of study for Eculizumab (a) and Placebo (b) patients. This plot illustrates that the larger MCS response-shift effects were found at end of study for Placebo as compared to Eculizumab, and the effects are more prominent at extreme ends of the spectrum (i.e., very low and very high MCS scores). For the Eculizumab patients, response-shift effects are smaller at end of study than at baseline almost at every level of MCS raw scores
Fig. 6
Fig. 6
Bar chart showing magnitude of response-shift effects in PCS scores. Bar charts illustrate PCS scores excluding response-shift effects at baseline versus end of study for Eculizumab (a) and Placebo (b) patients. Overall, the response-shift effects for PCS were smaller across groups than for MCS, and the larger effects were for high PCS scores for the Placebo patients at baseline. For the Eculizumab patients, the largest response-shift effects were at extreme low PCS scores at end of study

Similar articles

Cited by

References

    1. Wilson IB. Clinical understanding and clinical implications of response shift. Social Science and Medicine. 1999;48(11):1577–1588. doi: 10.1016/S0277-9536(99)00050-7. - DOI - PubMed
    1. Schwartz CE, Ahmed S, Sawatsky R, Sajobi T, Mayo N, Finkelstein JA, Lix L, Verdam MGE, Oort FJ, Sprangers MAG. Guidelines for secondary analysis in search of response shift. Quality of Life Research. 2013;22:2663–2673. doi: 10.1007/s11136-013-0402-0. - DOI - PubMed
    1. Schwartz CE, Bode R, Repucci N, Becker J, Sprangers MAG, Fayers PM. The clinical significance of adaptation to changing health: A meta-analysis of response shift. Quality of Life Research. 2006;15:1533–1550. doi: 10.1007/s11136-006-0025-9. - DOI - PubMed
    1. Sajobi TT, Brahmbatt R, Lix LM, Zumbo BD, Sawatzky R. Scoping review of response shift methods: Current reporting practices and recommendations. Quality of Life Research. 2018;27(5):1133–1146. doi: 10.1007/s11136-017-1751-x. - DOI - PubMed
    1. Sprangers MAG, Schwartz CE. Integrating response shift into health-related quality of life research: A theoretical model. Social Science and Medicine. 1999;48(11):1507–1515. doi: 10.1016/S0277-9536(99)00045-3. - DOI - PubMed

LinkOut - more resources