. 2021 Feb;6(1):100005.
doi: 10.1016/j.esmoop.2020.100005. Epub 2020 Nov 27.

Longitudinal characterisation of haematological and biochemical parameters in cancer patients prior to and during COVID-19 reveals features associated with outcome

Affiliations

Longitudinal characterisation of haematological and biochemical parameters in cancer patients prior to and during COVID-19 reveals features associated with outcome

R J Lee et al. ESMO Open. 2021 Feb.

Erratum in

Abstract

Background: Cancer patients are at increased risk of death from severe acute respiratory syndrome coronavirus 2 (SARS-CoV-2). Cancer and its treatment affect many haematological and biochemical parameters, therefore we analysed these prior to and during coronavirus disease 2019 (COVID-19) and correlated them with outcome.

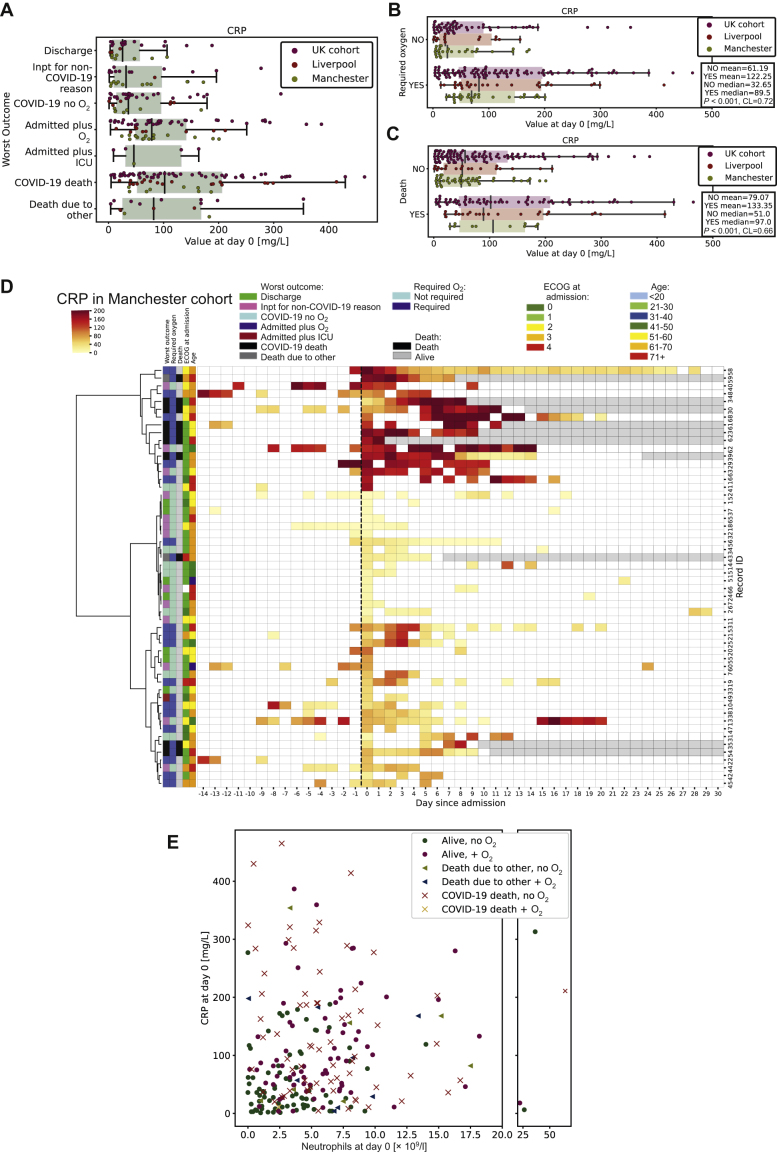
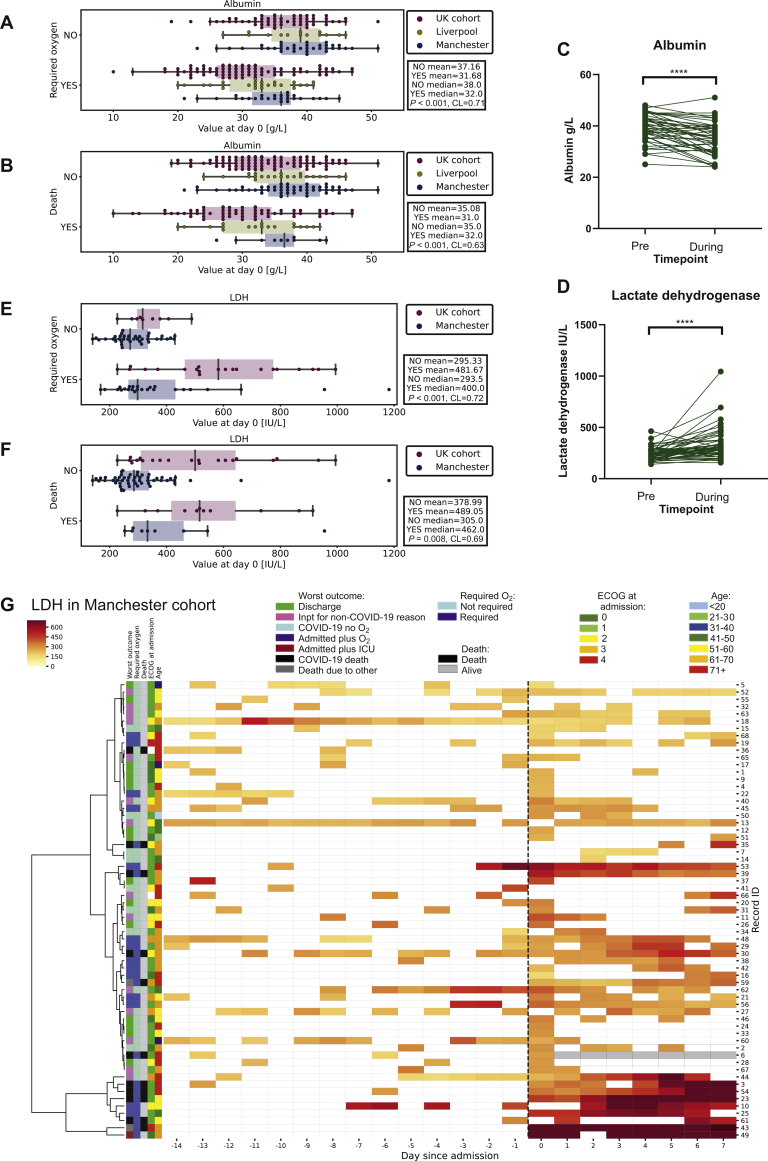
Patients and methods: Consecutive patients with cancer testing positive for SARS-CoV-2 in centres throughout the United Kingdom were identified and entered into a database following local governance approval. Clinical and longitudinal laboratory data were extracted from patient records. Data were analysed using Mann-Whitney U test, Fisher's exact test, Wilcoxon signed rank test, logistic regression, or linear regression for outcomes. Hierarchical clustering of heatmaps was performed using Ward's method.

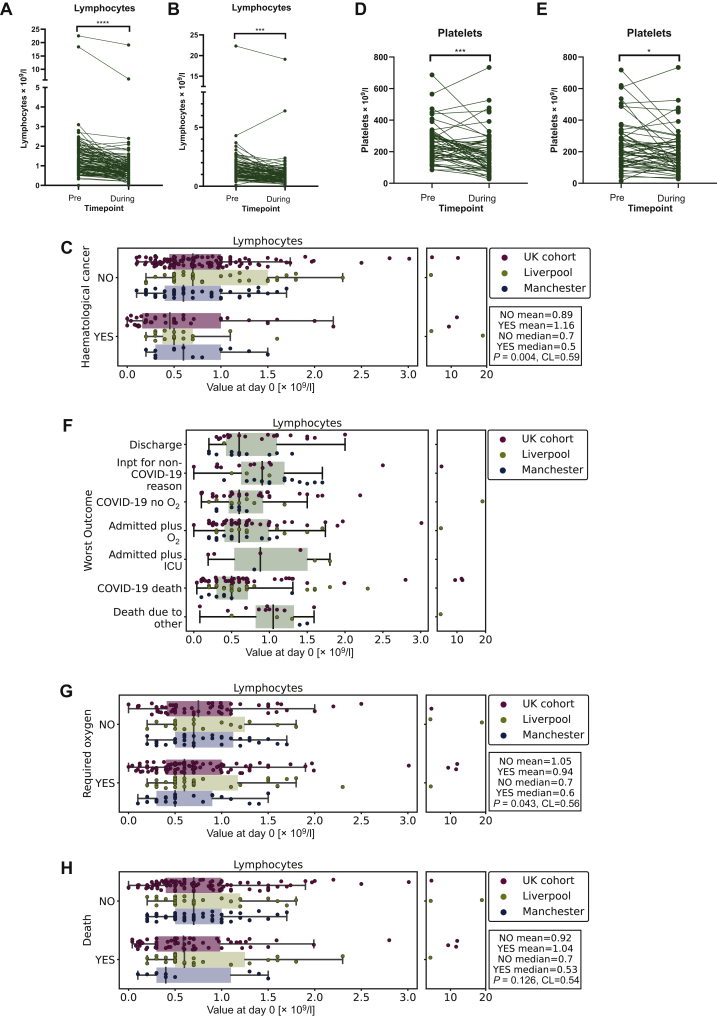
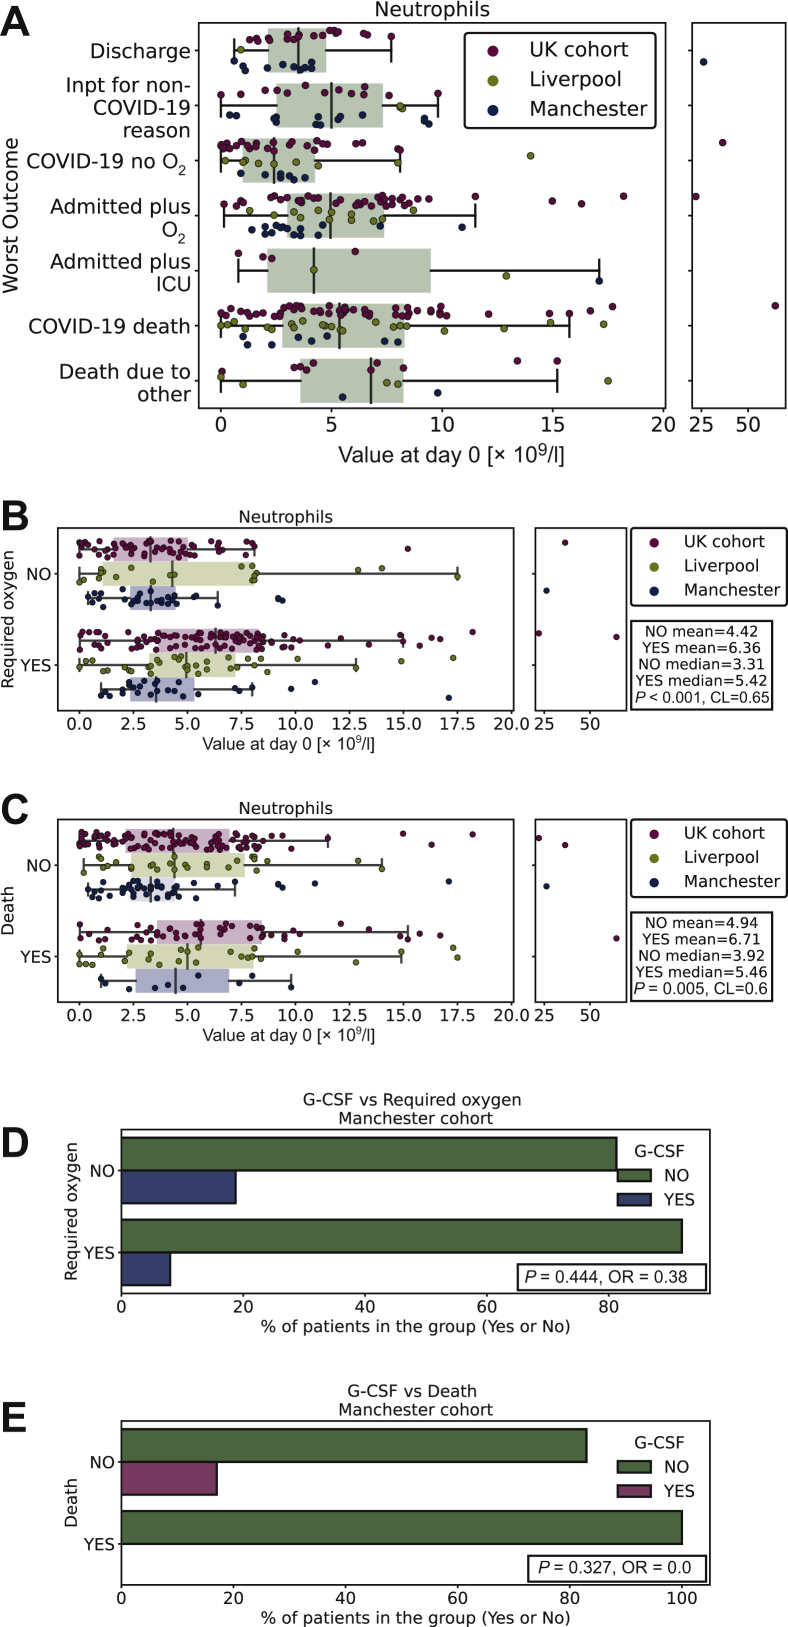
Results: In total, 302 patients were included in three cohorts: Manchester (n = 67), Liverpool (n = 62), and UK (n = 173). In the entire cohort (N = 302), median age was 69 (range 19-93 years), including 163 males and 139 females; of these, 216 were diagnosed with a solid tumour and 86 with a haematological cancer. Preinfection lymphopaenia, neutropaenia and lactate dehydrogenase (LDH) were not associated with oxygen requirement (O2) or death. Lymphocyte count (P < 0.001), platelet count (P = 0.03), LDH (P < 0.0001) and albumin (P < 0.0001) significantly changed from preinfection to during infection. High rather than low neutrophils at day 0 (P = 0.007), higher maximal neutrophils during COVID-19 (P = 0.026) and higher neutrophil-to-lymphocyte ratio (NLR; P = 0.01) were associated with death. In multivariable analysis, age (P = 0.002), haematological cancer (P = 0.034), C-reactive protein (P = 0.004), NLR (P = 0.036) and albumin (P = 0.02) at day 0 were significant predictors of death. In the Manchester/Liverpool cohort 30 patients have restarted therapy following COVID-19, with no additional complications requiring readmission.

Conclusion: Preinfection biochemical/haematological parameters were not associated with worse outcome in cancer patients. Restarting treatment following COVID-19 was not associated with additional complications. Neutropaenia due to cancer/treatment is not associated with COVID-19 mortality. Cancer therapy, particularly in patients with solid tumours, need not be delayed or omitted due to concerns that treatment itself increases COVID-19 severity.

Keywords: COVID-19; SARS-CoV-2; cancer.


Conflict of interest statement

Disclosure RJL speaker fees BMS and Astrazeneca, MR honoraria from Astellas Pharma, speaker fees MSD and Servier. CW consultancy and speaker fees Pfizer, Amgen, Novartis, AA conference fee Merck, spouse shares in Astrazeneca. TR financial support to attend educational workshops from Amgen and Daiichi-Sankyo. JT is now working at Astra Zeneca. CD, outside of this scope of work, has received research funding from AstraZeneca, Astex Pharmaceuticals, Bioven, Amgen, Carrick Therapeutics, Merck AG, Taiho Oncology, Clearbridge Biomedics, Angle PLC, Menarini Diagnostics, GSK, Bayer, Boehringer Ingelheim, Roche, BMS, Novartis, Celgene, Thermofisher. CD is on advisory boards for, and has received consultancy fees/honoraria from, AstraZeneca, Biocartis and Merck KGaA. The remaining authors have no conflicts of interest to declare.

Figures

Figure 1
Figure 1
Longitudinal changes in lymphocytes and platelets. (A) CHRONIC lymphocyte counts (day −170 to day −15) preinfection versus 7 days during infection in the Manchester cohort (∗∗∗∗P < 0.0001). (B) Lymphocyte count IMMED (last test pre-infection) versus 7 days during infection in the Manchester cohort (∗∗∗P < 0.001). (C) Boxplot of day 0 lymphocyte count (total cohort) grouped by diagnosis of haematological malignancy. (D) CHRONIC platelet counts preinfection versus 7 days during infection in the Manchester cohort (∗∗∗P = 0.0008). (E) Platelet count IMMED preinfection versus 7 days during infection in the Manchester cohort (∗P = 0.03). (F) Boxplot of lymphocyte count according to worst outcome in the entire cohort measured at day 0. Discharge, discharged within 24 hours; Inpt for non-COVID-19 reason, inpatient due to reason other than COVID-19 and outcome not altered by infection; COVID-19 no O2, admitted due to COVID-19 infection but did not require oxygen; admitted plus O2, admitted due to COVID-19 and required oxygen; admitted plus ICU, admitted due to COVID-19 and required intensive care; COVID-19 death, death due to other. (G) Boxplot of lymphocyte count grouped by oxygen requirement in the entire cohort measured at day 0. (H) Boxplot of lymphocyte count grouped by whether patient died in the entire cohort measured at day 0. COVID-19, coronavirus disease 2019; ICU, intensive care unit.
Figure 2
Figure 2
Longitudinal changes in neutrophils. (A) Boxplot of neutrophil count according to worst outcome in the entire cohort measured at day 0. Discharge, discharged within 24 hours; Inpt for non-COVID-19 reason, inpatient due to reason other than COVID-19 and outcome not altered by infection; COVID-19 no O2, admitted due to COVID-19 infection but did not require oxygen; admitted plus O2, admitted due to COVID-19 and required oxygen; admitted plus ICU, admitted due to COVID-19 and required intensive care; COVID-19 death, death due to other. (B) Boxplot of neutrophil count grouped by oxygen requirement in the entire cohort measured at day 0. (C) Boxplot of neutrophil count grouped by death in the entire cohort measured at day 0. (D) Boxplot of whether the given G-CSF grouped by oxygen requirement in the Manchester cohort measured at day 0. (E) Boxplot of whether the given G-CSF grouped by death in the Manchester cohort measured at day 0. COVID-19, coronavirus disease 2019; G-CSF, granulocyte colony-stimulating factor; ICU, intensive care unit.
Figure 3
Figure 3
Longitudinal changes in C-reactive protein. (A) Boxplot of CRP according to worst outcome in the entire cohort measured at day 0. Discharge, discharged within 24 hours; Inpt for non-COVID-19 reason, inpatient due to reason other than COVID-19 and outcome not altered by infection; COVID-19 no O2, admitted due to COVID-19 infection but did not require oxygen; admitted plus O2, admitted due to COVID-19 and required oxygen; admitted plus ICU, admitted due to COVID-19 and required intensive care; COVID-19 death, death due to other. (B) Boxplot of CRP grouped by oxygen requirement in the entire cohort measured at day 0. (C) Boxplot of CRP grouped by whether patient died in the entire cohort measured at day 0. (D) Heatmap of the CRP level (darker red = higher CRP) against time (pre/post SARS-CoV-2-positive PCR test). Each patient record is represented by a row and each column by a timepoint. Hierarchical clustering is based on values from day 0 to 7. (E) Scatter graph of CRP versus neutrophil count measured at day 0 in the entire cohort. Blue, required oxygen; red, did not require oxygen; triangle, died from non-COVID-19 cause; cross, died due to COVID-19. COVID-19, coronavirus disease 2019; CRP, C-reactive protein; ECOG, Eastern Cooperative Oncology Group; ICU, intensive care unit; SARS-CoV, severe acute respiratory syndrome coronavirus 2.
Figure 4
Figure 4
Longitudinal changes in albumin and LDH. (A) Boxplot of albumin grouped by oxygen requirement in the entire cohort measured at day 0. (B) Boxplot of albumin grouped by whether patient died in the entire cohort measured at day 0. (C) Albumin IMMED (last test preinfection) versus 7 days during infection in the Manchester cohort (∗∗∗∗P < 0.0001). (D) LDH IMMED (last test preinfection) versus 7 days during infection in the Manchester cohort (∗∗∗∗P < 0.0001). (E) Boxplot of LDH grouped by oxygen requirement in the Manchester and UK cohorts measured at day 0. (F) Boxplot of LDH grouped by whether patient died in the Manchester and UK cohorts measured at day 0. (G) Heatmap of the LDH level (darker red = higher LDH) against time (pre/post SARS-CoV-2-positive PCR test). Each patient record is represented by a row and each column a timepoint. Hierarchical clustering is based on values from day 0 to 7. LDH, lactate dehydrogenase; SARS-CoV-2, severe acute respiratory syndrome coronavirus 2.

References

    1. Guan W., Ni Z., Hu Y. Clinical characteristics of coronavirus disease 2019 in China. N Engl J Med. 2020;382(18):1708–1720. - PMC - PubMed
    1. Liang W., Guan W., Chen R. Cancer patients in SARS-CoV-2 infection: a nationwide analysis in China. Lancet Oncol. 2020;21:335–337. - PMC - PubMed
    1. Mehta V., Goel S., Kabarriti R. Case fatality rate of cancer patients with COVID-19 in a New York Hospital System. Cancer Discov. 2020;10(7):935–976. - PMC - PubMed
    1. Lee L.Y.W., Cazier J.B., Starkey T., Turnbull C.D., Kerr R., Middleton G. COVID-19 mortality in patients with cancer on chemotherapy or other anticancer treatments: a prospective cohort study. Lancet. 2020;395:1919–1926. - PMC - PubMed
    1. Kuderer N.M., Choueiri T.K., Shah D.P. Clinical impact of COVID-19 on patients with cancer (CCC19): a cohort study. Lancet. 2020;395:1907–1918. - PMC - PubMed

Publication types

MeSH terms