

Identification and analysis of circRNA-miRNA-mRNA regulatory network in hepatocellular carcinoma
- PMID: 33399102
- PMCID: PMC8687197
- DOI: 10.1049/iet-syb.2020.0061
Identification and analysis of circRNA-miRNA-mRNA regulatory network in hepatocellular carcinoma
Abstract
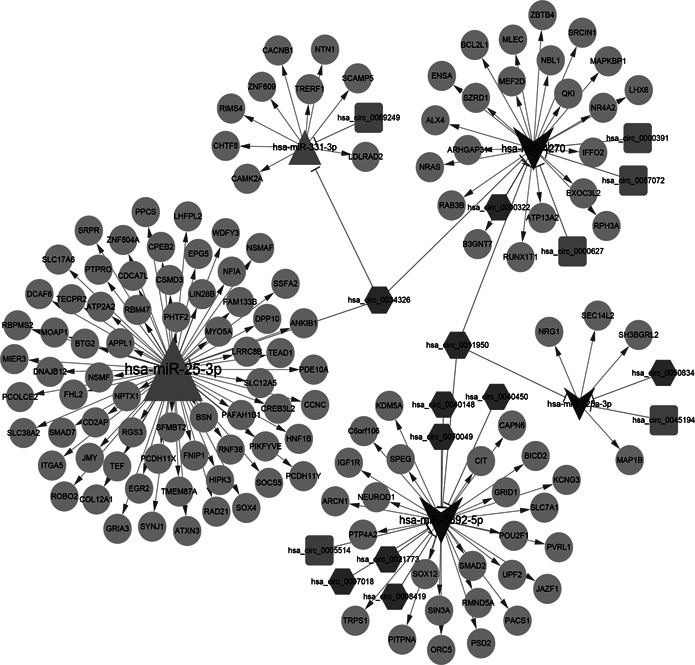
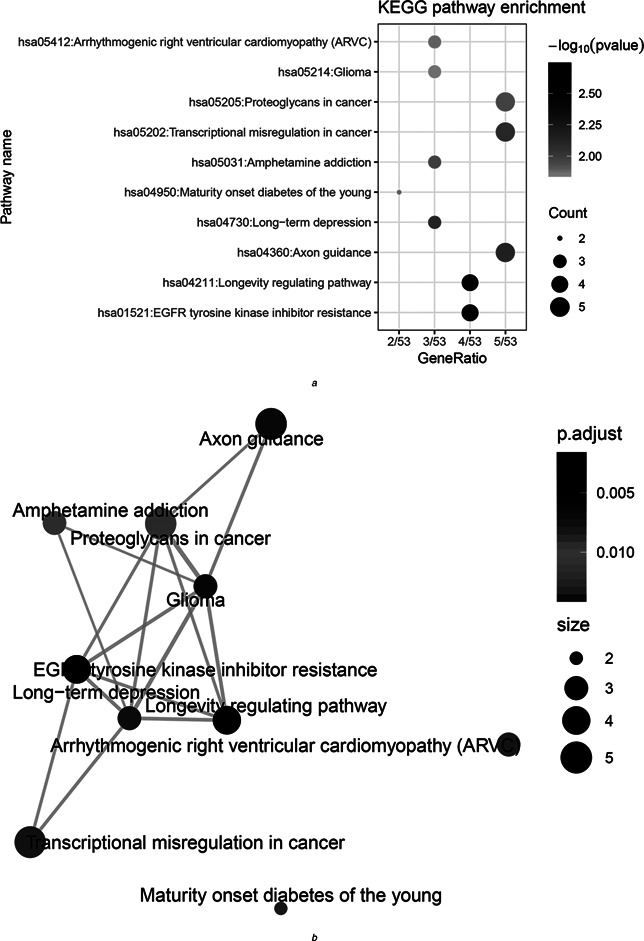
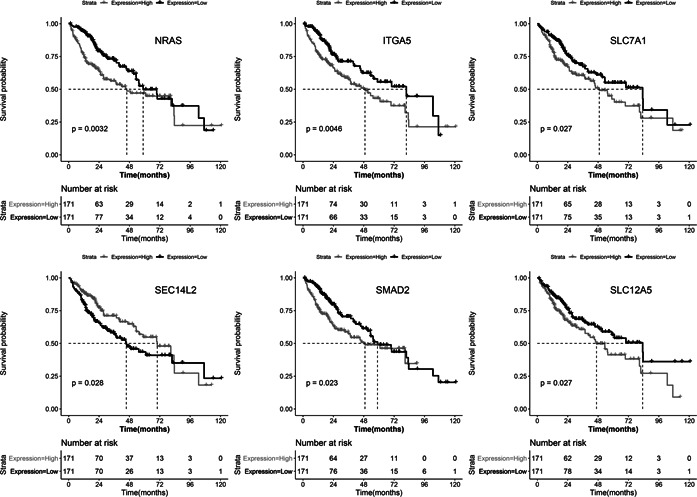
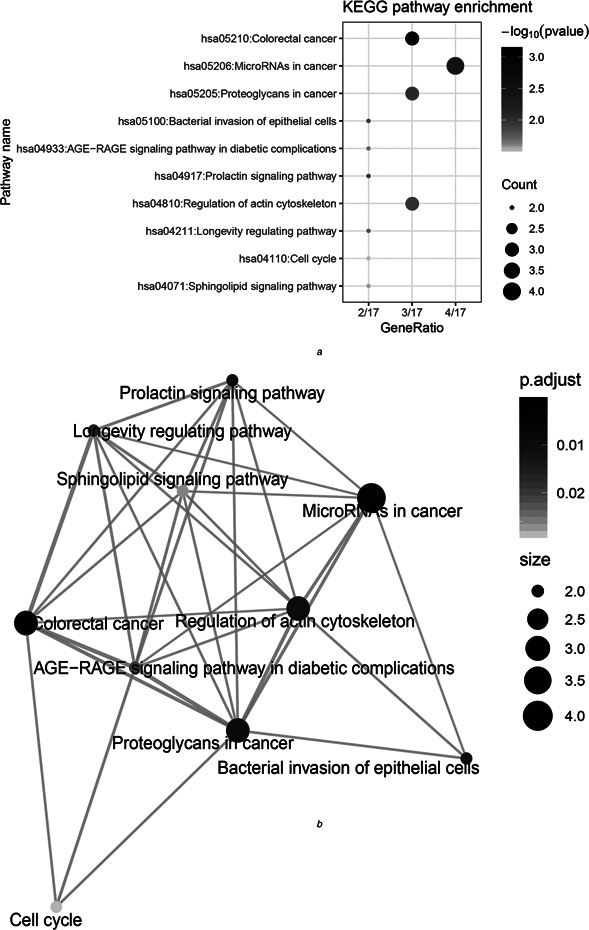
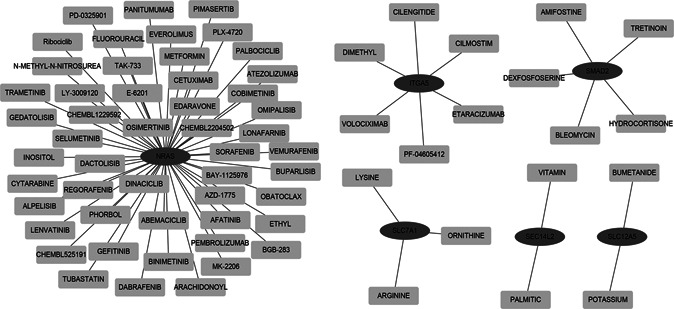
This study was to identify important circRNA-miRNA-mRNA (ceRNAs) regulatory mechanisms in hepatocellular carcinoma (HCC). The circRNA dataset GSE97332 and miRNA dataset GSE57555 were used for analyses. Functional enrichment analysis for miRNA and target gene was conducted using cluster Profiler. Survival analysis was conducted through R package Survival. The ceRNAs and drug-gene interaction networks were constructed. The ceRNAs network contained five miRNAs including hsa-miR-25-3p, hsa-miR-3692-5p, hsa-miR-4270, hsa-miR-331-3p, and hsa-miR-125a-3p. Among the network, hsa-miR-25-3p targeted the most genes, hsa-miR-3692-5p and hsa-miR-4270 were targeted by more circRNAs than other miRNAs, hsa-circ-0034326 and hsa-circ-0011950 interacted with three miRNAs. Furthermore, target genes, including NRAS, ITGA5, SLC7A1, SEC14L2, SLC12A5, and SMAD2 were obtained in drug-gene interaction network. Survival analysis showed NRAS, ITGA5, SLC7A1, SEC14L2, SLC12A5, and SMAD2 were significantly associated with prognosis of HCC. NRAS, ITGA5, and SMAD2 were significantly enriched in proteoglycans in cancer. Moreover, hsa-circ-0034326 and hsa-circ-0011950 might function as ceRNAs to play key roles in HCC. Furthermore, miR-25-3p, miR-3692-5p, and miR-4270 might be significant for HCC development. NRAS, ITGA5, SEC14L2, SLC12A5, and SMAD2 might be prognostic factors for HCC patients via proteoglycans in cancer pathway. Taken together, the findings will provide novel insight into pathogenesis, selection of therapeutic targets and prognostic factors for HCC.
Figures
Similar articles
-
Identification of potentially functional circular RNAs hsa_circ_0070934 and hsa_circ_0004315 as prognostic factors of hepatocellular carcinoma by integrated bioinformatics analysis.Sci Rep. 2022 Mar 23;12(1):4933. doi: 10.1038/s41598-022-08867-w. Sci Rep. 2022. PMID: 35322101 Free PMC article.
-
A circRNA-miRNA-mRNA network identification for exploring underlying pathogenesis and therapy strategy of hepatocellular carcinoma.J Transl Med. 2018 Aug 9;16(1):220. doi: 10.1186/s12967-018-1593-5. J Transl Med. 2018. PMID: 30092792 Free PMC article.
-
Identification of Potentially Functional CircRNA-miRNA-mRNA Regulatory Network in Hepatocellular Carcinoma by Integrated Microarray Analysis.Med Sci Monit Basic Res. 2018 Apr 30;24:70-78. doi: 10.12659/MSMBR.909737. Med Sci Monit Basic Res. 2018. PMID: 29706616 Free PMC article.
-
The role of circular RNAs in the development of hepatocellular carcinoma.Pathol Res Pract. 2021 Jul;223:153495. doi: 10.1016/j.prp.2021.153495. Epub 2021 May 24. Pathol Res Pract. 2021. PMID: 34051512 Review.
-
Role of circular RNA/miRNA axes in the pathophysiology of polycystic ovary syndrome.Mol Biol Rep. 2024 Mar 23;51(1):437. doi: 10.1007/s11033-024-09376-x. Mol Biol Rep. 2024. PMID: 38520572 Review.
Cited by
-
Construction and analysis of expression profile of exosomal lncRNAs in pleural effusion in lung adenocarcinoma.J Clin Lab Anal. 2022 Dec;36(12):e24777. doi: 10.1002/jcla.24777. Epub 2022 Nov 25. J Clin Lab Anal. 2022. PMID: 36426920 Free PMC article.
-
Current Molecular Biology and Therapeutic Strategy Status and Prospects for circRNAs in HBV-Associated Hepatocellular Carcinoma.Front Oncol. 2021 Jul 2;11:697747. doi: 10.3389/fonc.2021.697747. eCollection 2021. Front Oncol. 2021. PMID: 34277444 Free PMC article. Review.
-
The circRNA circSIAE Inhibits Replication of Coxsackie Virus B3 by Targeting miR-331-3p and Thousand and One Amino-Acid Kinase 2.Front Cell Infect Microbiol. 2022 Jan 24;11:779919. doi: 10.3389/fcimb.2021.779919. eCollection 2021. Front Cell Infect Microbiol. 2022. PMID: 35141166 Free PMC article.
-
A novel upregulated hsa_circ_0032746 regulates the oncogenesis of esophageal squamous cell carcinoma by regulating miR-4270/MCM3 axis.Hum Genomics. 2024 Jan 10;18(1):3. doi: 10.1186/s40246-023-00564-7. Hum Genomics. 2024. PMID: 38200573 Free PMC article.
-
CircUSP10 promotes liver cancer progression by regulating miR-211-5p/TCF12/EMT signaling pathway.Heliyon. 2023 Oct 4;9(10):e20649. doi: 10.1016/j.heliyon.2023.e20649. eCollection 2023 Oct. Heliyon. 2023. PMID: 37829805 Free PMC article.
References
-
- Miller K.D. Nogueira L. Mariotto A.B. et al.: ‘Cancer treatment and survivorship statistics, 2019 ’, CA Cancer J. Clin., 2019, 69, (5 ), pp. 363 –385 - PubMed
MeSH terms
Substances
LinkOut - more resources
Full Text Sources
Medical
Miscellaneous
