

Modulation of plant root growth by nitrogen source-defined regulation of polar auxin transport
- PMID: 33399250
- PMCID: PMC7849315
- DOI: 10.15252/embj.2020106862
Modulation of plant root growth by nitrogen source-defined regulation of polar auxin transport
Abstract
Availability of the essential macronutrient nitrogen in soil plays a critical role in plant growth, development, and impacts agricultural productivity. Plants have evolved different strategies for sensing and responding to heterogeneous nitrogen distribution. Modulation of root system architecture, including primary root growth and branching, is among the most essential plant adaptions to ensure adequate nitrogen acquisition. However, the immediate molecular pathways coordinating the adjustment of root growth in response to distinct nitrogen sources, such as nitrate or ammonium, are poorly understood. Here, we show that growth as manifested by cell division and elongation is synchronized by coordinated auxin flux between two adjacent outer tissue layers of the root. This coordination is achieved by nitrate-dependent dephosphorylation of the PIN2 auxin efflux carrier at a previously uncharacterized phosphorylation site, leading to subsequent PIN2 lateralization and thereby regulating auxin flow between adjacent tissues. A dynamic computer model based on our experimental data successfully recapitulates experimental observations. Our study provides mechanistic insights broadening our understanding of root growth mechanisms in dynamic environments.
Keywords: auxin transport; nutrients; post-translational modification; protein trafficking; root development.
© 2021 The Authors. Published under the terms of the CC BY 4.0 license.
Conflict of interest statement
The authors declare that they have no conflict of interest.
Figures
- A
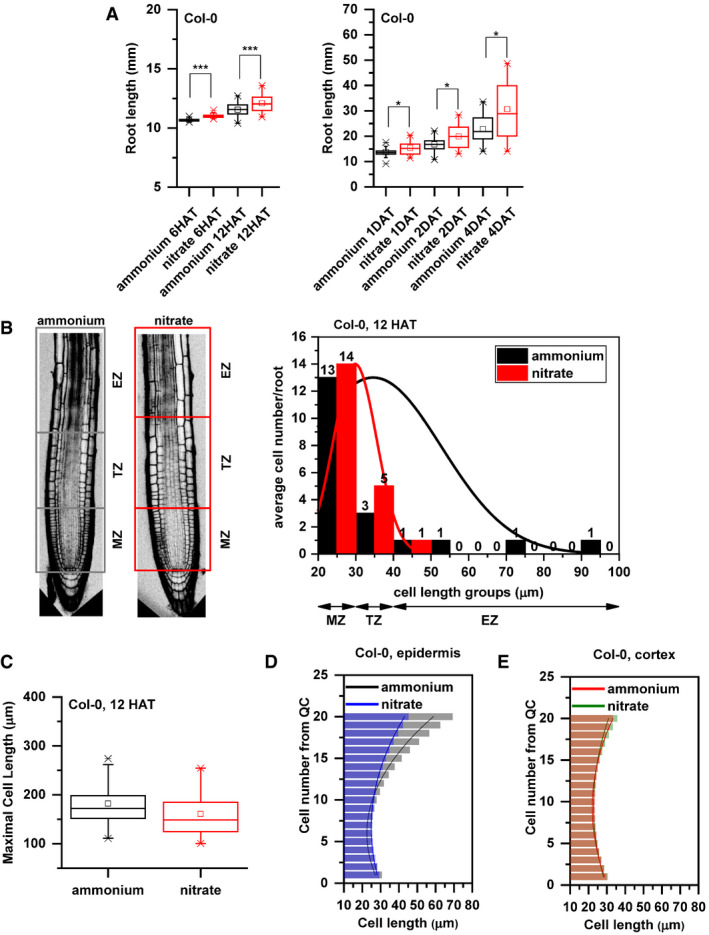
Primary root length (mm) of Col‐0 seedlings 6 and 12 HAT and 1, 2, and 4 days after transfer (DAT) to ammonium (black) or nitrate (red) supplemented medium. At least 34 roots were measured per time point per treatment. The statistical significance was evaluated with ANOVA at P < 0.05 (*) and P < 0.001 (***). The box chart components are defined as, box (25–75%), central band (median line), and central box (mean), and the range is within 1.5IQR.
- B
On the left, schematic representation of distinct root zones: Meristematic Zone (MZ), Transition Zone (TZ, which is interpolated between the apical meristem and the subapical elongation zone), and Elongation Zone (EZ). Boxes highlight the borders of the specified root zones (gray box for ammonium and red for nitrate). On the right, Col‐0 epidermal cells length was measured along the root tip (from QC), grouped based on their cell length (x axis) and were plotted against the average cell number per group per root (y axis) in both conditions (ammonium, black and nitrate, red). Note the higher cell number in case of nitrate (red) in the group (30–40 µm, representing TZ). Data are derived from 3 biological replicates, and total number of analyzed roots is n = 18 in each case.
- C
Maximal cell length (measured at the end of the elongation zone) of Col‐0 roots 12 HAT either to ammonium (black) or nitrate (red). 13 roots per treatment, 3 cells per root were analyzed. The box chart components are defined as, box (25–75%), central band (median line), and central box (mean), and the range is within 1.5IQR.
- D, E
Comparison of cell length measurements along epidermis (D) and cortex (E) upon ammonium (black and red) and nitrate (blue and green) treatments. Column bars denote the geometric mean of cell length at the respective positions. Lines represent a polynomial regression fit. Data are derived from 3 biological replicates, and total number of analyzed roots is n = 18 in each case.
- A
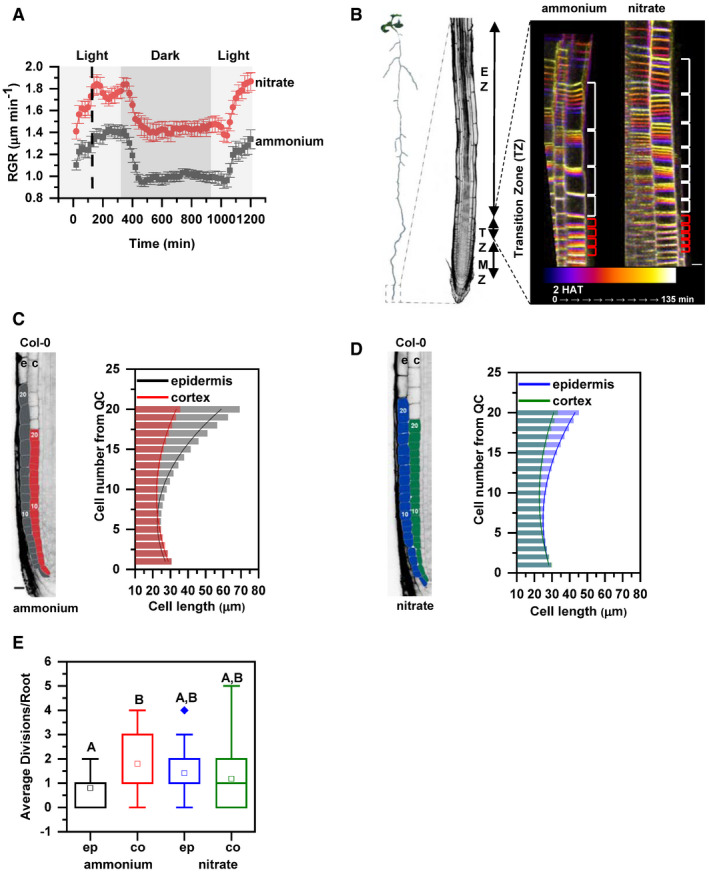
Seedlings were transferred 5 days after germination (DAG) to medium supplemented with ammonium (gray) or nitrate (red). Root growth rates (RGR in µm/min) were monitored over a 1,200 min period. Data represent the geometric mean (± standard error, SE) of 3 biological replicates, n = 5 (ammonium) and 6 (nitrate) roots. Light and dark periods are indicated as light or dark gray background, respectively.
- B
On the left, schematic representation of distinct root zones: Meristematic Zone (MZ), Transition Zone (TZ) and Elongation Zone (EZ). On the right, time‐lapse imaging of cell growth at the TZ. Cells were visualized using the plasma membrane marker (wave line W131Y). Observation of roots started 2 h after transfer (2 HAT; blue) on ammonium or on nitrate for 135 min (white) and images were recorded every 20 min (9 stacks/root/recording). Red and white brackets indicate the length of meristematic and elongating cells at the last measurement point, respectively. Scale bar = 30 µm.
- C, D
Representation and quantification of cell length in epidermal (e) and cortical (c) cell files. Optical, longitudinal sections of 5 DAG old Col‐0 roots 12 HAT to ammonium (C) or nitrate (D) supplemented media. The first 20 epidermal (e) and cortex (c) cells (from quiescent center (QC)) are highlighted in gray and in red on ammonium (C), and in blue and green on nitrate (D), respectively. Scale bar = 30 µm. Column bars denote the geometric mean of the cell lengths at the respective positions. Lines represent a polynomial regression fit, with calculated slopes between cells 10 and 20 of 3.32639 ± 0.17172 (ammonium, epidermis), 1.22033 ± 0.08754 (ammonium, cortex) and 1.70502 ± 0.09532 (nitrate, epidermis), 0.82342 ± 0.06973 (nitrate, cortex). Data are derived from 3 biological replicates, n = 18 roots in each case.
- E
Graphical representation of the average number of cell divisions along epidermis (ep) and cortex (co) in 5 DAG root tips 12 HAT to ammonium or nitrate supplemented media. Data are derived from 15 and 17 roots. The statistical significance was evaluated with ANOVA at P < 0.05. The box chart components are defined as; box (25–75%), central band (median line), central box (mean), and the range are within 1.5IQR.

- A, B
Maximum intensity Z‐stack projection images of 5 DAG old roots expressing the R2D2 auxin signaling reporter 12 HAT to ammonium (A) or nitrate (B) supplemented media. White arrows mark the position of the 10th and 20th cells from QC; “e” and “c” mark epidermis and cortex, respectively. Scale bar = 50 µm. Graphs denote normalized relative auxin levels at the respective positions. Lines represent polynomial regression fit with 95% confidence band. Data are derived from 5 roots per condition from 3 biological replicates.
- A
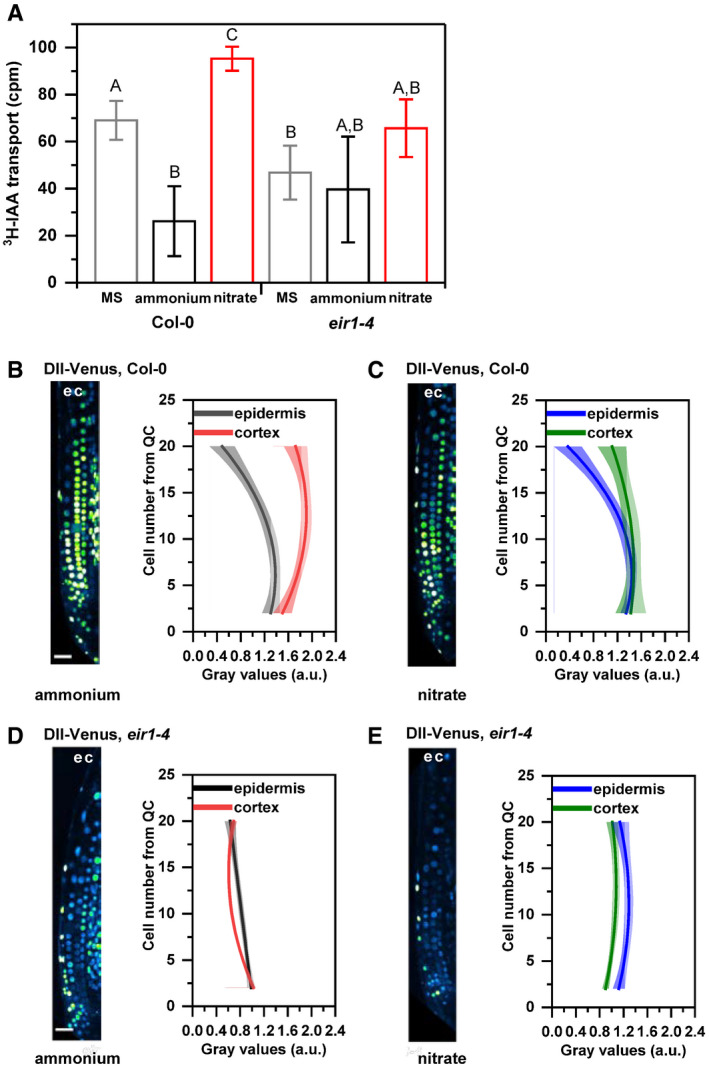
Basipetal (shootward) auxin transport measurements in Col‐0 and eir1‐4 roots grown on control Murashige and Skoog (MS) or with either nitrate or ammonium supplied media. 3H‐IAA was applied at the root tip of 7 DAG wild‐type (Col‐0) or eir1‐4 seedlings. Radioactivity was measured 6 h after application of 3H‐IAA in root segments after excision of the apical ≈ 1 mm of the root tip. Values shown are the geometric mean (± standard deviation, SD) for at least 30 seedlings. The amount of auxin transported into each root segment for Col‐0 and eir1‐4 was compared by ANOVA at P < 0.05. cpm, counts per minute.
- B–E
Maximum intensity Z‐stack projection images of 5 DAG old Col‐0 and eir1‐4 roots expressing the DII‐Venus auxin signaling reporter 12 HAT to ammonium (B and D) or nitrate (C and E) supplemented media. “e” and “c” mark epidermis and cortex, respectively. Scale bar = 50 µm. Graphs denote normalized relative auxin levels at the respective positions. Lines represent polynomial regression fit with 95% confidence band. Data are derived from measurements of n = 8 (ammonium) and n = 10 (nitrate) roots of Col‐0 and n = 10 roots of eir1‐4 per condition.
- A
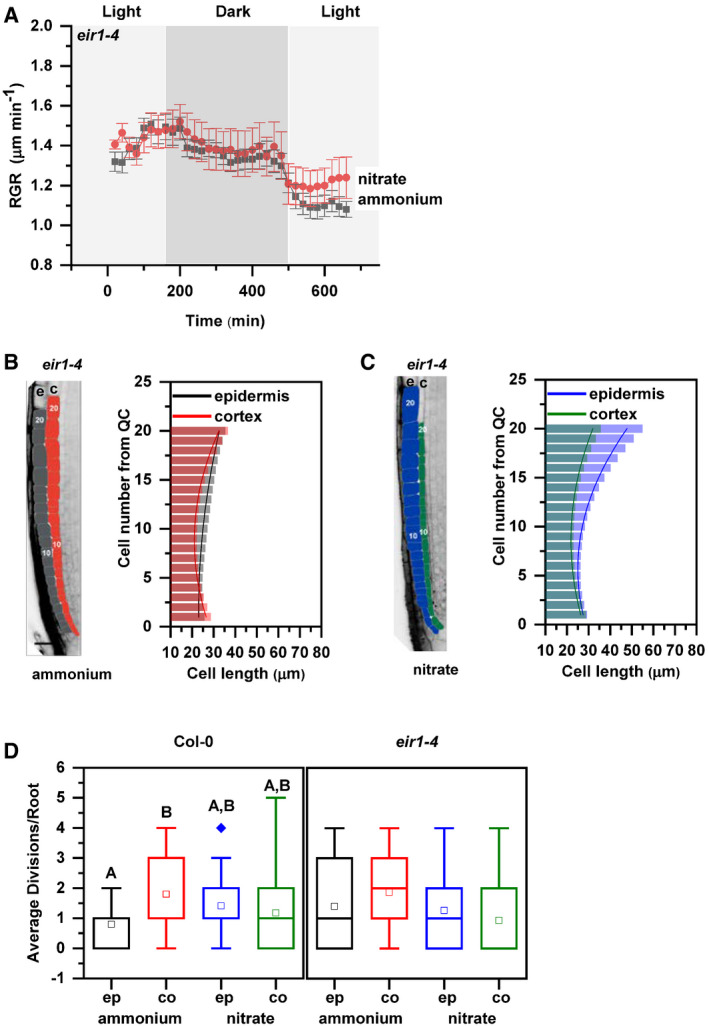
Root growth rate (RGR in µm/min) of eir1‐4 roots transferred 5 DAG to ammonium (gray) or nitrate (red) containing medium over a period of 680 min. Data represent the geometric mean (± standard error, SE) of 3 biological replicates (n = 5 roots/condition). Light and dark periods are highlighted in light or dark gray.
- B, C
Representation and quantification of cell length in epidermal (e) and cortical (c) cell files. Optical, longitudinal sections of 5 DAG eir1‐4 roots 12 HAT to ammonium (B) or nitrate (C) supplemented media. The first 20‐20 epidermal and cortex cells (from quiescent center (QC)) are highlighted in gray and in red on ammonium (B) and in blue and green on nitrate (C), respectively. Scale bar = 30 µm. Column bars denote the geometric mean of cell length at the respective positions. Lines represent a polynomial regression fit, with calculated slopes between cells 10 and 20 of 0.75884 ± 0.02624 (ammonium, epidermis), 1.13088 ± 0.08446 (ammonium, cortex) and 2.06912 ± 0.10341 (nitrate, epidermis), 0.99878 ± 0.07278 (nitrate, cortex). Data are derived from 3 biological replicates, n = 9 (ammonium) and 8 (nitrate) roots.
- D
Average number of cell divisions along the epidermis (ep) and cortex (co) in 5 DAG old Col‐0 and eir1‐4 root tips 12 HAT to ammonium or nitrate supplemented media. Data are derived from n = 15 and n = 17 roots of Col and n = 10 and n = 9 roots of eir1‐4 on ammonium and nitrate, respectively. Statistical significance was evaluated with ANOVA at P < 0.05. The box chart components are defined as; box (25–75%), central band (median line), central box (mean), and the range is within 1.5IQR.
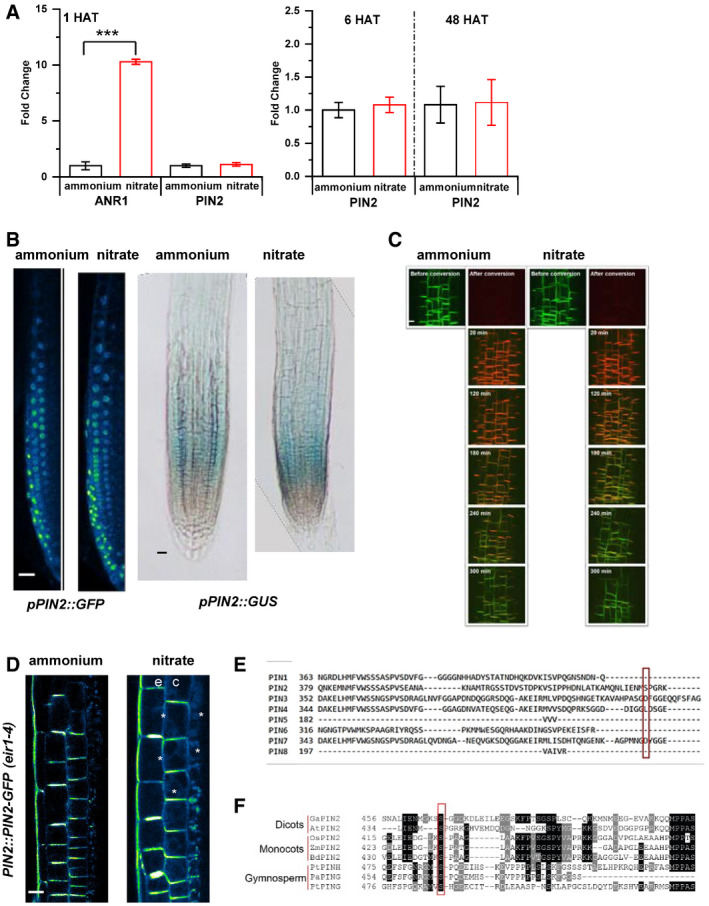
RT–qPCR analysis of PIN2 expression normalized to UBQ10 (AT4G05320) levels in Col‐0 roots 1, 6 and 48 HAT to ammonium or nitrate. As a positive control, expression of ANR1 (nitrate responsive MADS‐box transcription factor) was quantified. All RT–qPCR reactions were carried out with biological and technical triplicates. Statistical difference was calculated with a t‐test (P value ***<0.001). Error bars represent mean ± SD. The experiment was done three times.
PIN2 promoter activity was monitored in pPIN2::nlsGFP and pPIN2::GUS expressing roots 12 HAT to ammonium or nitrate. Scale bars = 50 µm.
Confocal microscopic images of PIN2::PIN2‐DENDRA fluorescence in the same area of the root transition zones 12 HAT to ammonium or nitrate before and after photoconversion (0, 20, 120, 180, 240, 300 min). Scale bar = 20 µm.
Multiphoton microscopic image showing polarity changes of PIN2 expression upon nitrate treatment. “e” and “c” denote epidermis and cortex respectively. White arrows mark lateralization of the PIN2‐GFP signal in cortex cells (c). Scale bar = 10 µm.
Protein sequence alignment of members of the Arabidopsis PIN protein family. Ser439 of PIN2 and the corresponding residues of other PIN family members are marked by a red box.
PIN2 protein sequence alignment shows evolutionary conservation of Ser439 in representative members of Gymnosperms, Monocots, and Dicots. From Gymnosperms Picea abies (Pa) and Pinus taeda (Pt) PIN2 proteins (PtPING, PtPINH, PaPING), from Monocots Zea mays (Zm), Brachypodium distachyon (Bd), and Oryza sativa (Os) PIN2 proteins (ZmPIN2, BdPIN2, OsPIN2) and from Dicots Gossypium arboreun (Ga) and Arabidopsis thaliana (At) PIN2 proteins (GaPIN2, AtPIN2) were used. Protein alignments were created with the MEGAX software (Kumar et al, 2018).
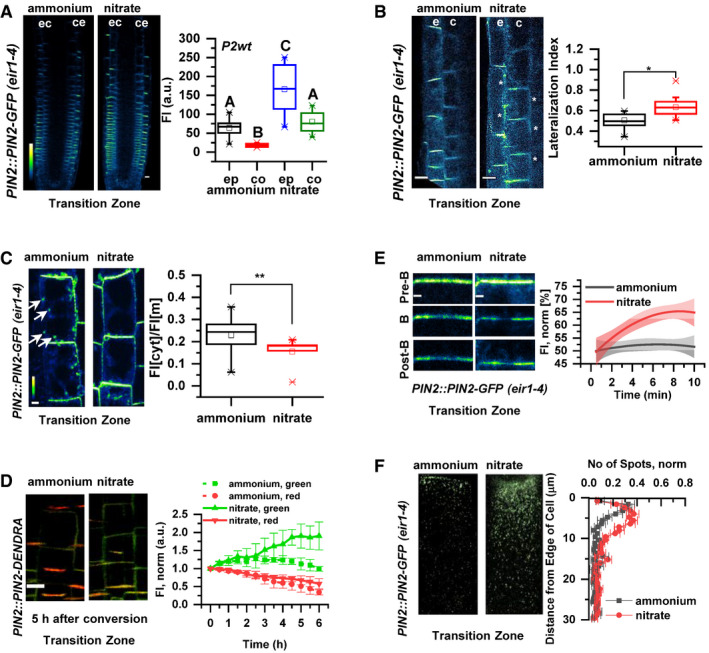
Pseudo‐colored, optical longitudinal cross sections of 5 DAG roots expressing PIN2::PIN2‐GFP, eir1‐4 12 HAT to ammonium or nitrate supplemented media. “e” denotes epidermis and “c” cortex, respectively. Color code represents GFP intensity from low (blue) to high (white) values. Scale bar = 20 µm. Box plots display the distribution of the cell membrane‐derived PIN2‐GFP fluorescence intensity (FI) values (in arbitrary units, a.u.) on ammonium (gray, epidermis (ep) and red, cortex (co), n = 15) and nitrate (blue, epidermis (ep) and green, cortex (co), n = 10) grown roots. 5 cells per root were analyzed. The statistical significance was evaluated with ANOVA at P < 0.05. The box chart components are defined as, box (25–75%), central band (median line), and central box (mean), and the range is within 1.5IQR.
Higher magnification of pseudo‐colored confocal images of 5 DAG old roots expressing PIN2‐GFP 12 HAT to ammonium or nitrate supplemented media. “e” denotes epidermis and “c” cortex, respectively. Color code represents GFP intensity from low (blue) to high (white) values. Scale bar = 12 µm. White stars mark PIN2‐GFP protein localization on the lateral membranes. Box plots display lateralization index (fluorescent signal detected on apical/basal membranes divided by the signal value at inner/outer membranes) of roots on ammonium (n = 31 cells from 6 roots) or nitrate (n = 24 cells from 6 roots) supplemented medium. The statistical significance was evaluated with ANOVA at P < 0.05. The box chart components are defined as, box (25–75%), central band (median line), and central box (mean), and the range is within 1.5IQR.
Pseudo‐colored PIN2‐GFP signal in epidermal cells of 5 DAG old roots 12 HAT to ammonium or nitrate‐containing media. White arrows point to PIN2‐GFP containing intracellular vesicles. Box plots represent the ratio in fluorescent signal detected inside the cell vs. on the membranes (FI[cyt]/FI[m]). n = 6 roots per condition, 5 cells per root were analyzed. Scale bar = 5µm. The statistical significance was evaluated with ANOVA at P < 0.05. The box chart components are defined as, box (25–75%), central band (median line), and central box (mean), and the range is within 1.5IQR.
Microscopic images showing PIN2‐Dendra fluorescent signal 5 h after photoconversion of PIN2‐Dendra into its red form. Depletion of the red signal and recovery of the green signal over a 6 h period was followed in parallel in 5 DAG old roots 12 HAT to ammonium or nitrate supplemented media. Note the increase in the intensity of the green signal in roots transferred to nitrate. Graph represents the mean signal ± SD (n = 6 roots per condition, 20 cells per root analyzed). The experiment was repeated 3 times. Scale bar = 20 µm.
FRAP analysis of PIN2 protein mobility in PIN2::PIN2‐GFP expressing epidermal cells 12 HAT to ammonium or nitrate. The graph shows polynomial regression fit with 95% confidence band of the mean signal recovery in the bleached region of interest (ROI) after background subtraction and normalization to photobleaching. Data are derived from 3 biological replicates, each consisting of 5 membranes from 3 different roots. Scale bar = 2 µm.
Representative 3D SIM microscopic images of 10 DAG old epidermal cells expressing PIN2‐GFP 12 HAT to ammonium or nitrate‐containing media. Green dots represent PIN2‐GFP on the lateral cell surface (polar domain) of epidermal cells in the transition zone. Graph represents the number of GFP‐positive spots along a 30 µm long region starting at the apical side of the cell (8 cells per 4 roots and 9 cells per 4 roots) were analyzed per treatment, experiment was done 3 times. Error bars represent mean + SE. Note the effect of ammonium vs. nitrate on the distribution of the PIN2‐GFP spots.
- A–C
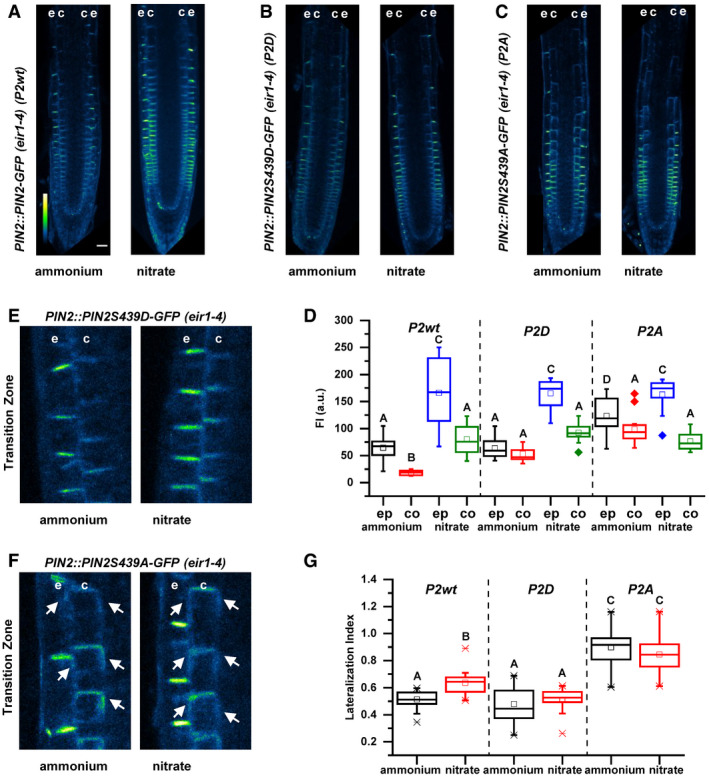
Pseudo‐colored, optical longitudinal cross sections of 5 DAG roots expressing (A) PIN2‐GFP (PIN2::PIN2‐GFP, P2wt) (B) PIN2S439D‐GFP (PIN2::PIN2S439D‐GFP, P2D) and (C) PIN2S439A (PIN2::PIN2S439A‐GFP, P2A)—all in eir1‐4 background – 12 HAT to ammonium or nitrate supplemented media. “e” denotes epidermis and “c” cortex, respectively. Color code represents GFP intensity from low (blue) to high (white) values. Scale bar = 50 µm.
- D
Box plots display the distribution of the cell membrane‐derived PIN2‐GFP fluorescence intensity (FI) values (in arbitrary units, a.u.) in roots transferred to ammonium ((gray, epidermis (ep) and red, cortex (co) and to nitrate (blue, epidermis (ep) and green, cortex (co)). 5 cells per roots were analyzed in at least 9 roots per genotype per treatment. The statistical significance was evaluated with ANOVA at P < 0.05. The box chart components are defined as, box (25–75%), central band (median line), and central box (mean), and the range is within 1.5IQR.
- E, F
Microscopic images of 5 DAG old roots expressing (E) PIN2::PIN2S439D‐GFP and (F) PIN2::PIN2S439A‐GFP 12 HAT to ammonium or nitrate amended media. “e” denotes epidermis and “c” cortex, respectively. White arrows point to PIN2‐GFP protein localization on the lateral membranes.
- G
Box plots display lateralization index (fluorescent signal detected on apical/basal membranes vs. inner/outer membranes) of P2wt, P2D, and P2A roots transferred to ammonium (gray) or nitrate (red) supplemented medium. At least 24 cells from 5 roots were analyzed per genotype per treatment. The statistical significance was evaluated with ANOVA at P < 0.05. The box chart components are defined as, box (25–75%), central band (median line), and central box (mean), and the range is within 1.5IQR.
- A
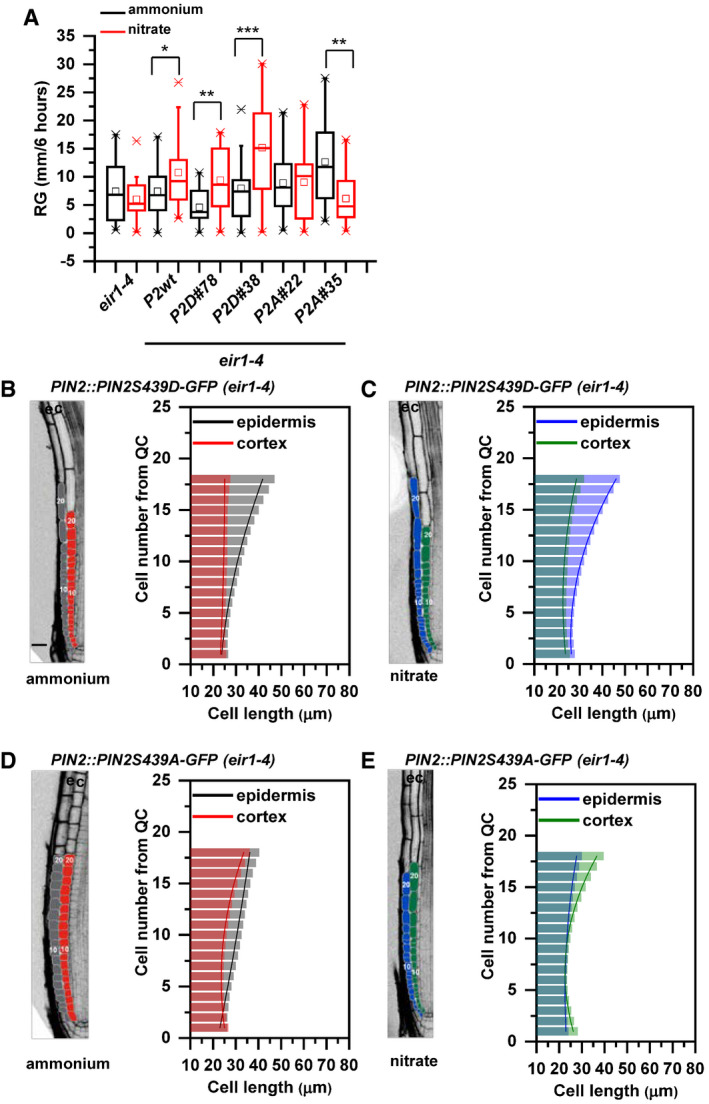
Box plot representation of root growth (µm/6 h) of eir1‐4, Col‐0, PIN2::PIN2‐GFP (P2wt), two independent PIN2::PIN2S439D‐GFP (P2D) lines (#78 and #38) and two independent PIN2:PIN2S439A‐GFP (P2A) lines (#22 and #35) transferred to ammonium or nitrate‐containing medium. At least 10 roots were analyzed per genotype per treatment. The statistical significance was evaluated with ANOVA at P < 0.05 (*), P < 0.01 (**), P < 0.001 (***). The box chart components are defined as, box (25–75%), central band (median line), and central box (mean), and the range is within 1.5IQR.
- B–E
Optical, longitudinal sections of 5 DAG old roots expressing PIN2S439D‐GFP (B and C) and PIN2S439A‐GFP (D and E) 12 HAT to ammonium (B and D) or nitrate (C and D) supplemented media. The first 20‐20 epidermal and cortex cells (from quiescent center (QC)) are highlighted in gray and in red on ammonium (B and D) and in blue and green on nitrate (C and E), respectively. Scale bar = 30 µm. Column bars denote the geometric mean of cell length at the respective positions. Lines represent a polynomial regression fit, with calculated slopes between cells 10 and 20 of ammonium‐PIN2S439D‐epidermis: 1.38867 + 0.03079, ammonium‐PIN2S439D‐cortex: 0.05689 + 0.00497, nitrate‐PIN2S439D‐epidermis: 1.92749 + 0.0727, nitrate‐PIN2S439D‐cortex: 0.66477 + 0.03592, ammonium‐PIN2S439A‐epidermis: 0.7164 ± 0.00565, ammonium‐PIN2S439A‐cortex: 1.09064 ± 0.05609, nitrate‐PIN2S439A‐epidermis: 0.53796 ± 0.0249, and nitrate‐PIN2S439A‐cortex: 1.61118 ± 0.09541. Data are derived from 3 biological replicates; at least 5 roots were analyzed in each case.
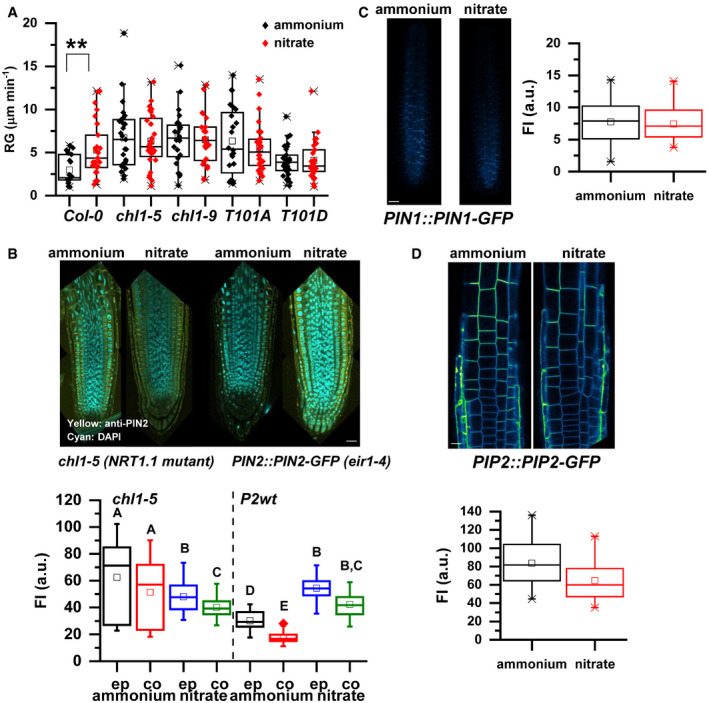
Root growth (RG in µm/min) of roots of Col‐0, chl1‐5, chl1‐9, T101A, and T101D seedlings 12 HAT to ammonium (black) or nitrate (red). Seedlings were transferred at 7 DAG. At least 10 roots/treatment/genotype were measured. The experiment was repeated 3 times. The statistical significance was evaluated with ANOVA at P < 0.01 (**). The box chart components are defined as, box (25–75%), central band (median line), and central box (mean), and the range is within 1.5IQR.
Pseudo‐colored, optical longitudinal sections of PIN2 immunostained (yellow signal), 5 DAG roots of chl1‐5 and PIN2::PIN2‐GFP, eir1‐4 expressing roots, 12 HAT to ammonium or nitrate supplemented media. “e” denotes epidermis and “c” cortex, respectively. Scale bar = 30 µm. Box plots display the distribution of the cell membrane‐derived anti‐PIN2 fluorescence intensity (FI) values (in arbitrary units, a.u.) on ammonium (gray, epidermis (ep) and red, cortex (co), n = 40 membrane) and nitrate (blue, epidermis (ep) and green, cortex (co), n = 40 membrane) grown roots. 4 roots were analyzed/treatment/genotype, and 10 cells per root were quantified. The statistical significance was evaluated with ANOVA at P < 0.05. The box chart components are defined as, box (25–75%), central band (median line), central box (mean), and the range is within 1.5IQR.
Pseudo‐colored, longitudinal Z‐stacks of PIN1::PIN1‐GFP expressing 5 DAG roots, 12 HAT to ammonium or nitrate. Scale bar = 30 µm. Box plots display the distribution of the cell membrane‐derived PIN1‐GFP fluorescence intensity (FI) values (in arbitrary units, a.u.) on ammonium (black) and red (nitrate). 4 roots were analyzed/treatment, and 10 cells per root were quantified. The statistical significance was evaluated with ANOVA at P < 0.05. The box chart components are defined as, box (25–75%), central band (median line), and central box (mean), and the range is within 1.5IQR.
Pseudo‐colored, longitudinal Z‐stacks of PIP2::PIP2‐GFP expressing 5 DAG roots, 12 HAT to ammonium or nitrate. Scale bar = 10 µm. Box plots display the distribution of the cell membrane‐derived PIP2‐GFP fluorescence intensity (FI) values (in arbitrary units, a.u.) on ammonium (black) and red (nitrate). 4 roots were analyzed/treatment and 10 cells per root were quantified. The statistical significance was evaluated with ANOVA at P < 0.05. The box chart components are defined as, box (25–75%), central band (median line), and central box (mean), and the range is within 1.5IQR.
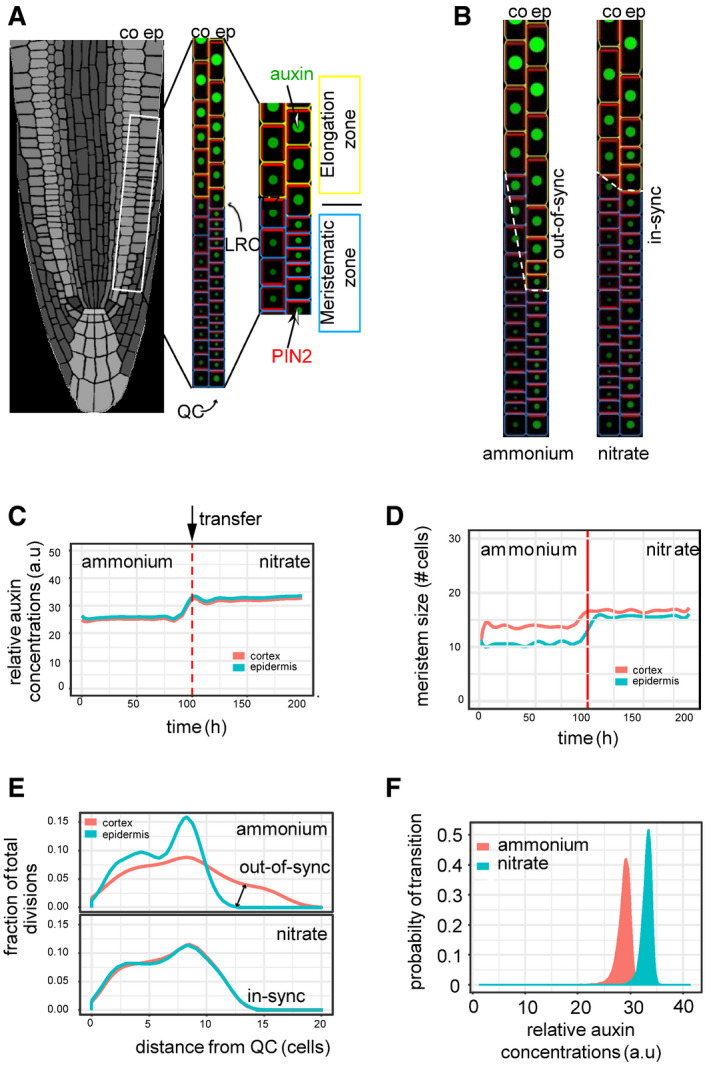
- A
Schematics of the root model with epidermis (ep) and cortex (co) tissues. Meristematic and elongating cells are shown with blue and yellow walls, respectively. Auxin levels are represented by green circle size and red bars reflect the PIN2 amounts. Auxin is supplied from Lateral Root Cap (LRC) and QC (Model B).
- B
Steady‐state snapshots from model simulation with ammonium (left panel) and with nitrate (right panel). Note out‐of‐sync growth patterns (dashed white line) in ammonium.
- C, D
Model simulation representing the effect of the transition from ammonium to nitrate (denoted by a red dashed line) on the relative level of auxin (C) and meristem size measured as distance from QC (D).
- E
Model predictions display the fraction of total cell division events per cell in the meristem along in the two N source. Note cell division is out‐of‐sync in ammonium, producing altered growth of the root.
- F
Experimentally derived relative auxin level threshold triggering cell elongation depends on the actual N content of the root.
References
-
- Abas L, Benjamins R, Malenica N, Paciorek T, Wiśniewska J, Wirniewska J, Moulinier‐Anzola JC, Sieberer T, Friml J, Luschnig C (2006) Intracellular trafficking and proteolysis of the Arabidopsis auxin‐efflux facilitator PIN2 are involved in root gravitropism. Nat Cell Biol 8: 249–256 - PubMed
-
- Baluska F, Mancuso S, Volkmann D, Barlow PW (2010) Root apex transition zone: a signalling‐response nexus in the root. Trends Plant Sci 15: 402–408 - PubMed
Publication types
MeSH terms
Substances
Grants and funding
LinkOut - more resources
Full Text Sources
Other Literature Sources
