

Review
doi: 10.1148/radiol.2021202553.
Epub 2021 Jan 5.
The Biological Meaning of Radiomic Features
Affiliations
- PMID: 33399513
- PMCID: PMC7924519
- DOI: 10.1148/radiol.2021202553
Item in Clipboard
Review
The Biological Meaning of Radiomic Features
Radiology.
2021 Mar.
Erratum in
-
The Biological Meaning of Radiomic Features.Radiology. 2021 May;299(2):E256. doi: 10.1148/radiol.2021219005. Radiology. 2021. PMID: 33900879 Free PMC article. No abstract available.
Abstract
An earlier incorrect version appeared online. This article was corrected on February 10, 2021.
Figures
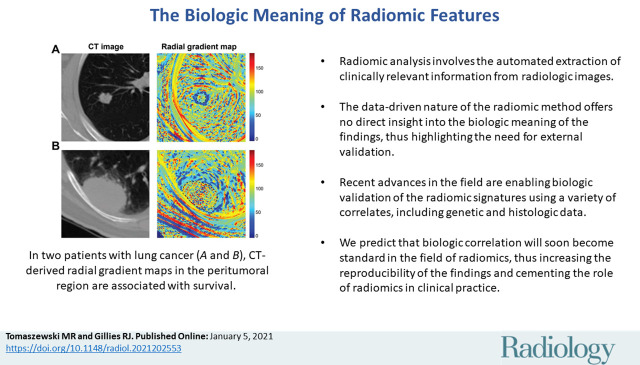
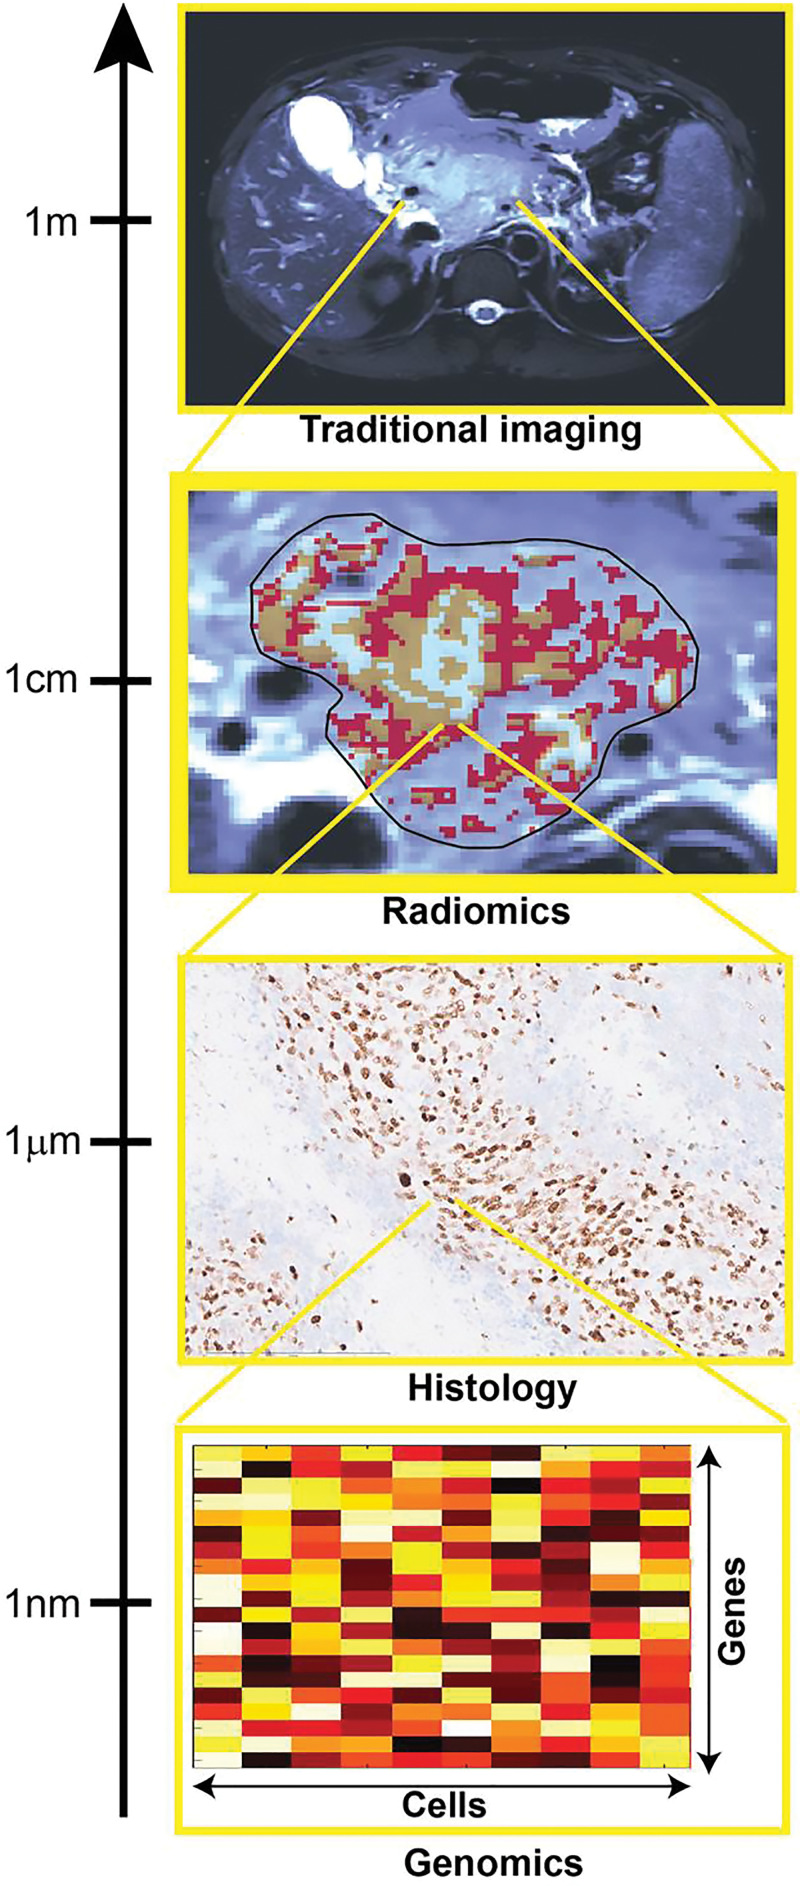
Image shows how multiscale quantification provides complementary tumor insight. Histologic and genomic analysis can provide specific small-scale insight useful for validation of radiomic results, focused on quantification of spatial patterns of size exceeding image resolution.
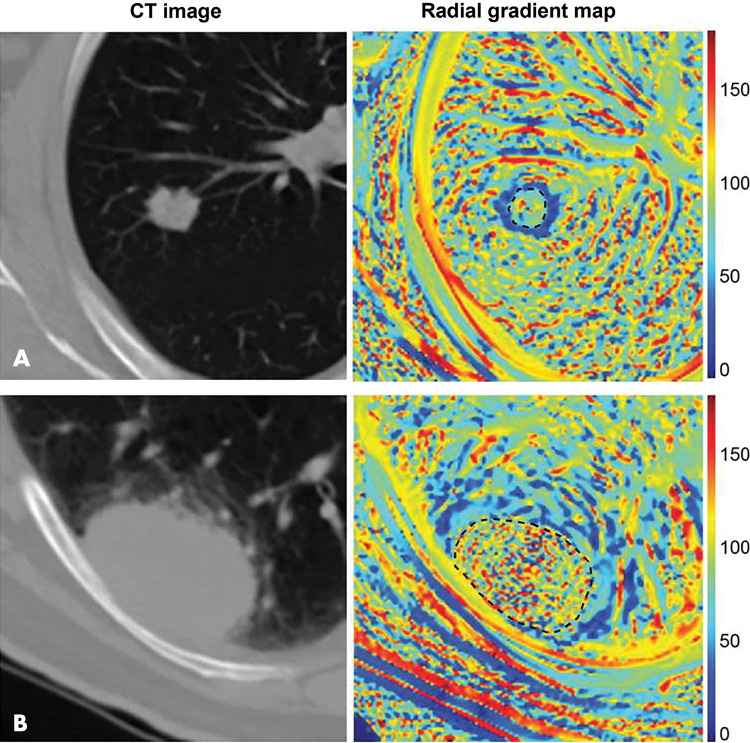
Radiomics can quantify visual tumor characteristics. CT images (left) of lung cancer lesions from two patients (A and B) were used by Tunali et al to calculate radial gradient maps (right) that describe tumor edge interface (tumor outlined in black dotted line). Quantification of simple mean and standard deviation of map in peritumoral region is associated with survival and correlates to qualitative semantic descriptors of tumor edge, such as border definition. Source.—Reference .
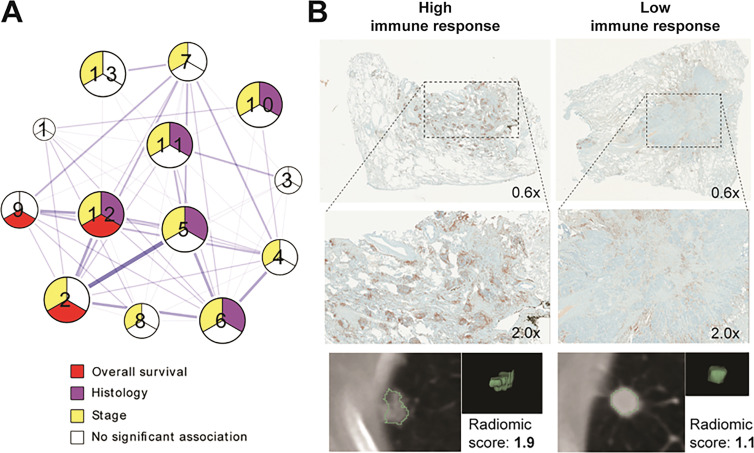
Associations between radiomic and pathway data can be explored histologically. A, Diagram depicts analysis of correlations between pathway enrichment and radiomic features presented by Grossman et al. Multiple clusters (numbers 1–13) describe relationships between distinct biological processes and image information. Further correlation of relevant radiomic features and immunohistochemical staining (nuclear CD3 expression) was performed to validate findings and to provide link to understand interaction between genetics and imaging characteristics of tumor. B, Example tumors with strong immune response and/or high radiomic score (left) and low immune response and/or radiomic score (right) are shown. Source.—Reference .
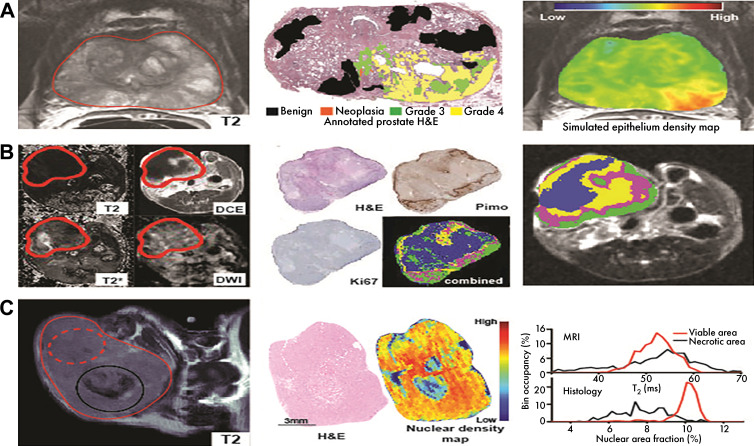
Coregistered histologic findings provide biological insight into image features. H&E = hematoxylin-eosin. A, McGarry et al (additional data provided by authors) developed model using multiparametric MRI information (left), trained on coregistered annotated hematoxylin-eosin–stained slides (middle) to model prostate epithelium density (right), relevant for tumor staging. B, Jardim-Perassi used multiparametric MRI (left), coregistered with histologic maps of viability, proliferation, and hypoxia (middle) to understand biological meaning of imaging habitats (right). DCE = dynamic contrast enhanced, DWI = diffusion-weighted imaging, Pimo = pimonidazole. C, Tomaszewski et al proposed T2-weighted MRI (left) histogram biomarker of radiation therapy response and used coregistered histologically derived nuclear density maps (middle) to demonstrate source of observed imaging changes through similarities in histogram features (right). Source.—References , , .
References
-
- Lambin P, Leijenaar RTH, Deist TM, et al. Radiomics: the bridge between medical imaging and personalized medicine. Nat Rev Clin Oncol 2017;14(12):749–762. - PubMed
Publication types
MeSH terms
Substances
Grants and funding
LinkOut - more resources
Full Text Sources
Other Literature Sources
Medical
