. 2021 Jan 1;28(Pt 1):3-17.
doi: 10.1107/S160057752001382X. Epub 2021 Jan 1.

Wigner distribution of self-amplified spontaneous emission free-electron laser pulses and extracting its autocorrelation

Affiliations

Wigner distribution of self-amplified spontaneous emission free-electron laser pulses and extracting its autocorrelation

Svitozar Serkez et al. J Synchrotron Radiat. .

Abstract

The emerging concept of `beam by design' in free-electron laser (FEL) accelerator physics aims for accurate manipulation of the electron beam to tailor spectral and temporal properties of the radiation for specific experimental purposes, such as X-ray pump/X-ray probe and multiple wavelength experiments. `Beam by design' requires fast, efficient, and detailed feedback on the spectral and temporal properties of the generated X-ray radiation. Here a simple and cost-efficient method to extract information on the longitudinal Wigner distribution function of emitted FEL pulses is proposed. The method requires only an ensemble of measured FEL spectra and is rather robust with respect to accelerator fluctuations. The method is applied to both the simulated SASE spectra with known radiation properties as well as to the SASE spectra measured at the European XFEL revealing underlying non-linear chirp of the generated radiation. In the Appendices an intuitive understanding of time-frequency representations of chirped SASE radiation is provided.

Keywords: FEL; SASE; Wigner; duration; spectrogram.


Figures

Figure 1
Figure 1
A 6 µm-long flat-top model electron beam without energy chirp, see top left plot, used to generate SASE radiation. Lines I, γ, δγ, ɛxn, ɛyn depict electron beam current, energy (as Lorenz factor), energy spread and both horizontal and vertical normalized emittances, respectively. The radiation file is dumped during the exponential growth for 500 statistically independent events. SASE spectra are presented on the top right plot. The light gray area depicts spectral span of individual events, the dark gray line depicts a single event, and the black line provides the ensemble-averaged spectrum. The ensemble-averaged Wigner distribution of the SASE radiation is presented in the bottom left plot. Hereafter the diverging colormap of the Wigner distribution is normalized to its maximum absolute value, while its zero value is depicted with a white color. The spectrogram autocorrelation reconstruction R(s, ℏω/e) is presented in the bottom right plot. Colored lines in the top subplot show the corresponding line-offs of the reconstruction at different photon energies. These line-offs are normalized to 1 at their maximum value. The black line depicts an average of these line-offs. s = −ct is the coordinate along the radiation propagation direction.
Figure 2
Figure 2
A 6 µm-long flat-top model electron beam with linear energy chirp, see top left plot, used to generate SASE radiation. It is dumped during the exponential growth for 500 statistically independent events. Subplots and notations are identical to those in Fig. 1 ▸.
Figure 3
Figure 3
Two flat-top 2 µm-long electron beams, separated by 3 µm, generate two consecutive SASE pulses of the same averaged shape – see top left plot. The radiation is dumped during the exponential growth for 500 statistically independent events. Subplots and notations are identical to those in Fig. 1 ▸.
Figure 4
Figure 4
The European XFEL 100 pC electron beam with a non-linear energy chirp produces SASE radiation with different durations at different photon energies. Note the bifurcation in Wigner distribution above 499 eV. Analysis based on 1000 simulated SASE spectra. Subplots and notations are identical to those in Fig. 1 ▸.
Figure 5
Figure 5
The line-offs of the Wigner distribution presented in Fig. 4 ▸ for different photon energies each binned over 0.2 eV (top plot) and their corresponding autocorrelation traces (bottom plot). The color convention follows that of the line-offs of the reconstruction on the same figure.
Figure 6
Figure 6
Top: ensemble average of measured soft X-ray SASE spectra (solid black line), spectral density range within the ensemble (gray background area) and three single-shot measurements of spectra (green, blue and orange lines). Bottom: value of normalized second-order correlation function at Δω = 0.
Figure 7
Figure 7
Result of processing the soft X-ray experimental spectra with the ROSA algorithm.
Figure 8
Figure 8
Top: ensemble average of measured hard X-ray SASE spectra (solid black line), spectral density range within the ensemble (gray background area) and three single-shot measurements of spectra (green, blue and orange lines). Bottom: value of normalized second-order correlation function at Δω = 0.
Figure 9
Figure 9
Result of processing the hard X-ray experimental spectra with the ROSA algorithm.
Figure 10
Figure 10
Time–frequency analysis terminology illustrated on a single-shot Wigner distribution of a modeled SASE pulse with negative frequency chirp u. The Wigner distribution for a bandwidth-limited pulse of Gaussian shape is provided in the inset.
Figure 11
Figure 11
Single-shot Wigner distributions for, otherwise temporally coherent, Gaussian pulse with identical chirp and the same SASE pulse as in Fig. 10 ▸ without frequency chirp.
Figure 12
Figure 12
Illustration of statistical processes arranged according to whether their average depends on the choice of realization subset or the shift of time.
Figure 13
Figure 13
Colormap representations of the Wigner distribution of simulated SASE FEL radiation with their marginal distributions when averaged over an ensemble of 1 (upper left subfigure), 10 (upper right), 100 (lower left) and 1000 (lower right) statistically independent realizations. Note the significant non-linear frequency chirp in the pulse, visible upon ensemble averaging.
Figure 14
Figure 14
Wigner distribution of imitated SASE FEL radiation for two ‘flat-top’ pulses with different frequencies (left subfigures) and for a continuous pulse with instantaneous frequency varying in time sinusoidally (right subfigures). The distributions averaged over an ensemble of one and 10000 statistically independent realizations are presented on the top and middle subfigures, respectively. The amplitude of the cross terms is reduced significantly upon averaging over an ensemble. The bottom subfigures illustrate the single-shot spectrograms – the result of Wigner distribution convolution with that of a window function, provided in the inset.
Figure 15
Figure 15
Spectrogram autocorrelation function upon adding the pulse energy jitter of (a) 0%, (b) 50%, (c) 100% and (d) 100% after pedestal subtraction in the correlation function. Hereinafter, colored lines in the top subplots show the corresponding line-offs of the reconstruction at different photon energies.
Figure 16
Figure 16
Spectrogram autocorrelation function upon adding the electron energy jitter corresponding to jitter of radiation spectra with r.m.s. of (a) 0.5 eV and (b) 1 eV.
Figure 17
Figure 17
Spectrogram autocorrelation function upon simulating limited spectrometer resolution imitated by convolving spectra with Gaussian instrumental function of (a) 0.03 eV, (b) 0.07 eV, (c) 0.2 eV and (d) 0.5 eV FWHM bandwidth.
Figure 18
Figure 18
Averaged spectrum with corresponding values of formula image 
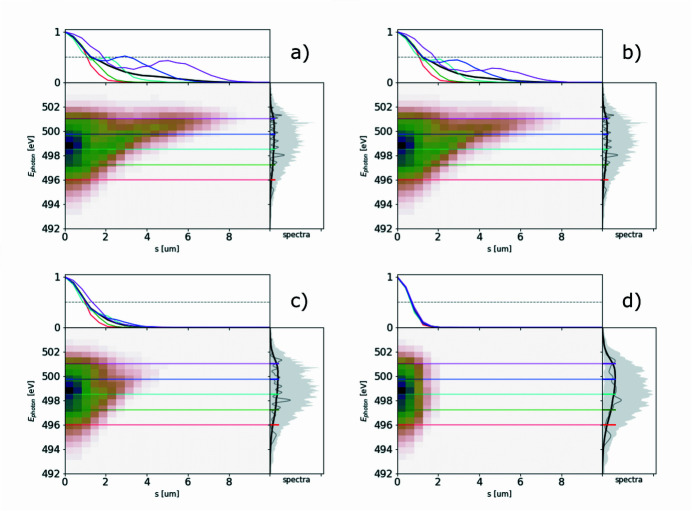
in the case of (a) no detrimental effects introduced, (b) added 100% pulse energy jitter, (c) 1 eV photon energy jitter and (d) convolving spectra with 0.2 eV FWHM instrumental function.

References

    1. Agapov, I., Geloni, G., Tomin, S. & Zagorodnov, I. (2014). Nucl. Instrum. Methods Phys. Res. A, 768, 151–156.
    1. Allaria, E., Callegari, C., Cocco, D., Fawley, W. M., Kiskinova, M., Masciovecchio, C. & Parmigiani, F. (2010). New J. Phys. 12, 075002.
    1. Altarelli, M., Brinkmann, R., Chergui, M., Decking, W., Dobson, B., Düsterer, S., Grübel, G., Graeff, W., Graafsma, H., Hajdu, J., Marangos, Jonathan., Pflüger, J., Redlin, H., Riley, D., Robinson, I., Rossbach, J., Schwarz, A., Tiedtke, K., Tschentscher, T., Vartaniants, I., Wabnitz, H., Weise, H., Wichmann, R., Witte, K., Wolf, A., Wulff, M. & Yurkov, M. (2006). The European X-ray Free-Electron Laser, Technical Design Report. DESY Report 2006g-097. DESY, Hamburg, Germany.
    1. Behrens, C., Decker, F.-J., Ding, Y., Dolgashev, V. A., Frisch, J., Huang, Z., Krejcik, P., Loos, H., Lutman, A., Maxwell, T. J., Turner, J., Wang, J., Wang, M.-H., Welch, J. & Wu, J. (2014). Nat. Commun. 5, 3762. - PubMed
    1. Chapman, H. N., Fromme, P., Barty, A., White, T. A., Kirian, R. A., Aquila, A., Hunter, M. S., Schulz, J., DePonte, D. P., Weierstall, U., Doak, R. B., Maia, F. R. N. C., Martin, A. V., Schlichting, I., Lomb, L., Coppola, N., Shoeman, R. L., Epp, S. W., Hartmann, R., Rolles, D., Rudenko, A., Foucar, L., Kimmel, N., Weidenspointner, G., Holl, P., Liang, M., Barthelmess, M., Caleman, C., Boutet, S., Bogan, M. J., Krzywinski, J., Bostedt, C., Bajt, S., Gumprecht, L., Rudek, B., Erk, B., Schmidt, C., Hömke, A., Reich, C., Pietschner, D., Strüder, L., Hauser, G., Gorke, H., Ullrich, J., Herrmann, S., Schaller, G., Schopper, F., Soltau, H., Kühnel, K.-U., Messerschmidt, M., Bozek, J. D., Hau-Riege, S. P., Frank, M., Hampton, C. Y., Sierra, R. G., Starodub, D., Williams, G. J., Hajdu, J., Timneanu, N., Seibert, M. M., Andreasson, J., Rocker, A., Jönsson, O., Svenda, M., Stern, S., Nass, K., Andritschke, R., Schröter, C.-D., Krasniqi, F., Bott, M., Schmidt, K. E., Wang, X., Grotjohann, I., Holton, J. M., Barends, T. R. M., Neutze, R., Marchesini, S., Fromme, R., Schorb, S., Rupp, D., Adolph, M., Gorkhover, T., Andersson, I., Hirsemann, H., Potdevin, G., Graafsma, H., Nilsson, B. & Spence, J. C. H. (2011). Nature, 470, 73–77. - PubMed