. 2021 Jan 1;28(Pt 1):309-317.
doi: 10.1107/S1600577520014708. Epub 2021 Jan 1.

Broadband X-ray ptychography using multi-wavelength algorithm

Affiliations

Broadband X-ray ptychography using multi-wavelength algorithm

Yudong Yao et al. J Synchrotron Radiat. .

Abstract

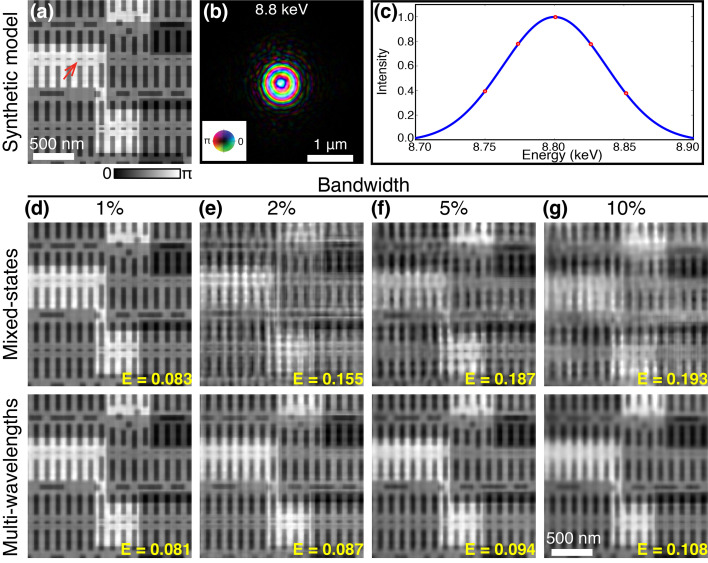
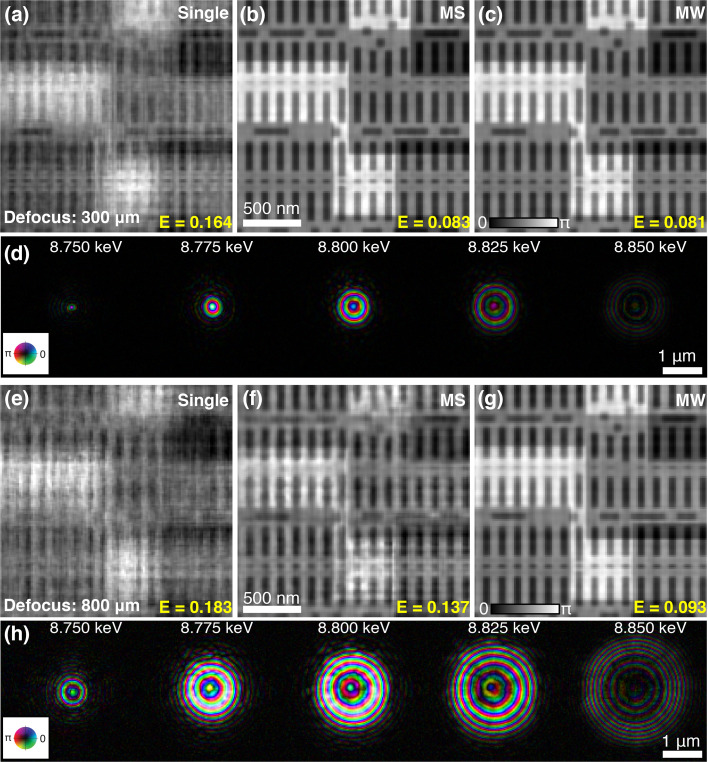
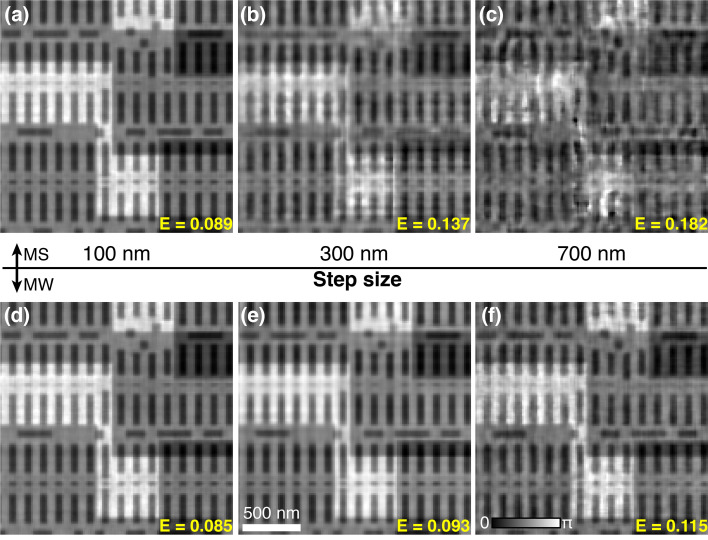
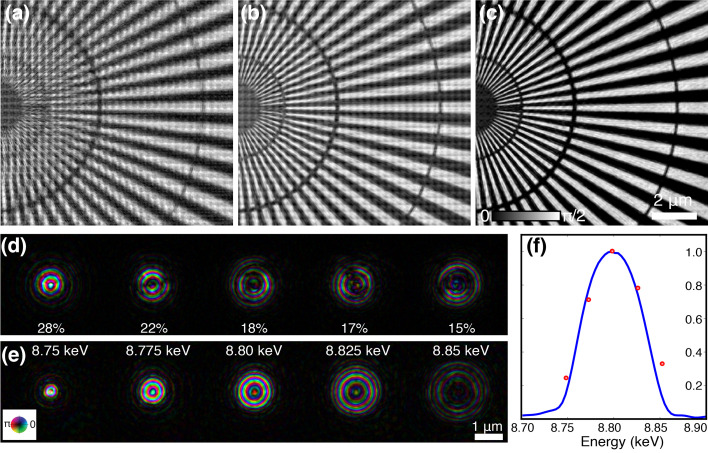
Ptychography is a rapidly developing scanning microscopy which is able to view the internal structures of samples at a high resolution beyond the illumination size. The achieved spatial resolution is theoretically dose-limited. A broadband source can provide much higher flux compared with a monochromatic source; however, it conflicts with the necessary coherence requirements of this coherent diffraction imaging technique. In this paper, a multi-wavelength reconstruction algorithm has been developed to deal with the broad bandwidth in ptychography. Compared with the latest development of mixed-state reconstruction approach, this multi-wavelength approach is more accurate in the physical model, and also considers the spot size variation as a function of energy due to the chromatic focusing optics. Therefore, this method has been proved in both simulation and experiment to significantly improve the reconstruction when the source bandwidth, illumination size and scan step size increase. It is worth mentioning that the accurate and detailed information of the energy spectrum for the incident beam is not required in advance for the proposed method. Further, we combine multi-wavelength and mixed-state approaches to jointly solve temporal and spatial partial coherence in ptychography so that it can handle various disadvantageous experimental effects. The significant relaxation in coherence requirements by our approaches allows the use of high-flux broadband X-ray sources for high-efficient and high-resolution ptychographic imaging.

Keywords: coherent diffraction imaging; high-throughput; partial coherence; ptychography.


Figures

Figure 1
Figure 1
Comparison of two reconstruction strategies with different illumination bandwidths. (a) Ground truth phase image of a synthetic sample generated from a chip design file; (b) an example probe at the central wavelength (8.8 keV) in the simulation; (c) source spectrum with a Gaussian distribution of 1% bandwidth, the red dots indicate the five wavelengthes used in multi-wavelength reconstruction; (d)–(g) reconstructed phase images for bandwidth of 1%, 2%, 5%, 10%, respectively; images on the top show the results using the mixed-state approach while those at the bottom show the corresponding results using the multi-wavelength method. The normalized reconstruction error E is shown on each reconstructed image.
Figure 2
Figure 2
Reconstruction comparison with different beam sizes. A ptychographic dataset acquired with 500 nm beam size is reconstructed by single-mode ptychography (a), mixed-state (MS) method (b) and multi-wavelength (MW) method (c). Panel (d) shows the simultaneously reconstructed five spectral probe modes during the reconstruction of (c). Panels (e)–(g) are reconstructions for 1.5 µm illumination beam size using single-mode ptychography, MS method and MW method, respectively. Panel (h) shows the five spectral probe modes obtained simultaneously in the reconstruction of (g).
Figure 3
Figure 3
Reconstruction comparison with different step sizes. (a)–(c) Reconstructed phase images using the mixed-state approach for three ptychography scans with 100 nm (a), 300 nm (b), 700 nm (c) step size. (d)–(f) Reconstructed phase images using the multi-wavelength approach for the same three datasets with 100 nm (d), 300 nm (e), 700 nm (f) step size.
Figure 4
Figure 4
Experimental broadband ptychography using a DMM source with 1% bandwidth. The phase image of a Siemens star sample reconstructed by (a) single-mode ptychography reconstruction, (b) mixed-state approach, and (c) multi-wavelength approach. (d) Five orthogonal probe modes reconstructed together with (b), the inset values show the power percentage of each mode. (e) Five spectral probe modes from the reconstruction of (c), with its relative power percentage marked by the red dots in (f). The blue curve in (f) shows the measured spectrum of this DMM source in the experiment.
Figure 5
Figure 5
Broadband ptychography using different beam sizes. The probe size was changed by placing the sample at different defocus positions. Panels (a)–(d) show ptychography reconstructions of a dataset acquired with a ∼500 nm illumination of 1% bandwidth, using single-mode (a), mixed-state approach (b), multi-wavelength approach (c). The reconstructed five spectral probe modes are shown in (d). Panels (e)–(h) are corresponding reconstructions using a 1.5 µm illumination size.
Figure 6
Figure 6
Broadband ptychography with different step size. Three ptychography scans with 1.5 µm illumination were conducted using 200 nm, 300 nm, 400 nm step size. Panels (a)–(c) show reconstructions using the mixed-state approach. Panels (d)–(f) are the corresponding reconstructions using the multi-wavelength approach.
Figure 7
Figure 7
Broadband ptychography implemented in fly scan. (a) Mixed-state reconstruction using five orthogonal probe modes; (b) multi-wavelength reconstruction using five wavelengths; (c) combined approach with five wavelengths and two orthogonal modes at each wavelength [insets show a zoomed region denoted by the red box in (a)]; (d) reconstructed probes by the combined method, the five columns are corresponding to five wavelengths in the reconstruction, each column contains two orthogonal probe modes (n = 1, 2) at each wavelength; (e) line profiles for the selected positions marked by the yellow (L1) and orange (L2) lines in (c), respectively.

References

    1. Abbey, B., Whitehead, L. W., Quiney, H. M., Vine, D. J., Cadenazzi, G. A., Henderson, C. A., Nugent, K. A., Balaur, E., Putkunz, C. T., Peele, A. G., Williams, G. & McNulty, I. (2011). Nat. Photon. 5, 420–424.
    1. Bunk, O., Dierolf, M., Kynde, S., Johnson, I., Marti, O. & Pfeiffer, F. (2008). Ultramicroscopy, 108, 481–487. - PubMed
    1. Chen, B., Abbey, B., Dilanian, R., Balaur, E., van Riessen, G., Junker, M., Tran, C. Q., Jones, M. W. M., Peele, A. G., McNulty, I., Vine, D. J., Putkunz, C. T., Quiney, H. M. & Nugent, K. A. (2012). Phys. Rev. B, 86, 235401.
    1. Chen, B., Dilanian, R. A., Teichmann, S., Abbey, B., Peele, A. G., Williams, G. J., Hannaford, P., Van Dao, L., Quiney, H. M. & Nugent, K. A. (2009). Phys. Rev. A, 79, 023809.
    1. Clark, J., Huang, X., Harder, R. & Robinson, I. (2014). Phys. Rev. Lett. 112, 113901. - PubMed