

The Immediate Effect of COVID-19 Policies on Social-Distancing Behavior in the United States
- PMID: 33400622
- PMCID: PMC8093844
- DOI: 10.1177/0033354920976575
The Immediate Effect of COVID-19 Policies on Social-Distancing Behavior in the United States
Abstract
Objective: Although anecdotal evidence indicates the effectiveness of coronavirus disease 2019 (COVID-19) social-distancing policies, their effectiveness in relation to what is driven by public awareness and voluntary actions needs to be determined. We evaluated the effectiveness of the 6 most common social-distancing policies in the United States (statewide stay-at-home orders, limited stay-at-home orders, nonessential business closures, bans on large gatherings, school closure mandates, and limits on restaurants and bars) during the early stage of the pandemic.
Methods: We applied difference-in-differences and event-study methodologies to evaluate the effect of the 6 social-distancing policies on Google-released aggregated, anonymized daily location data on movement trends over time by state for all 50 states and the District of Columbia in 6 location categories: retail and recreation, grocery stores and pharmacies, parks, transit stations, workplaces, and residences. We compared the outcome of interest in states that adopted COVID-19-related policies with states that did not adopt such policies, before and after these policies took effect during February 15-April 25, 2020.
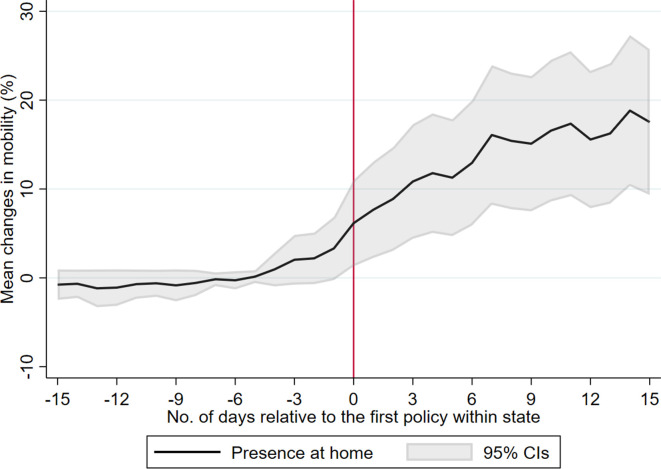
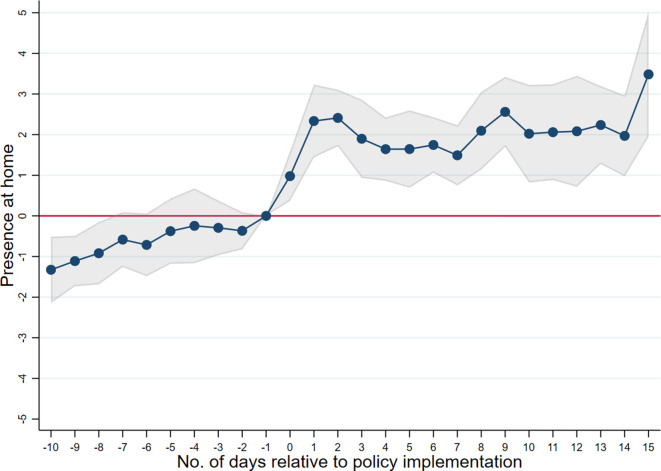
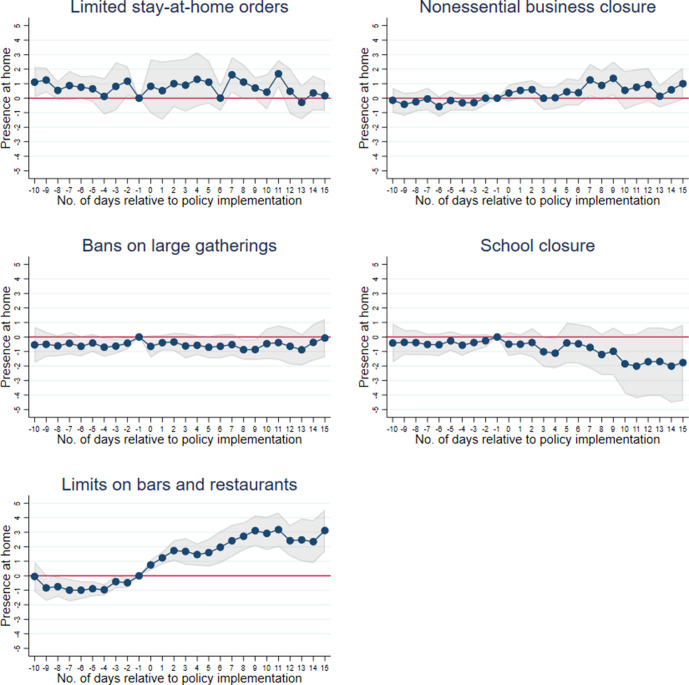
Results: Statewide stay-at-home orders had the strongest effect on reducing out-of-home mobility and increased the time people spent at home by an estimated 2.5 percentage points (15.2%) from before to after policies took effect. Limits on restaurants and bars ranked second and resulted in an increase in presence at home by an estimated 1.4 percentage points (8.5%). The other 4 policies did not significantly reduce mobility.
Conclusion: Statewide stay-at-home orders and limits on bars and restaurants were most closely linked to reduced mobility in the early stages of the COVID-19 pandemic, whereas the potential benefits of other such policies may have already been reaped from voluntary social distancing. Further research is needed to understand how the effect of social-distancing policies changes as voluntary social distancing wanes during later stages of a pandemic.
Keywords: COVID-19; difference-in-differences; social distancing; stay-at-home.
Conflict of interest statement
Figures
References
-
- Chudik A., Pesaran MH., Rebucci A. Voluntary and Mandatory Social Distancing: Evidence on COVID-19 Exposure Rates From Chinese Provinces and Selected Countries. NBER Working Paper No. 27039. National Bureau of Economic Research; 2020.
MeSH terms
LinkOut - more resources
Full Text Sources
Other Literature Sources
Medical
Miscellaneous
