. 2020 Dec 1;11(48):4465-4478.
doi: 10.18632/oncotarget.27831.

Benzophenone-3 promotion of mammary tumorigenesis is diet-dependent

Affiliations

Benzophenone-3 promotion of mammary tumorigenesis is diet-dependent

Anastasia Kariagina et al. Oncotarget. .

Abstract

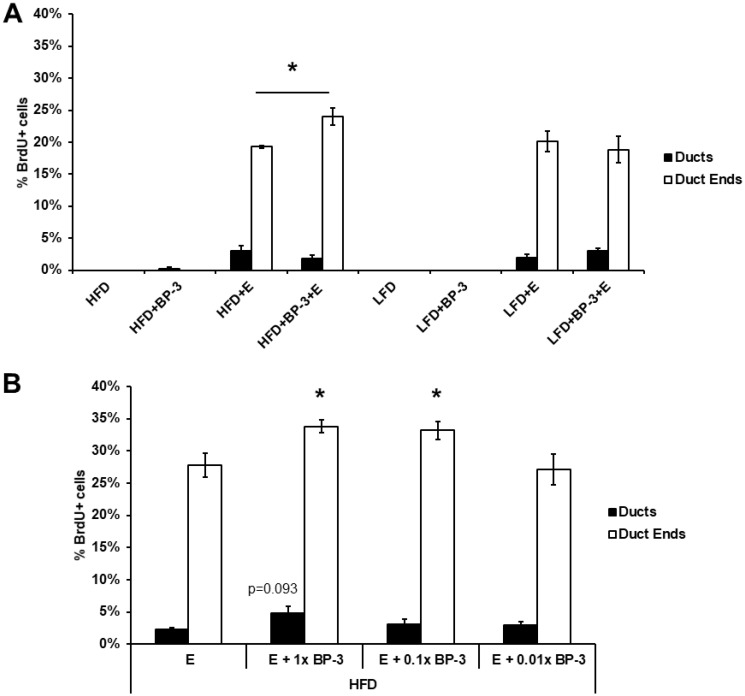
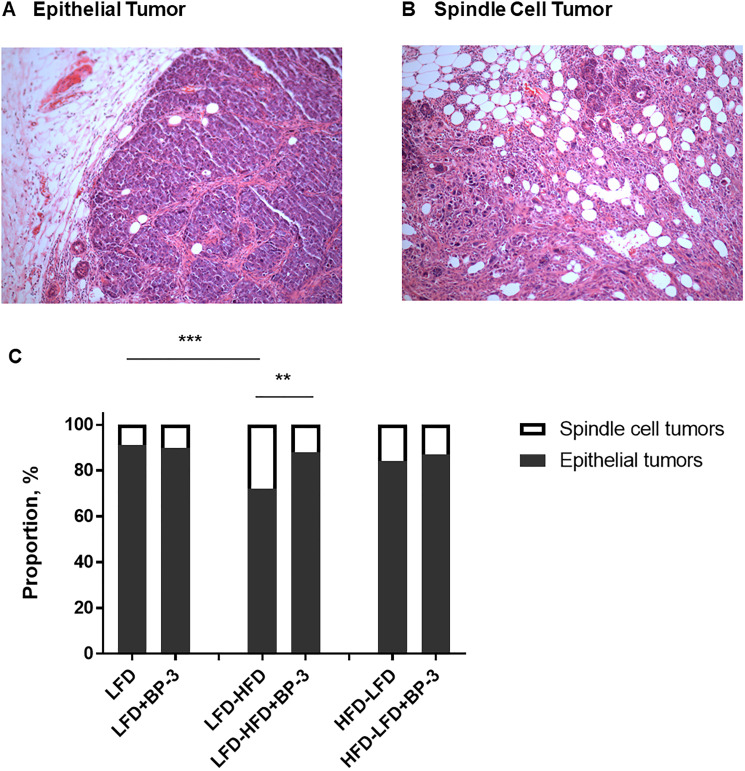
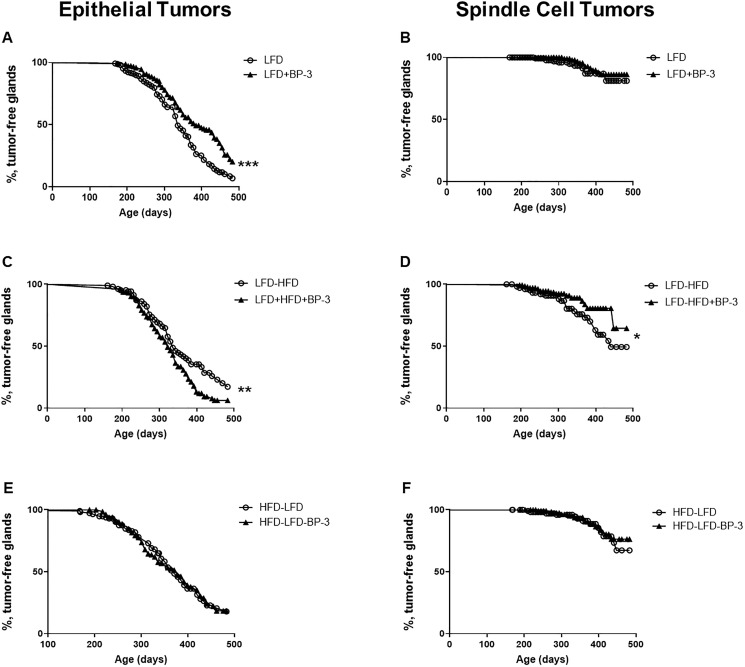
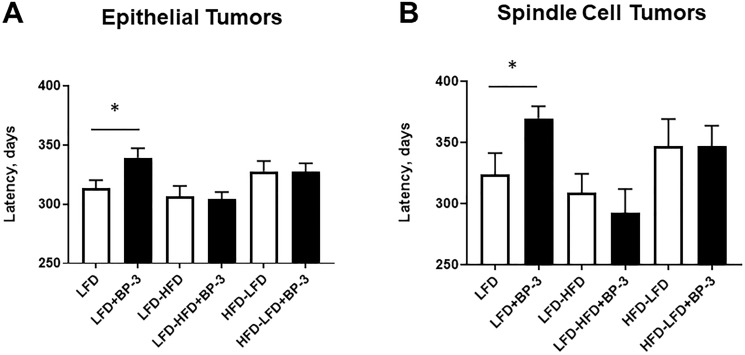
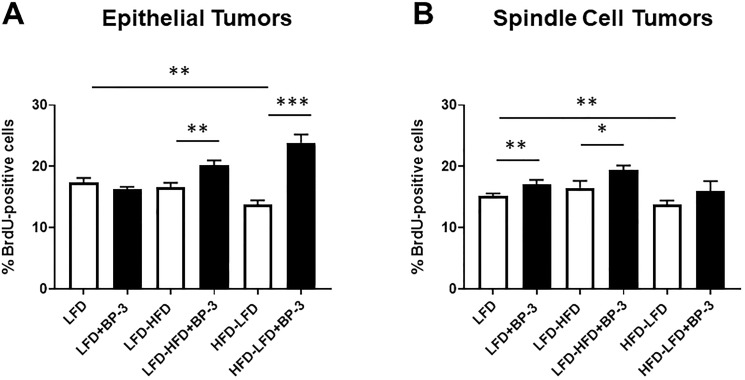
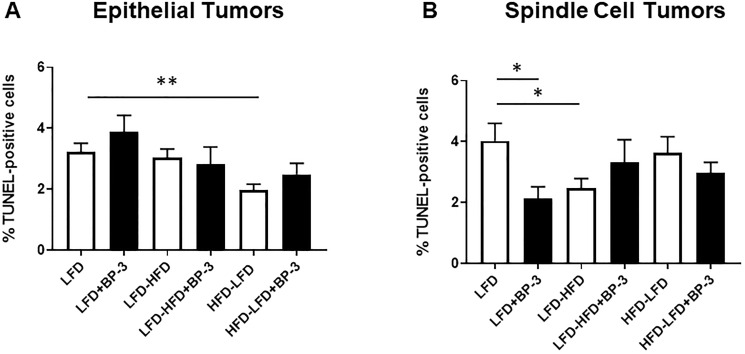
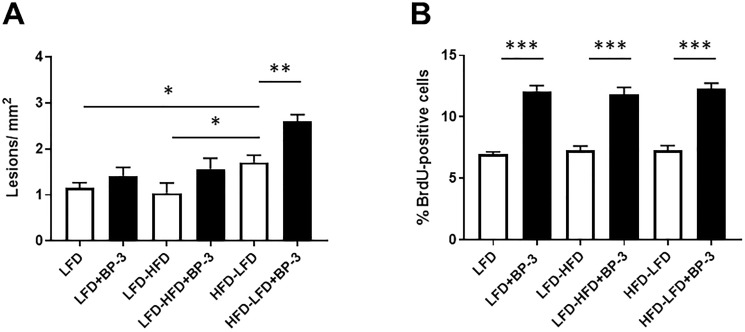
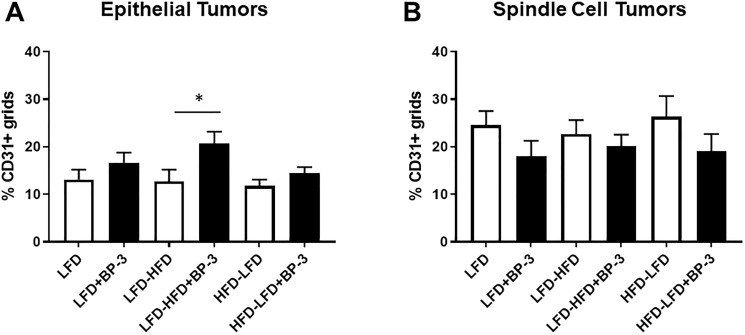
Benzophenone-3 is a putative endocrine disrupting chemical and common ingredient in sunscreens. The potential of endocrine disrupting chemicals to act as agonists or antagonists in critical hormonally regulated processes, such as mammary gland development and mammary tumorigenesis, demands evaluation of its potential in promoting breast cancer. This study identifies the effects of BP-3 on mammary tumorigenesis with high-fat diet during puberty versus adulthood in Trp53-null transplant BALB/c mice. Benzophenone-3 exposure yielded levels in urine similar to humans subjected to heavy topical sunscreen exposure. Benzophenone-3 was protective for epithelial tumorigenesis in mice fed lifelong low-fat diet, while promotional for epithelial tumorigenesis in mice fed adult high-fat diet. Benzophenone-3 increased tumor cell proliferation, decreased tumor cell apoptosis, and increased tumor vascularity dependent on specific dietary regimen and tumor histopathology. Even in instances of an ostensibly protective effect, other parameters suggest greater risk. Although benzophenone-3 seemed protective on low-fat diet, spindle cell tumors arising in these mice showed increased proliferation and decreased apoptosis. This points to a need for further studies of benzophenone-3 in both animal models and humans as a potential breast cancer risk factor, as well as a more general need to evaluate endocrine disrupting chemicals in varying dietary contexts.

Keywords: benzophenone-3; breast cancer; dietary animal fat; mammary tumorigenesis; oxybenzone.


Conflict of interest statement

CONFLICTS OF INTEREST Authors have no conflicts of interest to declare.

Figures

Figure 1
Figure 1. BP-3 enhances estrogen-stimulated mammary gland proliferation in pubertal mice fed HFD.
(A) Pubertal OVX BALB/c mice were placed on LFD or HFD with and without BP-3, and then treated with E2 or control for 5 d. The pubertal mice fed HFD plus BP-3 showed higher proliferation in response to E2 than did mice fed HFD alone. (B) Pubertal OVX BALB/c mice BP-3 were placed on HFD and treated for 5 d with E2 (E) or E2 + BP-3 (1.0×, 0.1×, 0.01× 70 mg/kg BW). BP-3 augmented the proliferative response to E2 in both ducts and duct ends at the standard dose and in duct ends at the 0.1 dose. The values presented are means +/– SEM. Significance of differences between samples was assessed using an unpaired two-tailed Student’s t-test. * p < 0.05.
Figure 2
Figure 2. BP-3 increased the proportion of epithelial tumors in mice fed an adult-restricted HFD.
(A) Representative H&E stained tissue section of an epithelial tumor. Magnification is 10×. (B) Representative H&E stained tissue section of a spindle cell tumor. Magnification is 10×. (C) Proportion of epithelial and spindle cell tumors across dietary and BP-3 treatments. Significance of differences between tumor groups was assessed using Fisher’s Exact Test. ** p < 0.01; *** p < 0.001.
Figure 3
Figure 3. BP-3 reduced epithelial tumorigenesis on LFD, but promoted epithelial tumorigenesis on an adult-restricted HFD.
Kaplan-Meier plots were determined for BALB/c mice receiving Trp53-null mammary transplants and fed a lifelong LFD (LFD; n = 170 glands; 99 mice), a lifelong LFD plus lifelong BP-3 (LFD+BP-3; n = 152 glands; 89 mice), an adult-restricted HFD (LFD-HFD, n = 108 gland; 65 mice), an adult-restricted HFD plus lifelong BP-3 (LFD-HFD+BP-3, n = 147 glands; 82 mice), a puberty-restricted HFD (HFD-LFD, n = 115 glands; 66 mice), and a puberty-restricted HFD plus lifelong BP-3 (HFD-LFD, n = 136 glands; 78 mice). The number of analyzed glands is less than half the number of mice because of failed transplantation in one gland or the death of some mice after the first tumor had been removed. (A) LFD versus LFD+BP-3; epithelial tumors. (B) LFD versus LFD+BP-3; spindle cell tumors. (C) LFD-HFD versus LFD-HFD+BP-3; epithelial tumors. (D) LFD-HFD versus LFD-HFD+BP-3; spindle cell tumors. (E) HFD-LFD versus HFD-LFD+BP-3; epithelial tumors. (F) HFD-LFD versus HFD-LFD+BP-3; spindle cell tumors. Significance of differences between plots was assessed by the log-rank Mantel–Cox test. * p < 0.05; ** p < 0.01; *** p < 0.001.
Figure 4
Figure 4. BP-3 treatment increased latency of both epithelial and spindle cell tumors in mice fed LFD.
Mean latency of epithelial tumors (A) and spindle cell tumors (B) are compared by dietary and BP-3 treatment. Numbers of tumors per treatment group: LFD: 116 epithelial, 11 spindle cell; LFD+BP-3: 94 epithelial, 10 spindle; LFD-HFD: 63 epithelial, 25 spindle cell; LFD-HFD+BP-3: 107 epithelial, 15 spindle cell; HFD-LFD: 70 epithelial; 13 spindle cell; HFD-LFD+BP-3: 84 epithelial, 13 spindle cell. The values presented are means +/– SEM. Significance of differences between treatment groups was assessed using the Mann-Whitney U test. * p < 0.05.
Figure 5
Figure 5. BP-3 treatment increased tumor proliferation in a manner dependent on both diet and histological type.
Tumors are grouped by epithelial (A) and spindle cell (B) histology. Epithelial tumors: LFD (n = 8); LFD+BP-3 (n = 10); LFD-HFD (n = 7); LHF-HFD+BP-3 (n = 7); HFD-LFD (n = 10); HFD-LFD+BP-3 (n = 13). Spindle cell tumors: LFD (n = 8); LFD+BP-3 (n = 6); LFD-HFD (n = 8); LFD-HFD+BP-3 (n = 8); HFD-LFD (n = 9); HFD-LFD+BP-3 (n = 10). The values presented are means +/– SEM. Significance of differences between samples was assessed using an unpaired two-tailed Student’s t-test. * p < 0.05; ** p < 0.01; *** p < 0.001.
Figure 6
Figure 6. BP-3 treatment decreased apoptosis in spindle cell tumors arising in mice fed LFD.
Tumors are grouped by epithelial (A) and spindle cell (B) histology. Epithelial tumors: LFD (n = 8); LFD+BP-3 (n = 9); LFD-HFD (n = 9); LHF-HFD+BP-3 (n = 4); HFD-LFD (n = 10); HFD-LFD+BP-3 (n = 7). Spindle cell tumors: LFD (n = 10); LFD+BP-3 (n = 5); LFD-HFD (n = 8); LFD-HFD+BP-3 (n = 6); HFD-LFD (n = 6); HFD-LFD+BP-3 (n = 6). The values presented are means +/– SEM. Significance of differences between samples was assessed using an unpaired two-tailed Student’s t-test. * p < 0.05; ** p < 0.01.
Figure 7
Figure 7. No association between effects of BP-3 on epithelial proliferative lesions, mammary epithelial proliferation, and tumorigenesis.
(A). Epithelial proliferative lesions are increased by BP-3 treatment in mice fed HFD-LFD. Epithelial proliferative lesions were quantitated in whole mount preparations of the mammary glands of mice at 26 weeks of age across treatment groups. LFD (n = 7); LFD+BP-3 (n = 8); LFD-HFD (n = 7); LFD-HFD+BP-3 (n = 7); HFD-LFD (n = 7); HFD-LFD+BP-3 (n = 7). (B) BP-3 treatment increased mammary epithelial proliferation across all dietary regimens. LFD (n = 5); LFD+BP-3 (n = 5); LFD-HFD (n = 7); LFD-HFD+BP-3 (n = 5); HFD-LFD (n = 5); HFD-LFD+BP-3 (n = 5). The values presented are means +/– SEM. Significance of differences between samples was assessed using an unpaired two-tailed Student’s t-test. * p < 0.05; ** p < 0.01; *** P < 0.001.
Figure 8
Figure 8. BP-3 treatment increased the vascularization of epithelial tumors in mice fed LFD-HFD.
(A) Vascularization was assessed in epithelial tumors across the treatment groups by CD31 staining of blood vessels. LFD (n = 10); LFD+BP-3 (n = 10); LFD-HFD (n = 8); LFD-HFD+BP-3 (n = 9); HFD-LFD (n = 9); HFD-LFD+BP-3 (n = 9). (B) Vascularization was assessed in spindle cell tumors. LFD (n = 10); LFD+BP-3 (n = 9); LFD-HFD (n = 10); LFD-HFD+BP-3 (n = 9); HFD-LFD (n = 8); HFD-LFD+BP-3 (n = 10). The values presented are means +/– SEM. Significance of differences between samples was assessed using an unpaired two-tailed Student’s t-test. * p < 0.05.

Similar articles

Cited by

References

    1. Bernstein L. Epidemiology of endocrine-related risk factors for breast cancer. J Mammary Gland Biol Neoplasia. 2002; 7:3–15. 10.1023/a:1015714305420. - DOI - PubMed
    1. Campagnoli C, Abbà C, Ambroggio S, Peris C. Pregnancy, progesterone and progestins in relation to breast cancer risk. J Steroid Biochem Mol Biol. 2005; 96:95–108. 10.1016/j.jsbmb.2005.02.014. - DOI - PubMed
    1. Fendrick JL, Raafat AM, Haslam SZ. Mammary gland growth and development from the postnatal period to postmenopause: ovarian steroid receptor ontogeny and regulation in the mouse. J Mammary Gland Biol Neoplasia. 1998; 3:7–22. 10.1023/a:1018766000275. - DOI - PubMed
    1. Diamanti-Kandarakis E, Bourguignon JP, Giudice LC, Hauser R, Prins GS, Soto AM, Zoeller RT, Gore AC. Endocrine-disrupting chemicals: an Endocrine Society scientific statement. Endocr Rev. 2009; 30:293–342. 10.1210/er.2009-0002. - DOI - PMC - PubMed
    1. Zhao Y, Tan YS, Aupperlee MD, Langohr IM, Kirk EL, Troester MA, Schwartz RC, Haslam SZ. Pubertal high fat diet: effects on mammary cancer development. Breast Cancer Res. 2013; 15:R100. 10.1186/bcr3561. - DOI - PMC - PubMed