. 2021 Feb 22;56(4):557-568.e6.
doi: 10.1016/j.devcel.2020.12.015. Epub 2021 Jan 4.

Single-cell RNA sequencing of developing maize ears facilitates functional analysis and trait candidate gene discovery

Affiliations

Single-cell RNA sequencing of developing maize ears facilitates functional analysis and trait candidate gene discovery

Xiaosa Xu et al. Dev Cell. .

Abstract

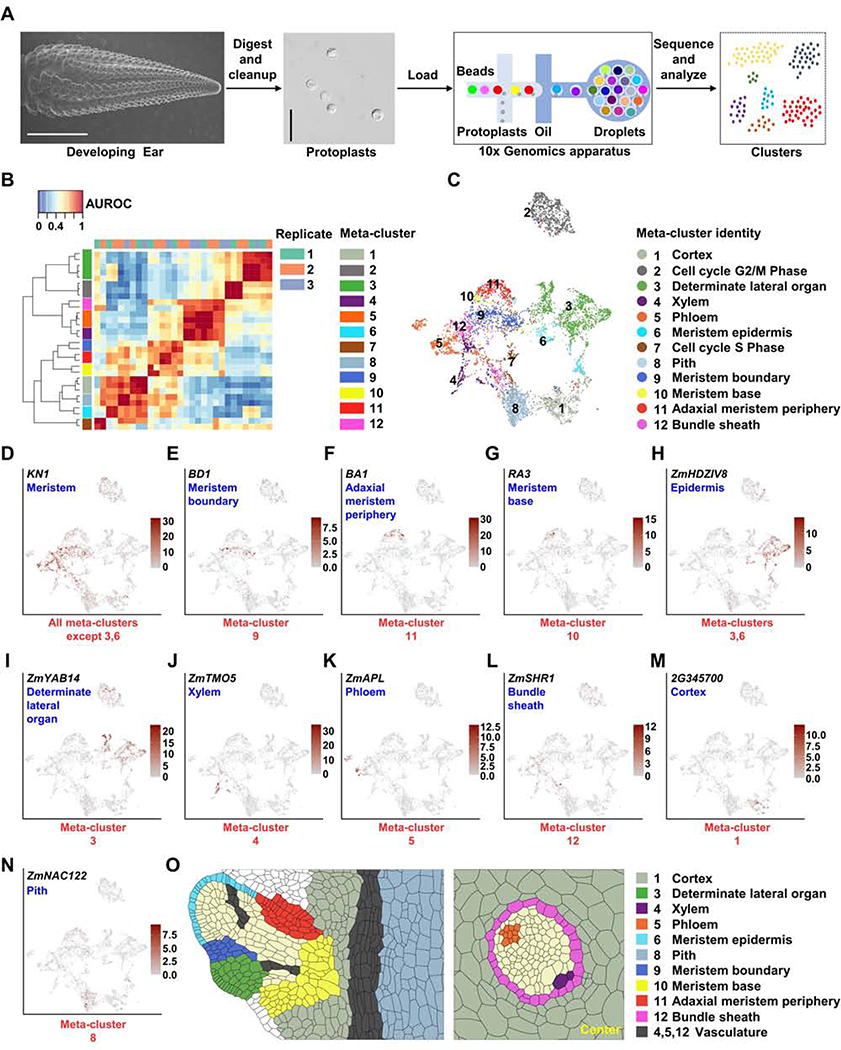
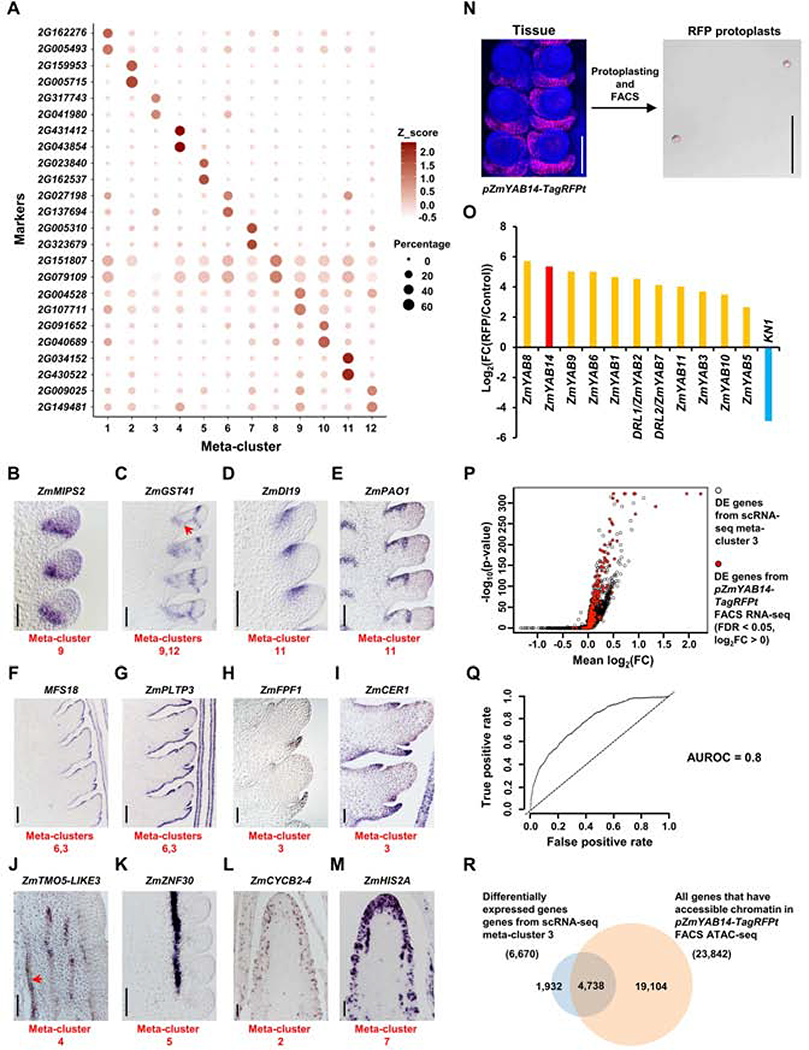
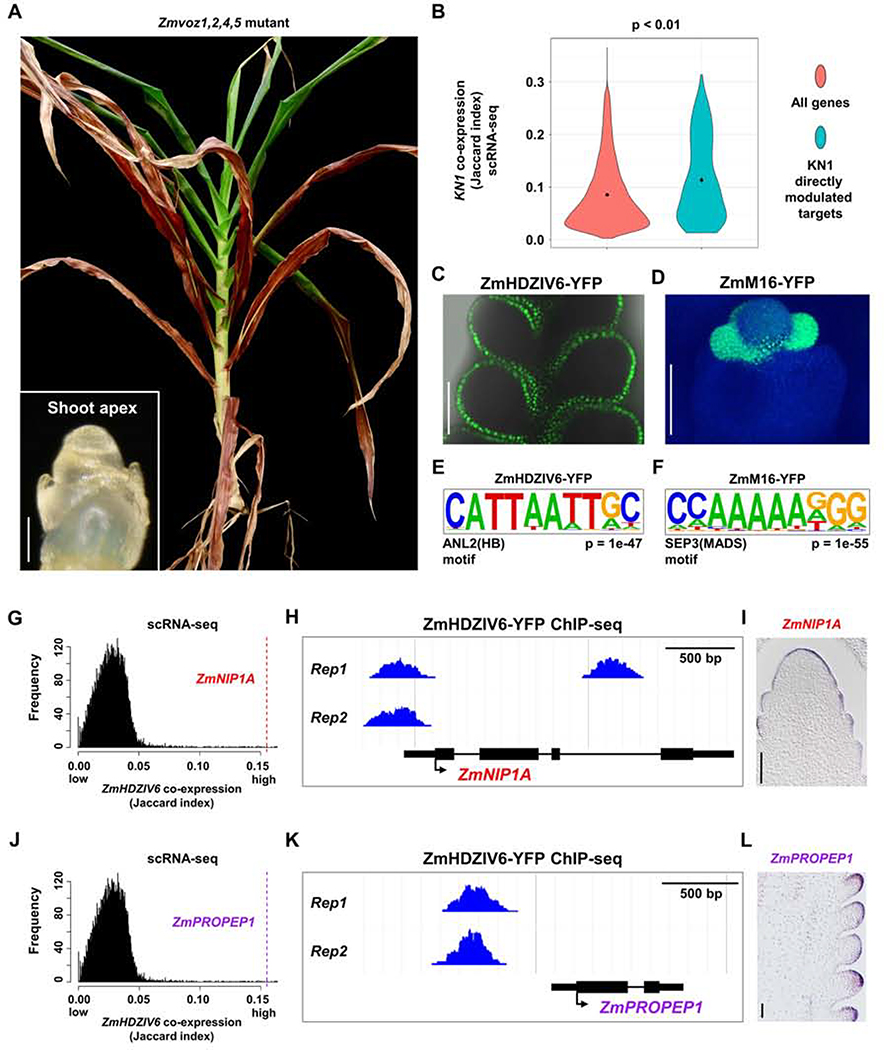
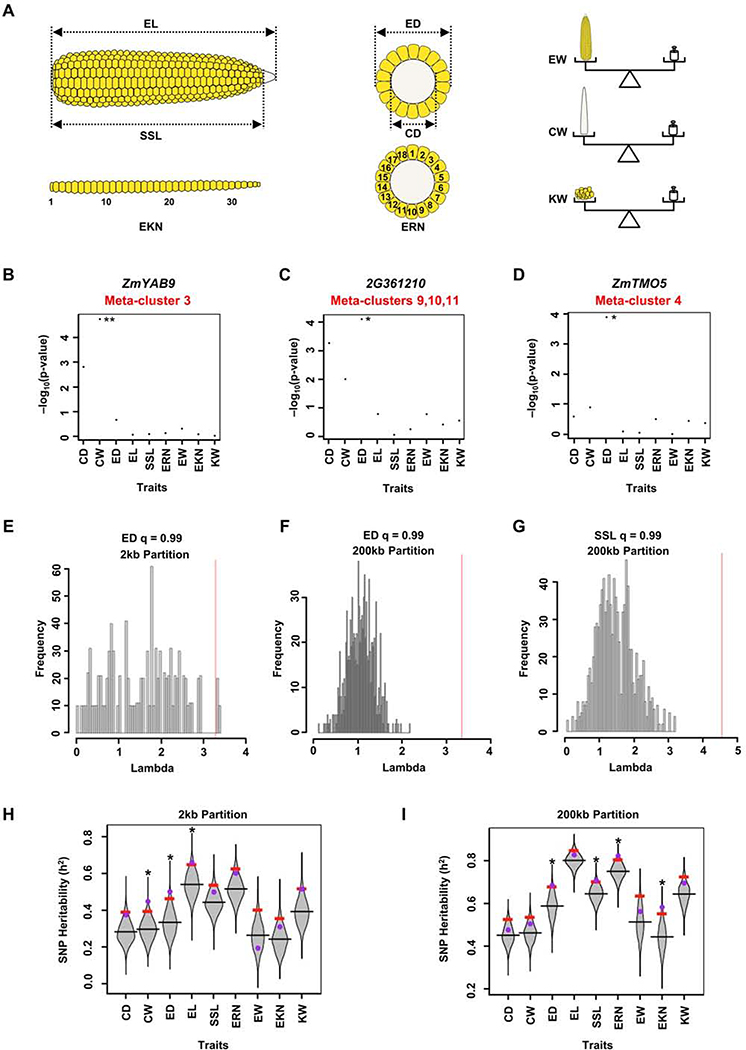
Crop productivity depends on activity of meristems that produce optimized plant architectures, including that of the maize ear. A comprehensive understanding of development requires insight into the full diversity of cell types and developmental domains and the gene networks required to specify them. Until now, these were identified primarily by morphology and insights from classical genetics, which are limited by genetic redundancy and pleiotropy. Here, we investigated the transcriptional profiles of 12,525 single cells from developing maize ears. The resulting developmental atlas provides a single-cell RNA sequencing (scRNA-seq) map of an inflorescence. We validated our results by mRNA in situ hybridization and by fluorescence-activated cell sorting (FACS) RNA-seq, and we show how these data may facilitate genetic studies by predicting genetic redundancy, integrating transcriptional networks, and identifying candidate genes associated with crop yield traits.

Keywords: GWAS; developmental networks; maize ear; meristem; scRNA-seq; trait genes.


Conflict of interest statement

Declaration of interests The authors declare no competing interests.

Figures

Figure 1:
Figure 1:. Isolation of Maize Ear Protoplasts to Construct a Single-Cell Transcriptomic Atlas.
(A) Experimental design, the first panel shows a scanning electron microscope image of a 5–10mm developing ear (scale bar = 2mm), second panel image of ear protoplasts, scale bar = 50μm. (B) MetaNeighbor identifies 12 reproducible meta-clusters (left color blocks) across three biological replicates (top color blocks) of single-cell RNA-seq datasets. (C) 12 meta-clusters displayed by an integrated Uniform Manifold Approximation and Projection (UMAP) plot in two dimensions, with each dot representing a cell. (D-N) UMAP plots of marker genes predicting the identities of meta-clusters, with color scale indicating normalized expression level. (D) KN1, meristem, all meta-clusters except 3 and 6; (E) BD1, meristem boundary, meta-cluster 9; (F) BA1, adaxial meristem periphery, meta-cluster 11; (G) RA3, meristem base, meta-cluster 10; (H) ZmHDZIV8, epidermis, meta-clusters 6 and part of 3; (I) ZmYAB14, determinate lateral organ, meta-cluster 3; (J) ZmTMO5, xylem, meta-cluster 4; (K) ZmAPL, phloem, meta-cluster 5; (L) ZmSHR1, bundle sheath, meta-cluster 12; (M) GRMZM2G345700 (2G345700), cortex, meta-cluster 1; (N) ZmNAC122, pith, meta-cluster 8. (O) Sketches of longitudinal section of a spikelet meristem (left panel) and transverse section of vascular bundle (right panel) showing cell/domain identities in scRNA-seq meta-clusters.
Figure 2:
Figure 2:. Validation of scRNA-seq by mRNA in situ and FACS RNA-seq.
(A) The top two marker genes of each meta-cluster are shown in dot plots with circle size indicating the percentage of cells expressing the marker and color representing Z_scored expression value. (B-M) mRNA in situ of meta-clusters marker genes validates the predicted identities: (B) ZmMIPS2, meristem boundary; (C) ZmGST41, meristem boundary (meta-cluster 9) and bundle sheath (meta-cluster 12, red arrow); (D-E) ZmDI19 (D) and ZmPAO1 (E), adaxial meristem periphery; (F-G) MFS18 (F) and ZmPLTP3 (G), meristem epidermis (meta-cluster 6) and determinate lateral organ (meta-cluster 3) epidermis; (H-I) ZmFPF1 (H) and ZmCER1 (I), determinate lateral organ; (J) ZmTMO5-LIKE3, xylem (red arrow indicates xylem vessels); (K) ZmZNF30, phloem. (L) ZmCYCB2–4, cell cycle G2/M phase; (M) ZmHIS2A, cell cycle S phase. Scale bar = 100μm. (N) Collection of RFP protoplasts from pZmYAB14-TagRFPt reporter line using FACS. Scale bar = 100μm. Three biological replicates are collected for FACS RNA-seq. One biological replicate is collected for FACS ATAC-seq. (O) Log2(fold change(FC)) of determinate lateral organ domain enriched markers, ZmYAB genes, and depleted marker, KN1, between RFP and total control protoplasts (Control) in FACS RNA-seq. (P) Volcano plot with 1-sided test positions the hits of enriched markers from pZmYAB14-TagRFPt FACS RNA-seq (red dots) on the ranked list of scRNA-seq differentially expressed (DE) genes from meta-cluster 3 (black circles). X-axis indicates the mean log2(FC) of DE genes between meta-cluster 3 and all other meta-clusters. Y-axis indicates corresponding −log10(p-value). (Q) pZmYAB14-TagRFPt FACS RNA-seq and scRNA-seq meta-cluster 3 have concordant differential gene expression patterns with Area Under the Receiver Operating Characteristics (AUROC) score = 0.8 (indicated by curved line; dashed line indicates the null (AUROC score = 0.5)). Axes indicates the true and false positive rate, the proportion of pZmYAB14-TagRFPt FACS RNA-seq enriched markers that do or do not match to scRNA-seq meta-cluster 3 enriched markers, respectively. (R) meta-cluster 3 DE genes are enriched in open chromatin in pZmYAB14-TagRFPt FACS sorted cells, see text for details.
Figure 3:
Figure 3:. scRNA-seq Can Predict Genetic Redundancy and Aid in Predicting Transcriptional Regulatory Networks.
(A) Maize plant with CRISPR/cas9 knockout of four ZmVOZ paralogs fails to transition to flowering, as shown by two month old shoot apex (left bottom panel, scale bar = 100μm), and a 6 month old plant that lacks ears or tassel. (B) Directly modulated transcriptional targets of KN1 are significantly co-expressed with KN1 at the single-cell level; all maize genes are used as control (p < 0.01, one-way ANOVA with Tukey’s HSD). (C-D) Expression of TF translational fusion lines, ZmHDZIV6-YFP (C, merge of YFP channel and bright field) and ZmM16-YFP (D, merge of YFP and DAPI channels), used for two biological replicates of ChIP-seq. Scale bar = 100μm. (E-F) Expected motifs are significantly over-represented in bound peaks of ZmHDZIV6 (E) or ZmM16 (F). (G, J) ZmHDZIV6 candidate modulated targets, ZmNIP1A (G) and ZmPROPEP1 (J) are highly co-expressed with ZmHDZIV6 in scRNA-seq (Jaccard index = 0.155 for both targets). (H, K) ZmHDZIV6 bound peaks in ZmNIPA1 (H) and ZmPROPEP1 (K). (I, L) ZmNIP1A (I) and ZmPROPEP1 (L) are specifically expressed in the epidermis, by mRNA in situ. Scale bar = 100μm.
Figure 4:
Figure 4:. scRNA-seq Marker Genes Are Associated with Maize Ear Traits.
(A) Diagrams of 9 different ear traits measured for GWAS analysis: Ear Length (EL), Seed Set Length (SSL), Ear Rank Number (EKN), Ear Diameter (ED), Cob Diameter (CD), Ear Row Number (ERN), Ear Weight (EW), Cob Weight (CW), Kernel Weight (20 Seeds) (KW). (B-D) Targeted GWAS using SNPs in or within 2kb of genes reveals that scRNA-seq marker gene ZmYAB9, has significant SNPs for ear weight (B), and two marker genes GRMZM2G361210 (2G361210) (C) and ZmTMO5 (D) have significant SNPs for ear diameter. ** FDR threshold of 0.05, * FDR threshold of 0.1. Y-axis indicates the –log10(p-value) (Table S3). (E-G) Lambda values of scRNA-seq marker genes (red lines) are greater than two standard deviations from mean lambda values of 1,000 random gene sets (histogram distributions) for ear diameter (2kb partition, E, 200kb partition, F), and for seed set length trait (200kb partition, G). Lambda values are reported in Table S3. (H-I) Distributions of SNP heritability (ℎ2) using 2kb (H) or 200kb (I) partitions; ℎ2 values for scRNA-seq marker genes (purple dots) for the given traits (*) are greater than the top 5% permuted ℎ2 values (red bars) using 1000 random subsets of maize genes (grey violin plots). ℎ2 values are reported in Table S3.

References

    1. Aerts N, de Bruijn S, van Mourik H, Angenent GC, and van Dijk ADJ (2018). Comparative analysis of binding patterns of MADS-domain proteins in Arabidopsis thaliana. BMC plant biology 18, 131–131. - PMC - PubMed
    1. Ballouz S, Weber M, Pavlidis P, and Gillis J (2017). EGAD: ultra-fast functional analysis of gene networks. Bioinformatics 33, 612–614. - PMC - PubMed
    1. Bartlett ME, Williams SK, Taylor Z, DeBlasio S, Goldshmidt A, Hall DH, Schmidt RJ, Jackson DP, and Whipple CJ (2015). The Maize PI/GLO Ortholog Zmm16/sterile tassel silky ear1 Interacts with the Zygomorphy and Sex Determination Pathways in Flower Development. Plant Cell 27, 3081–3098. - PMC - PubMed
    1. Bolduc N, Yilmaz A, Mejia-Guerra MK, Morohashi K, O’Connor D, Grotewold E, and Hake S (2012). Unraveling the KNOTTED1 regulatory network in maize meristems. Genes & development 26, 1685–1690. - PMC - PubMed
    1. Bolger AM, Lohse M, and Usadel B (2014). Trimmomatic: a flexible trimmer for Illumina sequence data. Bioinformatics 30, 2114–2120. - PMC - PubMed

Publication types

MeSH terms

LinkOut - more resources