. 2021 Jan 1;9(1):24.
doi: 10.3390/biomedicines9010024.

Subcutaneous Implantation Assessment of New Calcium-Silicate Based Sealer for Warm Obturation

Affiliations

Subcutaneous Implantation Assessment of New Calcium-Silicate Based Sealer for Warm Obturation

João Miguel Santos et al. Biomedicines. .

Abstract

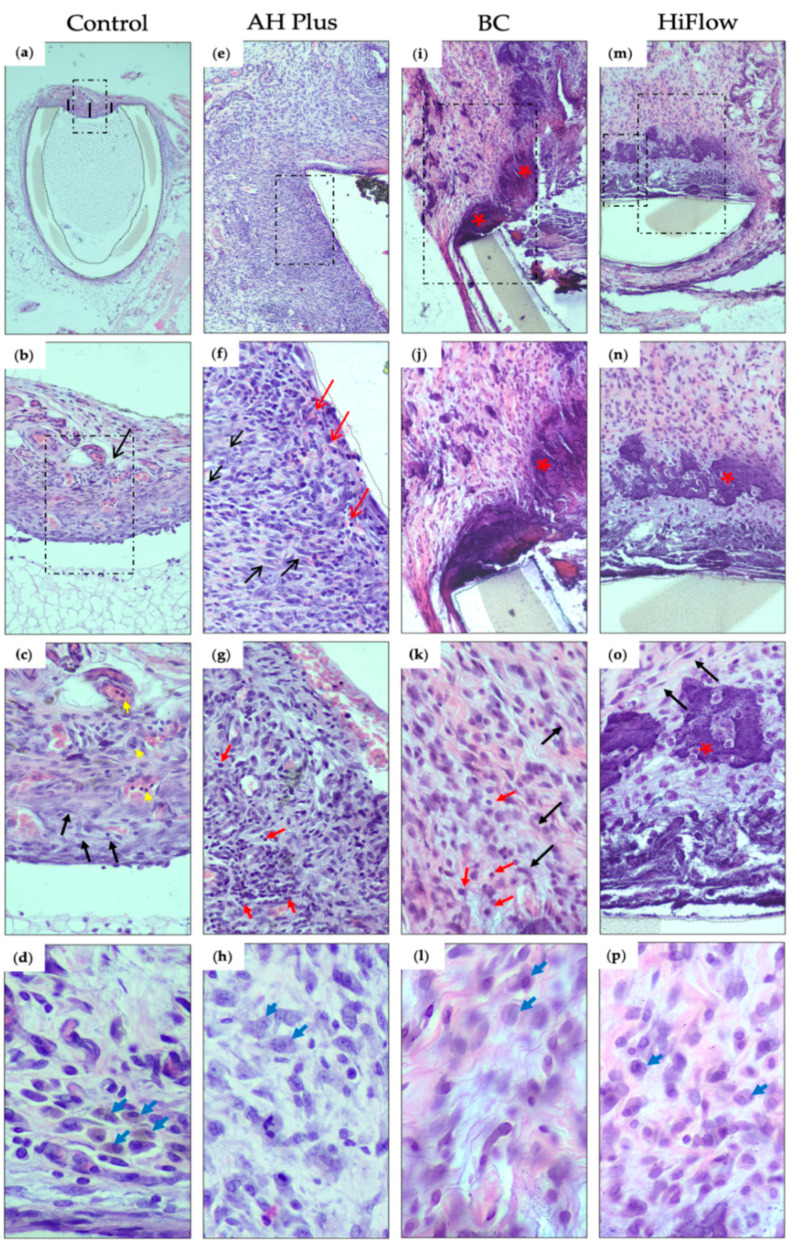
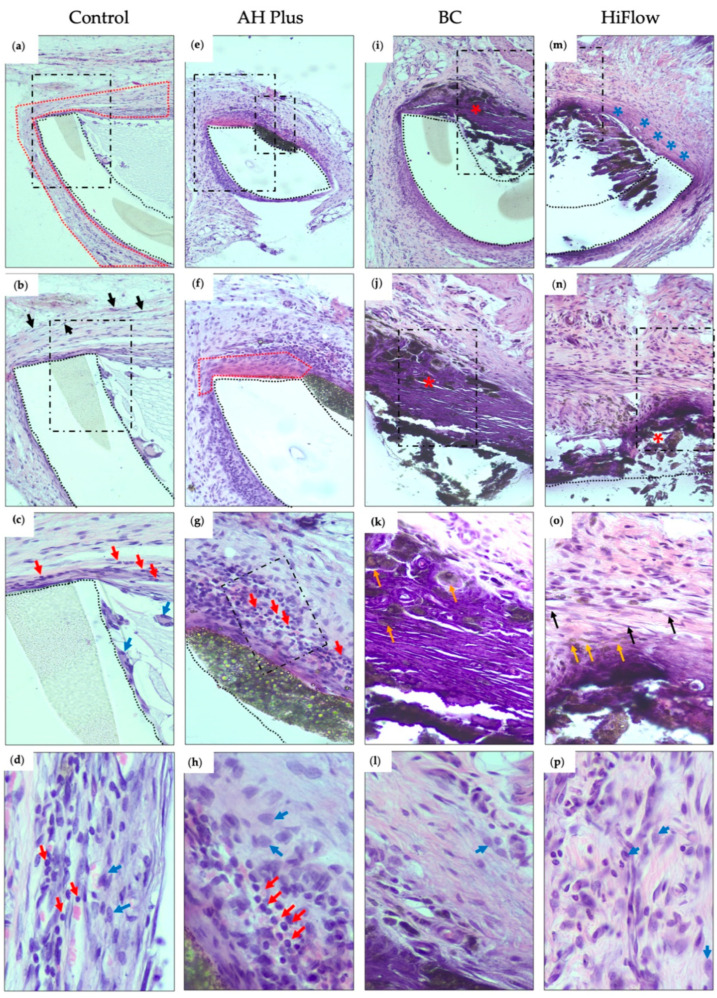
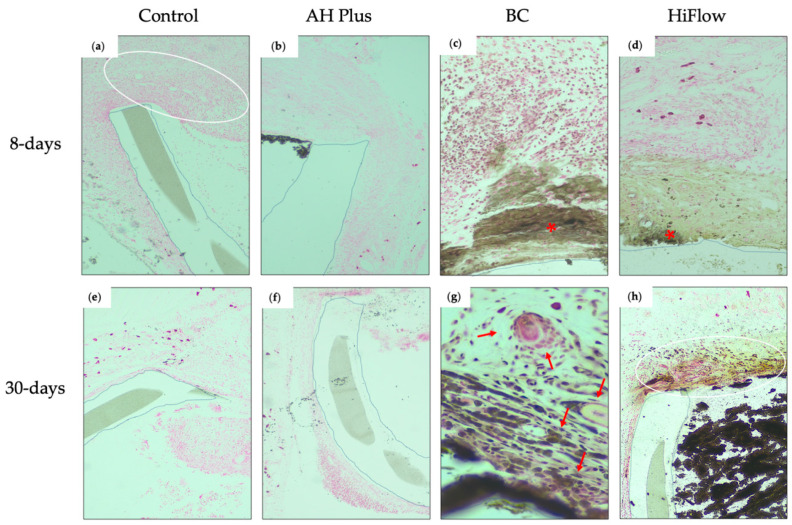
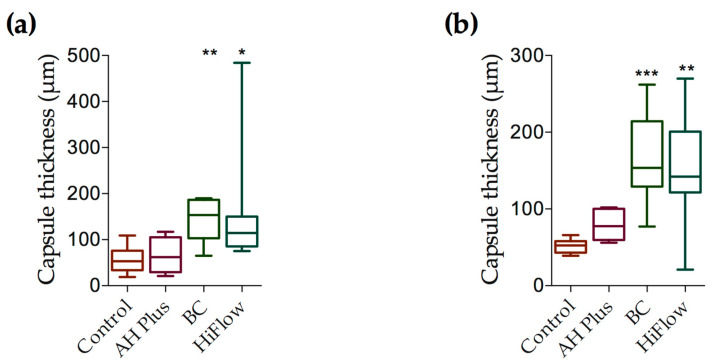
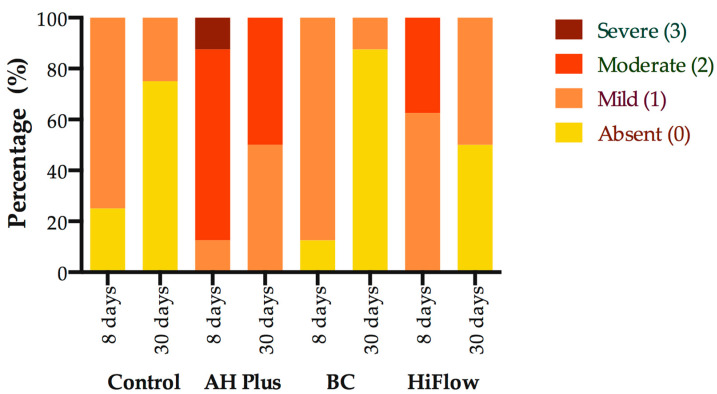
Calcium silicate-based sealers were recently introduced as a new class of endodontic sealers, with potential further benefits due to their bioactivity. The aim of this study was to evaluate the biocompatibility of two new hydraulic calcium silicate-based sealers, TotalFill BC Sealer (FKG, La Chaux-des-Fonds, Switzerland) and TotalFill BC Sealer HiFlow (FKG, La Chaux-des-Fonds, Switzerland) through subcutaneous implantation in connective tissue of rats. Subcutaneous implantation was performed in 16 young Wistar rats. Four polyethylene tubes were implanted in each animal, one empty to serve as a control, and three filled with tested sealers: AH Plus as reference (Dentsply DeTrey, Konstanz, Germany), TotalFill BC Sealer (BC) and TotalFill BC Sealer HiFlow (HiFlow). Eight rats were euthanized at 8 days and the remaining eight at 30 days. Hematoxylin-eosin staining was used to score the inflammatory reaction, macrophage infiltrate and to measure the thickness of the fibrous capsule. von Kossa staining was performed to evaluate the mineralization level. Kruskal-Wallis test followed by Dunn's post hoc test was used to analyze non-parametric data. To analyze the influence of the implantation time within each material, a Mann-Whitney U test was performed. At eight days post-implantation, AH Plus induced a more intense inflammatory reaction when compared both with the control (p ≤ 0.001) and BC (p ≤ 0.01). HiFlow presented a higher score of macrophage infiltrate than control (p ≤ 0.01) and BC (p ≤ 0.05). The fibrous capsule thickness in this period was significantly higher for the BC group when compared to control (p ≤ 0.01) and AH Plus (p ≤ 0.05). The mineralization potential was higher for the HiFlow group when compared with the control (p ≤ 0.001) and AH Plus (p ≤ 0.001). At 30 days post-implantation, the score for the inflammatory reaction remained higher for the AH Plus group when compared both to control (p ≤ 0.01) and BC (p ≤ 0.001). The macrophage infiltrate of the HiFlow was significantly higher than control (p ≤ 0.001) and AH Plus groups (p ≤ 0.01), additionally, the fibrous capsule of the BC (p ≤ 0.001) and HiFlow (p ≤ 0.01) groups were both thicker than control. Mineralization potential was observed only on BC (p ≤ 0.05) and HiFlow groups (p ≤ 0.001), when compared to control). BC exhibited the best biocompatibility performance of all tested sealers and HiFlow provided the greatest induction of mineralized tissues. Both TotalFill BC Sealer and TotalFill BC Sealer HiFlow are biocompatible and show potential bioactivity when implanted in the subcutaneous tissue. Bioactivity was not found in AH Plus.

Keywords: bioactivity potential; biocompatibility; calcium silicate-based sealers; endodontic sealers; endodontics; subcutaneous implantation.


Conflict of interest statement

The authors have stated explicitly that there are no conflicts of interest in connection with this article.

Figures

Figure 1
Figure 1
Hematoxylin and eosin histological sections of the interface tissue-sealer 8 days after subcutaneous implantation (dashed boxes mark the view of the subsequent image): (a) control group, evidencing the thin fibrous capsule at the interface between the host tissue and the polyethylene tube (demarcation with dotted lines), measured in 3 points (represented by the black lines) (40× magnification); (b) the fibrous capsule and mild inflammatory reaction (score 1) (black arrow) at the interface tissue-sealer (200×); (c) high magnification showing in detail the cellular population consisting of polymorphonuclear leukocytes (neutrophils) (yellow arrows) and fibroblasts (black arrows) (400×); (d) macrophages (blue arrows) (800×); (e) AH Plus group, showing granulation tissue surrounding the polyethylene tube (demarcation with dotted lines) (100×); (f) high magnification evidencing small congested neo-capillaries (red arrows), fibroblasts (black arrows) and moderate inflammatory reaction (score 2) (200×); (g) high magnification, showing the inflammation with mainly lymphocytes (red arrows) and neutrophils (400× hematoxylin and eosin (H&E)). (h) Macrophage infiltration (blue arrows) (800×); (i) TotalFill BC Sealer (BC) group, showing a fibrous capsule with calcification (bluish deposits) (red asterisk) (100×). (j) Higher magnification showing fibroblasts and some inflammatory cells (score 1) and the calcified area in more detail (red asterisk) (200×). (k) Fibroblasts (fusiform cells) (black arrows) in a stroma with some collagen fibrils and some lymphocytes (red arrow), plasma cells and rare neutrophils (400×). (l) Macrophage infiltration (blue arrows) (800×); (m) HiFlow group, revealing a fibrous capsule with calcification next to the polyethylene tube (100×); (n) higher magnification to observe fibroblasts, and inflammatory cells (score 1) next to the calcified area (red asterisk) (200×); (o) calcified area (red asterisk), with fibroblasts (fusiform cells) (black arrows) in an edematous and low collagenous stroma with lymphocytes (400×); (p) macrophage infiltration (800×). (n = 8).
Figure 2
Figure 2
Hematoxylin and eosin histological sections of the interface tissue-sealer 30 days after subcutaneous implantation (dashed boxes mark the view of the subsequent image): (a) control group, showing the polyethylene tube (demarcation with dotted lines) and content surrounded by a thin fibrous capsule (demarcation with dotted red line) (100×); (b) high magnification detailing the fibrous capsule with fibroblasts (black arrows) and some inflammatory cells (score 1) (200×); (c) high magnification showing fibroblasts in collagenous stroma and some lymphocytes (red arrows) and macrophages (blue arrows) adjacent to the polyethylene tube (400×); (d) inflammatory infiltrate (800×); (e) AH Plus group, showing fibro-inflammatory reaction around the polyethylene space and the material (100×); (f) higher magnification demonstrating a thin fibrous capsule (demarcation with dotted red line) and inflammatory cells (score 2) next to the polyethylene tube and the material (200×); (g) higher magnification to observe a thin bundle of fibroblasts surrounded and permeated by lymphocytes (red arrows) (400×); (h) macrophage (blue arrows) and lymphocytes (red arrow) infiltrate (800×); (i) BC group, revealing a thick fibrous capsule with extensive calcification (red asterisk) (100×); (j) higher magnification showing intense calcification (bluish aspect) in the fibrous capsule, and the sealer immediately adjacent to the calcified capsule (red asterisk) (200×); (k) higher magnification demonstrating birefringent material deposited in the fibrous and calcified capsule (orange arrow) (400× H&E). (l) Macrophage infiltrate (blue arrow) (800×); (m) HiFlow group, revealing the material inside the polyethylene tube, surrounded by a fibrous capsule (blue asterisk) and calcification of almost the entire capsule opening (100×); (n) high magnification with fragmentation of the calcified area/tissue (red asterisk) (200×); (o) high magnification revealing in detail the fibroblasts (fusiform cells—black arrow), collagen deposits and calcified deposits inside the fibrous capsule (orange arrow) (400×); (p) macrophage infiltration (blue arrow) (800×). (n = 8).
Figure 3
Figure 3
Histological images of the interface tissue-sealer (polyethylene tube demarcation with dotted lines) 8 and 30 days after subcutaneous implantation (von Kossa staining, magnification 200×). Eight days: (a) control group, fibrous capsule with fibroblasts and some inflammatory cells (score 1) without mineralization (white oval); (b) AH Plus, absence of mineralization around material and next to the fibro-inflammatory capsule; (c) BC group, area of mineralization in the capsule (brownish area) and von Kossa positive structures (red asterisk) surrounded by lymphocytes and some neutrophils; (d) HiFlow group, fibrous area with mild mineralization (right brownish area) and von Kossa positive structures (red asterisk) in the fibro-inflammatory capsule. Thirty days: (e) control group, absence of mineralization; (f) AH Pus, thin fibrous capsule without mineralization; (g) BC group, birefringent material and mild mineralization in between fibroblasts and surrounded by some inflammatory cells such as lymphocytes, plasma cells, rare neutrophils, and edema (red arrow); (h) HiFlow group, moderate mineralization (brownish aspect) in the thin fibrous capsule (white circle) and the sealer (black) inside the polyethylene tube. (n = 8 for 8 days; n = 8 for 30 days).
Figure 4
Figure 4
Fibrous capsule thickness (μm) at 8 and 30 days. (a) Fibrous capsule at 8 days comparing control to AH Plus, BC and HiFlow groups. Control n = 8; AH Plus n = 8; BC n = 8; HiFlow n = 8 (b) Fibrous capsule thickness at 30 days. Control n = 8; AH Plus n = 8; BC n = 8; HiFlow n = 8. Kruskal–Wallis test with Dunn’s post hoc test for multiple comparisons * p ≤ 0.05, ** p ≤ 0.01, *** p ≤ 0.001. Data are presented as means ± SEM.
Figure 5
Figure 5
Comparison of inflammatory reaction scores at 8 and 30 days for the control group and root canal sealers. Mann–Whitney U test for within group comparison, p ≤ 0.05. Data are presented as percentage of total. (n = 8 for 8 days; n = 8 for 30 days).

Similar articles

Cited by

References

    1. Friedman S., Torneck C.D., Komorowski R., Ouzounian Z., Syrtash P., Kaufman A. In vivo model for assessing the functional efficacy of endodontic filling materials and techniques. J. Endod. 1997;23:557–561. doi: 10.1016/S0099-2399(06)81120-9. - DOI - PubMed
    1. Ricucci D., Langeland K. Apical limit of root canal instrumentation and obturation, part 2. A histological study. Int. Endod. J. 1998;31:394–409. doi: 10.1046/j.1365-2591.1998.00183.x. - DOI - PubMed
    1. Ng Y.L., Mann V., Rahbaran S., Lewsey J., Gulabivala K. Outcome of primary root canal treatment: Systematic review of the literature—Part 2. Influence of clinical factors. Int. Endod. J. 2008;41:6–31. doi: 10.1111/j.1365-2591.2008.01484.x. - DOI - PubMed
    1. Peng L., Ye L., Tan H., Zhou X. Outcome of root canal obturation by warm gutta-percha versus cold lateral condensation: A meta-analysis. J. Endod. 2007;33:106–109. doi: 10.1016/j.joen.2006.09.010. - DOI - PubMed
    1. Chybowski E.A., Glickman G.N., Patel Y., Fleury A., Solomon E., He J. Clinical outcome of non-surgical root canal treatment using a single-cone technique with Endosequence Bioceramic Sealer: A retrospective analysis. J. Endod. 2018;44:941–945. doi: 10.1016/j.joen.2018.02.019. - DOI - PubMed

LinkOut - more resources