

Deep Learning-Based Acoustic Emission Scheme for Nondestructive Localization of Cracks in Train Rails under a Load
- PMID: 33401611
- PMCID: PMC7795722
- DOI: 10.3390/s21010272
Deep Learning-Based Acoustic Emission Scheme for Nondestructive Localization of Cracks in Train Rails under a Load
Abstract
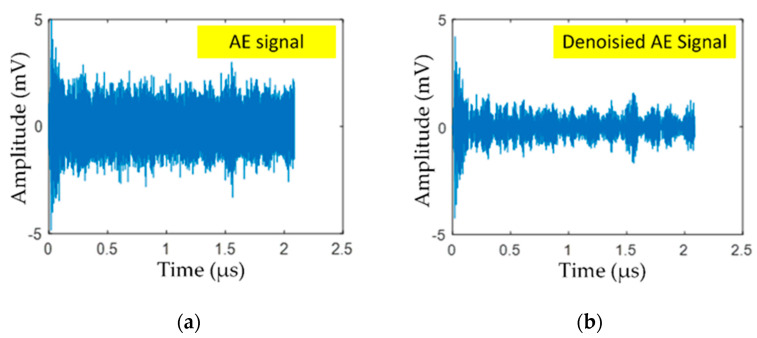
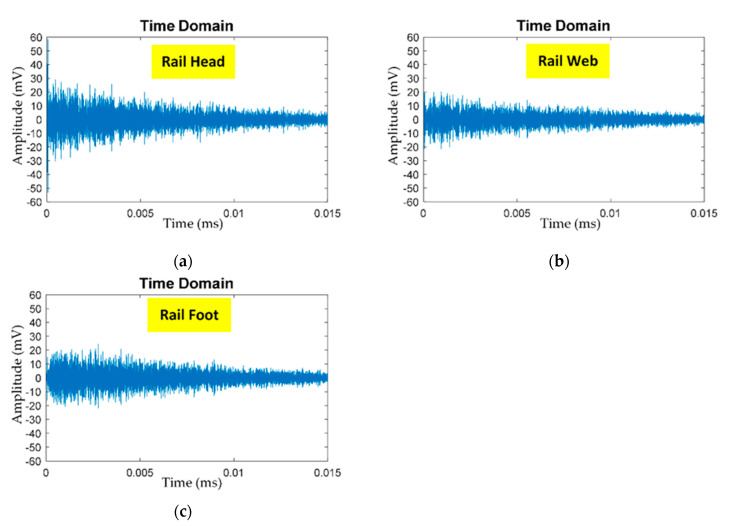
This research proposes a nondestructive single-sensor acoustic emission (AE) scheme for the detection and localization of cracks in steel rail under loads. In the operation, AE signals were captured by the AE sensor and converted into digital signal data by AE data acquisition module. The digital data were denoised to remove ambient and wheel/rail contact noises, and the denoised data were processed and classified to localize cracks in the steel rail using a deep learning algorithmic model. The AE signals of pencil lead break at the head, web, and foot of steel rail were used to train and test the algorithmic model. In training and testing the algorithm, the AE signals were divided into two groupings (150 and 300 AE signals) and the classification accuracy compared. The deep learning-based AE scheme was also implemented onsite to detect cracks in the steel rail. The total accuracy (average F1 score) under the first and second groupings were 86.6% and 96.6%, and that of the onsite experiment was 77.33%. The novelty of this research lies in the use of a single AE sensor and AE signal-based deep learning algorithm to efficiently detect and localize cracks in the steel rail, unlike existing AE crack-localization technology that relies on two or more sensors and human interpretation.
Keywords: acoustic emission sensor; acoustic emission testing; deep learning; nondestructive testing (NDT).
Conflict of interest statement
The authors declare no conflict of interest.
Figures


Similar articles
-
Quantitative Investigation of Acoustic Emission Waveform Parameters from Crack Opening in a Rail Section Using Clustering Algorithms and Advanced Signal Processing.Sensors (Basel). 2022 Nov 9;22(22):8643. doi: 10.3390/s22228643. Sensors (Basel). 2022. PMID: 36433240 Free PMC article.
-
Combined Acoustic Emission and Digital Image Correlation for Early Detection and Measurement of Fatigue Cracks in Rails and Train Parts under Dynamic Loading.Sensors (Basel). 2022 Nov 28;22(23):9256. doi: 10.3390/s22239256. Sensors (Basel). 2022. PMID: 36501957 Free PMC article.
-
Characterization of Fatigue Damage in Hadfield Steel Using Acoustic Emission and Machine Learning-Based Methods.Sensors (Basel). 2024 Jan 3;24(1):275. doi: 10.3390/s24010275. Sensors (Basel). 2024. PMID: 38203137 Free PMC article.
-
A Review of NDT Methods for Wheel Burn Detection on Rails.Sensors (Basel). 2023 May 31;23(11):5240. doi: 10.3390/s23115240. Sensors (Basel). 2023. PMID: 37299966 Free PMC article. Review.
-
Review on the Traction System Sensor Technology of a Rail Transit Train.Sensors (Basel). 2017 Jun 11;17(6):1356. doi: 10.3390/s17061356. Sensors (Basel). 2017. PMID: 28604615 Free PMC article. Review.
Cited by
-
A Method for the Pattern Recognition of Acoustic Emission Signals Using Blind Source Separation and a CNN for Online Corrosion Monitoring in Pipelines with Interference from Flow-Induced Noise.Sensors (Basel). 2024 Sep 15;24(18):5991. doi: 10.3390/s24185991. Sensors (Basel). 2024. PMID: 39338735 Free PMC article.
-
Automated Crack Detection in Monolithic Zirconia Crowns Using Acoustic Emission and Deep Learning Techniques.Sensors (Basel). 2024 Aug 31;24(17):5682. doi: 10.3390/s24175682. Sensors (Basel). 2024. PMID: 39275594 Free PMC article.
-
Failure Severity Prediction for Protective-Coating Disbondment via the Classification of Acoustic Emission Signals.Sensors (Basel). 2023 Jul 31;23(15):6833. doi: 10.3390/s23156833. Sensors (Basel). 2023. PMID: 37571616 Free PMC article.
-
Swarm Optimization for Energy-Based Acoustic Source Localization: A Comprehensive Study.Sensors (Basel). 2022 Feb 28;22(5):1894. doi: 10.3390/s22051894. Sensors (Basel). 2022. PMID: 35271040 Free PMC article. Review.
-
Automatic Implementation Algorithm of Pressure Relief Drilling Depth Based on an Innovative Monitoring-While-Drilling Method.Sensors (Basel). 2022 Apr 22;22(9):3234. doi: 10.3390/s22093234. Sensors (Basel). 2022. PMID: 35590923 Free PMC article.
References
-
- Lord A.E. Physical Acoustics. Elsevier; Amsterdam, The Netherlands: 1975. Acoustic Emission; pp. 289–353.
-
- Zhang X., Feng N., Wang Y., Shen Y. An Analysis of the Simulated Acoustic Emission Sources with Different Propagation Distances, Types and Depths for Rail Defect Detection. Appl. Acoust. 2014;86:80–88. doi: 10.1016/j.apacoust.2014.06.004. - DOI
Grants and funding
LinkOut - more resources
Full Text Sources
Other Literature Sources
