

Computational analysis of dynamic allostery and control in the SARS-CoV-2 main protease
- PMID: 33402024
- PMCID: PMC7879766
- DOI: 10.1098/rsif.2020.0591
Computational analysis of dynamic allostery and control in the SARS-CoV-2 main protease
Abstract
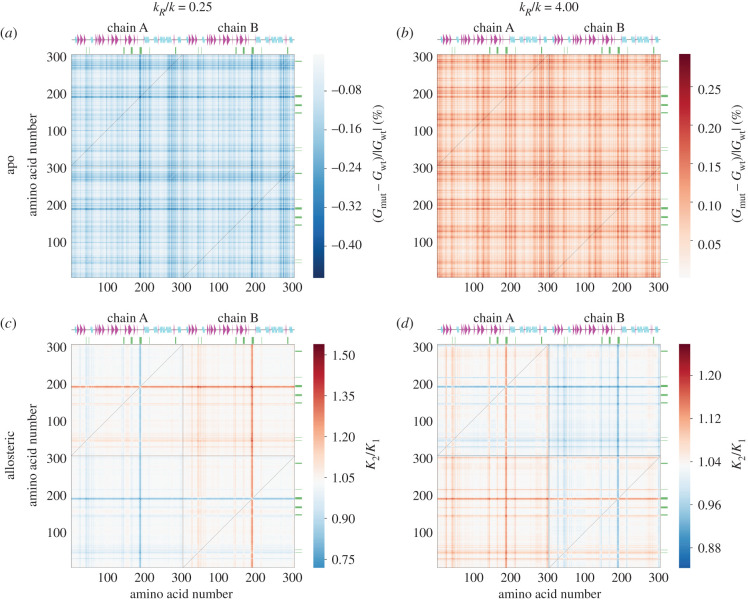
The COVID-19 pandemic caused by the novel coronavirus SARS-CoV-2 has no publicly available vaccine or antiviral drugs at the time of writing. An attractive coronavirus drug target is the main protease (Mpro, also known as 3CLpro) because of its vital role in the viral cycle. A significant body of work has been focused on finding inhibitors which bind and block the active site of the main protease, but little has been done to address potential non-competitive inhibition, targeting regions other than the active site, partly because the fundamental biophysics of such allosteric control is still poorly understood. In this work, we construct an elastic network model (ENM) of the SARS-CoV-2 Mpro homodimer protein and analyse its dynamics and thermodynamics. We found a rich and heterogeneous dynamical structure, including allosterically correlated motions between the homodimeric protease's active sites. Exhaustive 1-point and 2-point mutation scans of the ENM and their effect on fluctuation free energies confirm previously experimentally identified bioactive residues, but also suggest several new candidate regions that are distant from the active site, yet control the protease function. Our results suggest new dynamically driven control regions as possible candidates for non-competitive inhibiting binding sites in the protease, which may assist the development of current fragment-based binding screens. The results also provide new insights into the active biophysical research field of protein fluctuation allostery and its underpinning dynamical structure.
Keywords: SARS-CoV-2; allostery; elastic network model; protein dynamics.
Conflict of interest statement
We declare we have no competing interests.
Figures
Similar articles
-
Protein structural heterogeneity: A hypothesis for the basis of proteolytic recognition by the main protease of SARS-CoV and SARS-CoV-2.Biochimie. 2021 Mar;182:177-184. doi: 10.1016/j.biochi.2021.01.010. Epub 2021 Jan 20. Biochimie. 2021. PMID: 33484784 Free PMC article.
-
Candidate Binding Sites for Allosteric Inhibition of the SARS-CoV-2 Main Protease from the Analysis of Large-Scale Molecular Dynamics Simulations.J Phys Chem Lett. 2021 Jan 14;12(1):65-72. doi: 10.1021/acs.jpclett.0c03182. Epub 2020 Dec 11. J Phys Chem Lett. 2021. PMID: 33306377 Free PMC article.
-
Binding of SARS-CoV Covalent Non-Covalent Inhibitors to the SARS-CoV-2 Papain-Like Protease and Ovarian Tumor Domain Deubiquitinases.Biomolecules. 2021 May 28;11(6):802. doi: 10.3390/biom11060802. Biomolecules. 2021. PMID: 34071582 Free PMC article.
-
Targeting the Dimerization of the Main Protease of Coronaviruses: A Potential Broad-Spectrum Therapeutic Strategy.ACS Comb Sci. 2020 Jun 8;22(6):297-305. doi: 10.1021/acscombsci.0c00058. Epub 2020 May 27. ACS Comb Sci. 2020. PMID: 32402186 Review.
-
Design and Evaluation of Anti-SARS-Coronavirus Agents Based on Molecular Interactions with the Viral Protease.Molecules. 2020 Aug 27;25(17):3920. doi: 10.3390/molecules25173920. Molecules. 2020. PMID: 32867349 Free PMC article. Review.
Cited by
-
3-chymotrypsin-like protease in SARS-CoV-2.Biosci Rep. 2024 Aug 28;44(8):BSR20231395. doi: 10.1042/BSR20231395. Biosci Rep. 2024. PMID: 39036877 Free PMC article. Review.
-
The impact of structural bioinformatics tools and resources on SARS-CoV-2 research and therapeutic strategies.Brief Bioinform. 2021 Mar 22;22(2):742-768. doi: 10.1093/bib/bbaa362. Brief Bioinform. 2021. PMID: 33348379 Free PMC article. Review.
-
Allosteric Binding Sites of the SARS-CoV-2 Main Protease: Potential Targets for Broad-Spectrum Anti-Coronavirus Agents.Drug Des Devel Ther. 2022 Aug 2;16:2463-2478. doi: 10.2147/DDDT.S370574. eCollection 2022. Drug Des Devel Ther. 2022. PMID: 35941927 Free PMC article. Review.
-
Promising SARS-CoV-2 main protease inhibitor ligand-binding modes evaluated using LB-PaCS-MD/FMO.Sci Rep. 2022 Oct 26;12(1):17984. doi: 10.1038/s41598-022-22703-1. Sci Rep. 2022. PMID: 36289271 Free PMC article.
-
Methodology-Centered Review of Molecular Modeling, Simulation, and Prediction of SARS-CoV-2.Chem Rev. 2022 Jul 13;122(13):11287-11368. doi: 10.1021/acs.chemrev.1c00965. Epub 2022 May 20. Chem Rev. 2022. PMID: 35594413 Free PMC article. Review.
References
Publication types
MeSH terms
Substances
Associated data
LinkOut - more resources
Full Text Sources
Other Literature Sources
Medical
Miscellaneous
