. 2021 Jan 13;288(1942):20202600.
doi: 10.1098/rspb.2020.2600. Epub 2021 Jan 6.

Hearing sensitivity and amplitude coding in bats are differentially shaped by echolocation calls and social calls

Affiliations

Hearing sensitivity and amplitude coding in bats are differentially shaped by echolocation calls and social calls

Ella Z Lattenkamp et al. Proc Biol Sci. .

Abstract

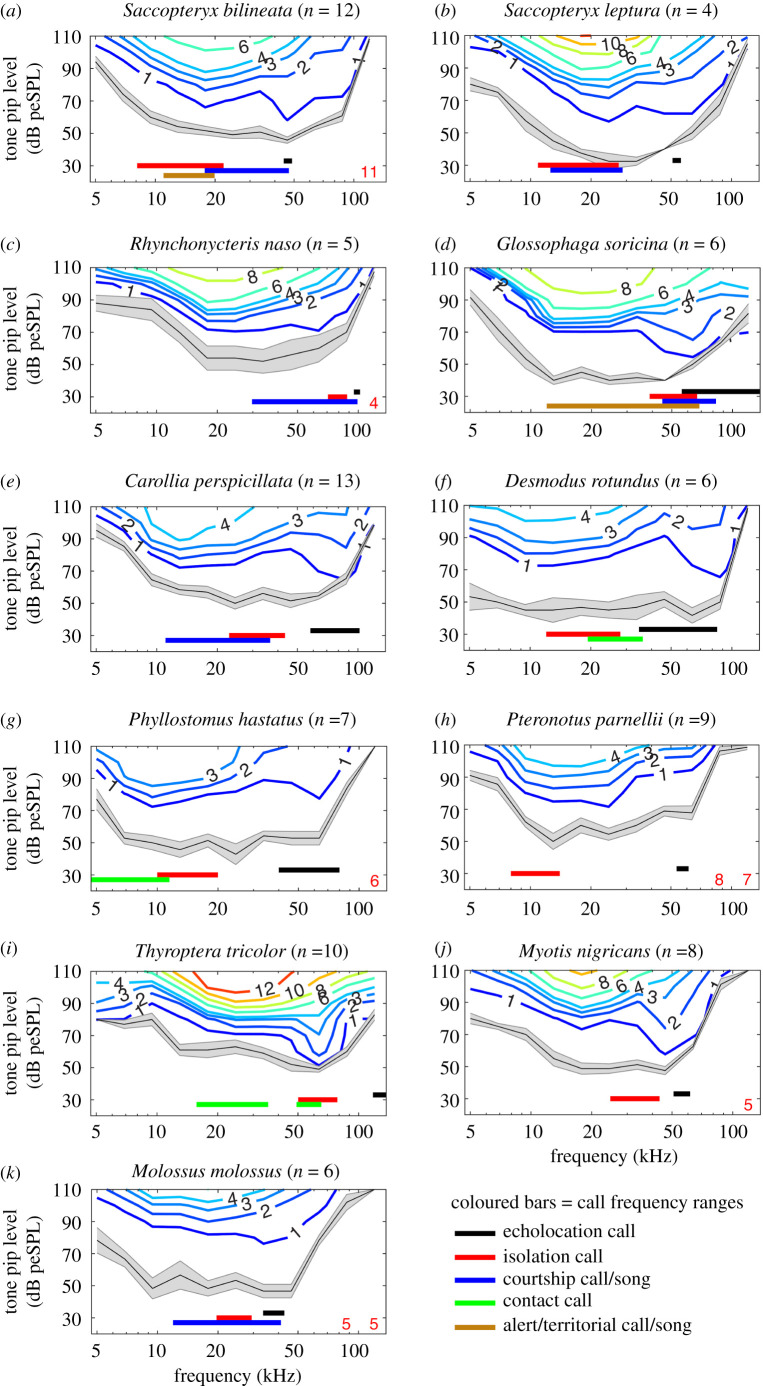
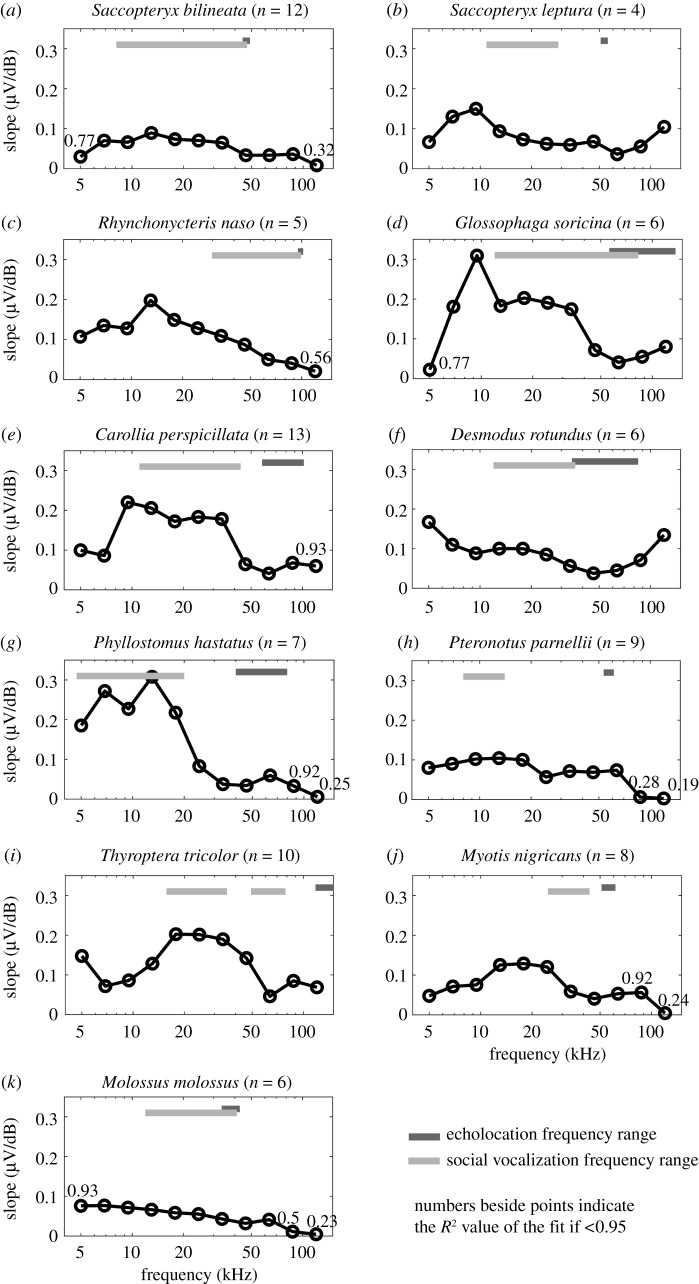
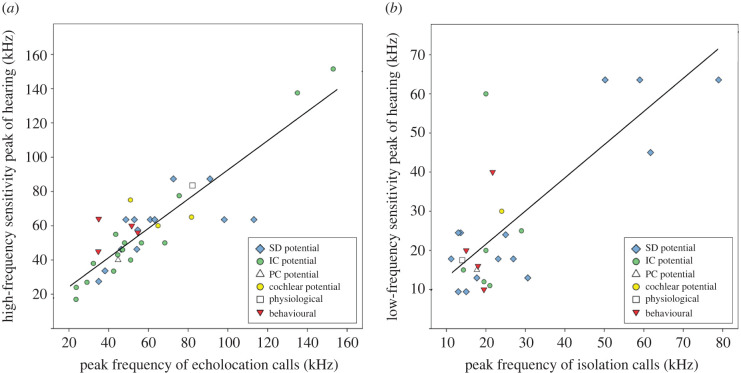
Differences in auditory perception between species are influenced by phylogenetic origin and the perceptual challenges imposed by the natural environment, such as detecting prey- or predator-generated sounds and communication signals. Bats are well suited for comparative studies on auditory perception since they predominantly rely on echolocation to perceive the world, while their social calls and most environmental sounds have low frequencies. We tested if hearing sensitivity and stimulus level coding in bats differ between high and low-frequency ranges by measuring auditory brainstem responses (ABRs) of 86 bats belonging to 11 species. In most species, auditory sensitivity was equally good at both high- and low-frequency ranges, while amplitude was more finely coded for higher frequency ranges. Additionally, we conducted a phylogenetic comparative analysis by combining our ABR data with published data on 27 species. Species-specific peaks in hearing sensitivity correlated with peak frequencies of echolocation calls and pup isolation calls, suggesting that changes in hearing sensitivity evolved in response to frequency changes of echolocation and social calls. Overall, our study provides the most comprehensive comparative assessment of bat hearing capacities to date and highlights the evolutionary pressures acting on their sensory perception.

Keywords: amplitude coding; audiogram; auditory brainstem responses; dynamic range; hearing threshold; sensory system evolution.


Conflict of interest statement

The authors have no competing interests to declare.

Figures

Figure 1.
Figure 1.
Species-specific mean ABR thresholds calculated via bootstrap analysis for 11 species from six families: Emballonuridae (ac), Phyllostomidae (dg), Mormoopidae (h), Thyropteridae (i), Vespertilionidae (j) and Molossidae (k). The mean ABR threshold per species is depicted (black line; shading represents SEM). The isoresponse lines represent the strength of the ABR signal (colours and numbers indicate µV response strength). The number of animals measured per species is given in the plot titles (n). Vertical bars below the ABR thresholds indicate bandwidth of five different call types: echolocation calls (black), isolation calls (red), courtship calls (blue), contact calls (green) and territorial/alert calls (brown). For details, see electronic supplementary material, table S2. Red numbers on the bottom of the panels indicate the number of animals used for the calculation of mean and SEM (if less than total sample size). The numbers are positioned above the frequency for which mean values were determined.
Figure 2.
Figure 2.
Species-specific slopes of ABRs' growth functions for each frequency. The R² quality measures of the fits are given above each frequency (if less than 0.95). A shallow slope corresponds to a large dynamic range of stimulus amplitude encoding (i.e. the more finely coded is the bat's response to different stimulus amplitudes at a given frequency); a steep slope corresponds to a small dynamic range. Dark grey bars indicate the frequency ranges of echolocation calls, while the light grey bars indicate the frequency ranges of social vocalizations.
Figure 3.
Figure 3.
Positive relation between hearing sensitivity (in higher and lower frequency ranges) and the peak frequency of echolocation calls (a) and isolation calls (b). Graphs depict the original data with the fitted optimal regression slopes from phylogenetically corrected analyses (OU models of trait evolution). Details on OU models as well as data on call frequencies and sensitivity peaks for all species in our phylogenetic comparative analysis are provided in the supplementary material (electronic supplementary material, tables S3–S4, figure S6). Different symbols depict electrophysiological (SD, IC, PC and cochlear potential), physiological (change in heart rate) and behavioural (discrimination paradigm) ways in which hearing thresholds were determined. Electrophysiological data were collected from extracellular recordings subdermally (SD) at the brainstem, at the inferior colliculus (IC) and posterior colliculus (PC) in the auditory midbrain, and at the round window of the cochlea (cochlear potential). (Online version in colour.)

Similar articles

Cited by

References

    1. Yost WA, Fay RR, Popper AN. 2007. Auditory perception of sound sources. New York, NY: Springer Science & Business Media.
    1. Nachtigall PE 1980. Odontocete echolocation performance on object size, shape and material. In Animal sonar systems (eds Busnel RG, Fish JF), pp. 71–95. Boston, MA: Springer.
    1. Neuweiler G 1990. Auditory adaptations for prey capture in echolocating bats. Physiol. Rev. 70, 615–641. (10.1152/physrev.1990.70.3.615) - DOI - PubMed
    1. Wood F, Evans W. 1980. Adaptiveness and ecology of echolocation in toothed whales. In Animal sonar systems (eds Busnel RG, Fish JF), pp. 381–425. Boston, MA: Springer.
    1. Jones G 1999. Scaling of echolocation call parameters in bats. J. Exp. Biol. 202, 3359–3367. - PubMed

Publication types

LinkOut - more resources