. 2021 Jan 6;14(1):3.
doi: 10.1186/s13045-020-00997-w.

Stable colony-stimulating factor 1 fusion protein treatment increases hematopoietic stem cell pool and enhances their mobilisation in mice

Affiliations

Stable colony-stimulating factor 1 fusion protein treatment increases hematopoietic stem cell pool and enhances their mobilisation in mice

Simranpreet Kaur et al. J Hematol Oncol. .

Abstract

Background: Prior chemotherapy and/or underlying morbidity commonly leads to poor mobilisation of hematopoietic stem cells (HSC) for transplantation in cancer patients. Increasing the number of available HSC prior to mobilisation is a potential strategy to overcome this deficiency. Resident bone marrow (BM) macrophages are essential for maintenance of niches that support HSC and enable engraftment in transplant recipients. Here we examined potential of donor treatment with modified recombinant colony-stimulating factor 1 (CSF1) to influence the HSC niche and expand the HSC pool for autologous transplantation.

Methods: We administered an acute treatment regimen of CSF1 Fc fusion protein (CSF1-Fc, daily injection for 4 consecutive days) to naive C57Bl/6 mice. Treatment impacts on macrophage and HSC number, HSC function and overall hematopoiesis were assessed at both the predicted peak drug action and during post-treatment recovery. A serial treatment strategy using CSF1-Fc followed by granulocyte colony-stimulating factor (G-CSF) was used to interrogate HSC mobilisation impacts. Outcomes were assessed by in situ imaging and ex vivo standard and imaging flow cytometry with functional validation by colony formation and competitive transplantation assay.

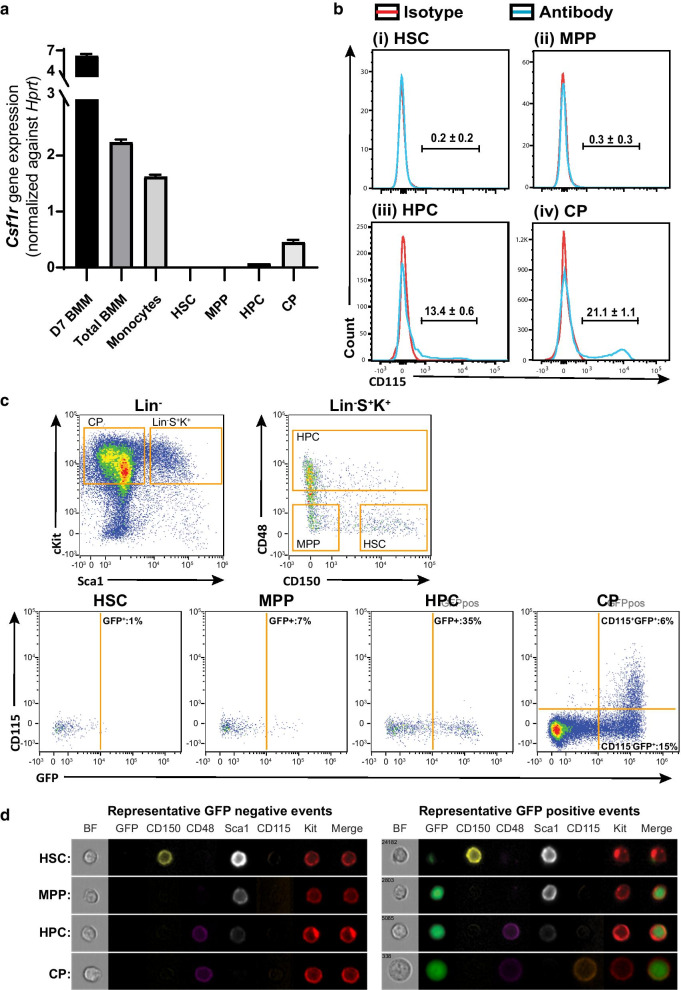
Results: CSF1-Fc treatment caused a transient expansion of monocyte-macrophage cells within BM and spleen at the expense of BM B lymphopoiesis and hematopoietic stem and progenitor cell (HSPC) homeostasis. During the recovery phase after cessation of CSF1-Fc treatment, normalisation of hematopoiesis was accompanied by an increase in the total available HSPC pool. Multiple approaches confirmed that CD48-CD150+ HSC do not express the CSF1 receptor, ruling out direct action of CSF1-Fc on these cells. In the spleen, increased HSC was associated with expression of the BM HSC niche macrophage marker CD169 in red pulp macrophages, suggesting elevated spleen engraftment with CD48-CD150+ HSC was secondary to CSF1-Fc macrophage impacts. Competitive transplant assays demonstrated that pre-treatment of donors with CSF1-Fc increased the number and reconstitution potential of HSPC in blood following a HSC mobilising regimen of G-CSF treatment.

Conclusion: These results indicate that CSF1-Fc conditioning could represent a therapeutic strategy to overcome poor HSC mobilisation and subsequently improve HSC transplantation outcomes.

Keywords: Colony-stimulating factor 1; HSC mobilisation; Hematopoietic stem cells; Macrophages.


Conflict of interest statement

The authors declare no competing interests.

Figures

Fig. 1
Fig. 1
CSF1-Fc treatment induced significant expansion of BM resident macrophages. a Schematic of CSF1-Fc treatment regimen in C57BL/6 mice (D, day; S.C., subcutaneous). Tissues were harvested at 7 (D7) and 14 days (D14) post-first CSF1-Fc injection. b F4/80 immunohistochemistry (brown) in femoral BM sections of mice treated with saline (left panel) or CSF1-Fc at D7 (middle panel) and D14 (right panel). Closed arrows indicate perivascular macrophages, and arrowheads highlight endosteal macrophages. Sections were counterstained with hematoxylin (blue) and taken at 600X magnification. Scale bar = 20 µm. c Quantification of percent area of F4/80 staining in the femur of saline (blue circles, pooled D7 and D14 samples) and CSF1-Fc-treated mice at D7 (red squares) and D14 (green triangles) post-first injection. d–g Flow cytometry analysis to determine absolute number of cells per femur of d F4/80+Ly6GnegVCAMnegCD115+CD11b+ monocytes, e CD11b+Ly6G+ granulocytes, f CD11bnegCD3negB220+ B cells and g CD11bnegB220negCD3+ T cells in BM of saline controls or CSF1-Fc-treated mice. Flow cytometry representative raw data and gating provided in Additional file 1: Figs. S1 and S2. Each data point represents a separate mouse, and bars are mean ± SD. Statistical analysis was performed using one-way ANOVA Tukey’s multiple comparison test where ****p < 0.0001
Fig. 2
Fig. 2
CSF1-Fc treatment transiently disrupts splenic architecture and altered red pulp macrophage phenotype. a Immunofluorescence labelling of F4/80 (blue), CD169 (red) and B220 (green) expression in spleen sections of mice treated with saline (left panel) or CSF1-Fc and assessed at D7 (middle panel) and D14 (right panel). Magnification = 100×; scale bar = 100 µm. Inset magnification = 600×; scale bar = 20 µm. b Spleen weights in saline controls (blue circles) or CSF1-Fc-treated mice at the D7 (red squares) and D14 (green triangles) time points. c–e Morphometric analysis of percent areas of c F4/80 immunolabelling, d CD169 immunolabelling and e F4/80 area co-labelled with CD169 per mm2 of tissue. f–i Flow cytometry analysis of total number of cells per mg of spleen of f F4/80+Ly6GnegVCAMnegCD115+CD11b+ monocytes (Mo), g CD11b+Ly6G+ granulocytes (Grans), h CD11bnegCD3negB220+ B cells and i CD11bnegB220negCD3+ T cells in saline control or CSF1-Fc-treated mice at both time points. Each data point represents a separate mouse, and bars are mean ± SD. Statistical analysis was performed using one-way ANOVA Tukey’s multiple comparison test where ****p < 0.0001, **p < 0.01 and *p < 0.05, n = 3 to 11 mice/group. Kolmogorov–Smirnov test revealed non-normality for data in graph f, therefore dictating use of a Mann–Whitney U test. Data for the saline control samples from D7 and D14 were pooled together in the graphical representations
Fig. 3
Fig. 3
HSC does not express CSF1R. a Quantitative real-time PCR data demonstrating Csf1r mRNA expression in sorted HSC, MPP, HPC and committed progenitors as well as positive control samples of sorted monocytes, total BM and day 7 (D7) BMM. b Representative flow cytometry histograms of C57BL/6 mouse BM expression of CD115 (CSF1R) in (i) HSC, (ii) MPP, (iii) HPC and (iv) committed progenitors. Population gating strategies are exemplified in Additional file 1: Figs. S5 and S7. The histograms show antibody staining (blue lines) compared to appropriate isotype staining (red lines). c BM isolated from MacGreen mice was assessed by imaging flow cytometry with dot plots showing BM HSPC population gating strategy and subsequently CD115 and MacGreen GFP transgene expression in gated HSC, MPP, HPC and committed progenitors (CP). d Representative image panels showing individual bright field (BF) and specific antibody/transgene fluorophore images for representative cell events selected from either GFP-negative or GFP-positive gates in (c)
Fig. 4
Fig. 4
CSF1-Fc treatment is associated with a delayed increase in HSC and MPP in BM and spleen. a Flow cytometry analysis to determine the number of HSC (top left), MPP (top right) and HPC (bottom left) in BM, spleen or liver of C57BL/6 mice treated with saline (blue circles) or CSF1-Fc at D7 (red squares) or D14 (green triangles) post-first CSF1-Fc injection. Quantification of CFU in the BM (assay using single femur only) and spleen of saline or CSF1-Fc-treated mice at both time points (bottom right). b Number of CMP (top left), GMP (top right), MEP (bottom left) and CLP (bottom right) cells in BM, spleen and liver of C57BL/6 mice treated with saline (blue dots) or CSF1-Fc at D14 (green triangles) post-first CSF1-Fc injection. Population gating strategies are exemplified in Additional file 1: Fig. S7. Each data point represents a separate mouse, and bars are mean ± SD. Statistical analysis was performed using one-way ANOVA Tukey’s multiple comparison test where ****p < 0.0001, ***p < 0.0005, **p < 0.01 and *p < 0.05, n = 4 to 11 mice/group. Kolmogorov–Smirnov test revealed non-normality for liver data in graphs in (a), therefore dictating use of a Mann–Whitney U test. Data for the saline control samples from D7 and D14 time points were pooled together in the graphical representations
Fig. 5
Fig. 5
Tandem CSF1-Fc and G-CSF treatment had modest cumulative impacts on myeloid cells. a Schematic of tandem CSF1-Fc plus G-CSF treatment regimen administered to C57BL/6 non-transgenic mice. Briefly, mice were divided into 4 treatment groups: (1) once daily saline for 4 days followed by bi-daily saline treatment initiated 14 days later (saline + saline); (2) once daily CSF1-Fc for 4 days followed by bi-daily saline (CSF1-Fc + saline); (3) once daily saline for 4 days followed by bi-daily G-CSF treatment (saline + G-CSF); and (4) once daily CSF1-Fc for 4 days followed by bi-daily G-CSF treatment (CSF1-Fc + G-CSF). Tissues were harvested 17 days post-first CSF1-Fc injection. b Representative immunohistochemistry anti-F4/80 staining (brown) in femoral sections of mice treated as described above. F4/80+ BM resident macrophages (brown) are lining the endosteal (arrowheads) and perivascular (arrow) regions of the BM. Sections were counterstained with hematoxylin (blue) and taken at 600X magnification; scale bar = 20 µm. c Quantification of percent area of F4/80 staining in the femur of mice treated as above. d Representative immunohistochemistry anti-F4/80 staining (brown) in splenic sections of mice treated as above. Section were counterstained with hematoxylin (blue) and taken at 100X magnification; scale bar = 500 µm. Inset at 600X magnification; scale bar = 20 µm. e Quantification of percent area of F4/80 staining in the spleen of mice treated as above. f Weights of spleen of mice treated as above. g–j Flow cytometry analysis of the percentage of F4/80+Ly6GnegVCAM+CD115+CD11b+ monocytes (Mo) in BM (g) and spleen (h) or CD11b+Ly6G+ granulocytes (Grans) in BM (i) and spleen (j) of mice treated with either saline + G-CSF or CSF1-Fc + G-CSF. Each data point represents a separate mouse, and bars are mean ± SD. Statistical analysis was performed using one-way ANOVA Tukey’s multiple comparison test and unpaired Student's t test where ****p < 0.0001, ***p < 0.001, *p < 0.05
Fig. 6
Fig. 6
Sequential CSF1-Fc + G-CSF treatment mobilised HSPC more effectively than saline + G-CSF. Experimental schematic is described in Fig. 5(a). a–i Flow cytometry analysis to enumerate number of a, d, g HSC, b, e, h MPP and c, f, i HPC in BM (a–c), blood (d–f) and spleen (g–i) of mice treated as indicated. Population gating strategies are exemplified in Additional file 1: Fig. S5. Quantification of colony-forming units (CFU) in the j BM (assay using single femur only), k blood and l spleen in mice treated as indicated. Each data point represents a separate mouse, and bars are mean ± SD. Statistical analysis was performed using one-way ANOVA Tukey’s multiple comparison test where ****p < 0.0001, **p < 0.01 and *p < 0.05
Fig. 7
Fig. 7
Combination of CSF1-Fc + G-CSF treatment improved the reconstitution potential of mobilised HSPC. a Schematic of competitive transplantation assay. Briefly, female donor C57BL/6 non-transgenic mice were treated with either once daily saline for 4 days followed by bi-daily G-CSF treatment (saline + G-CSF) 14 days later or once daily CSF1-Fc for 4 days followed by bi-daily G-CSF treatment (CSF1-Fc + saline) 14 days later as in Fig. 5a. At 17 days post-initial CSF1-Fc treatment blood was harvested from donor C57BL/6 mice from the two different treatment groups and then independently pooled with competitor BM from transgenic RFP mice and transplanted into lethally irradiated B6.SJL Ptprca recipients. Tail bleeds were performed at 8, 12 and 16 week post-transplantation to determine chimerism. b Quantification of blood chimerism of RFPnegCD45.2+ donors (white bars) and RFP+CD45.2+ competitors (red bars) in recipient mice that were transplanted with blood from saline + G-CSF or CSF1-Fc + G-CSF-treated donor mice. c Number of repopulating units (RU) per ml of blood transplanted in grafts collected from saline + G-CSF (light blue dots) and CSF1-Fc + G-CSF (black squares)-treated donors determined at 16 weeks post-competitive transplant. d Percent frequency of major mature cell lineages in peripheral blood contributed by test donor samples (saline + G-CSF or CSF1-Fc + G-CSF) in competitive transplant assay. Data are mean ± SD. Evidence of data distribution non-normality was identified by the Kolmogorov–Smirnov test, and statistical analysis was performed on data using by a Mann–Whitney U test where **p < 0.01 and *p < 0.05

Similar articles

Cited by

References

    1. Perseghin P, Terruzzi E, Dassi M, et al. Management of poor peripheral blood stem cell mobilization: Incidence, predictive factors, alternative strategies and outcome. A retrospective analysis on 2177 patients from three major Italian institutions. Transfus Apheresis Sci. 2009;41(1):33–37. doi: 10.1016/j.transci.2009.05.011. - DOI - PubMed
    1. To LB, Levesque JP, Herbert KE. How I treat patients who mobilize hematopoietic stem cells poorly. Blood. 2011;118(17):4530–4540. doi: 10.1182/blood-2011-06-318220. - DOI - PubMed
    1. Domingues MJ, Nilsson SK, Cao B. New agents in HSC mobilization. Int J Hematol. 2017;105(2):141–152. doi: 10.1007/s12185-016-2156-2. - DOI - PubMed
    1. Winkler IG, Sims NA, Pettit AR, et al. Bone marrow macrophages maintain hematopoietic stem cell (HSC) niches and their depletion mobilizes HSCs. Blood. 2010;116(23):4815–4828. doi: 10.1182/blood-2009-11-253534. - DOI - PubMed
    1. Chow A, Lucas D, Hidalgo A, et al. Bone marrow CD169+ macrophages promote the retention of hematopoietic stem and progenitor cells in the mesenchymal stem cell niche. J Exp Med. 2011;208(2):261–271. doi: 10.1084/jem.20101688. - DOI - PMC - PubMed

Publication types

MeSH terms

Substances