. 2021 Jan 5;9(1):1.
doi: 10.1186/s40478-020-01099-x.

Microglial gene signature reveals loss of homeostatic microglia associated with neurodegeneration of Alzheimer's disease

Affiliations

Microglial gene signature reveals loss of homeostatic microglia associated with neurodegeneration of Alzheimer's disease

Akira Sobue et al. Acta Neuropathol Commun. .

Abstract

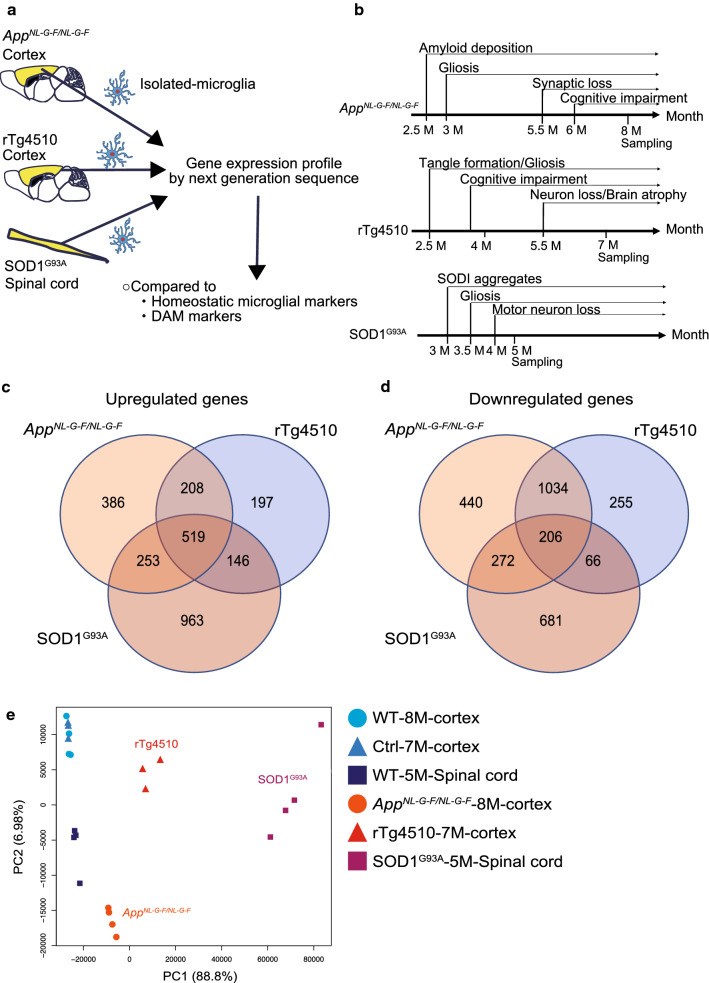
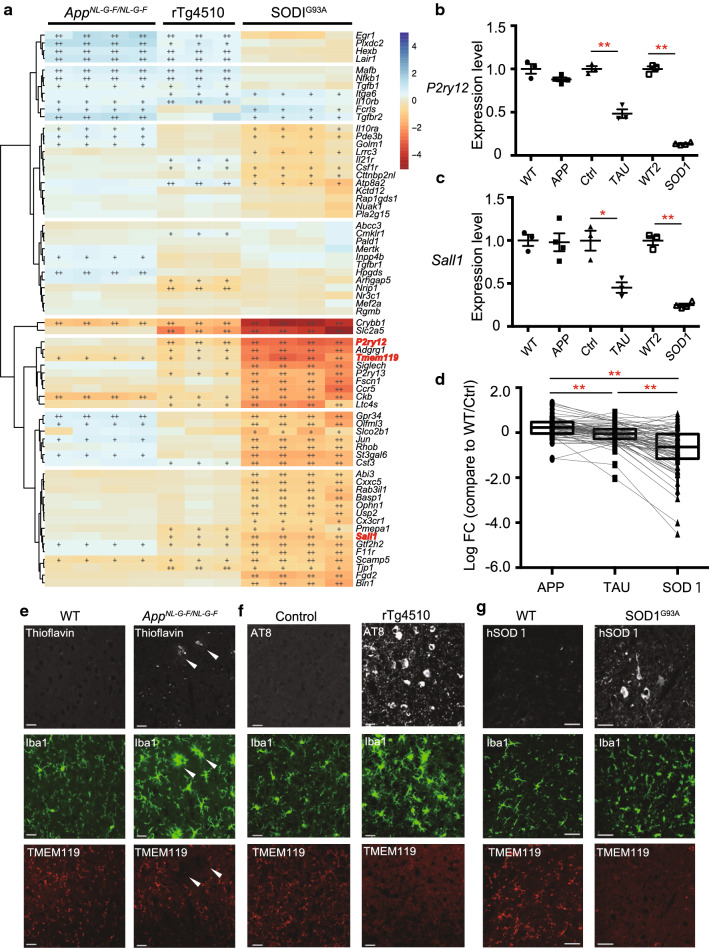
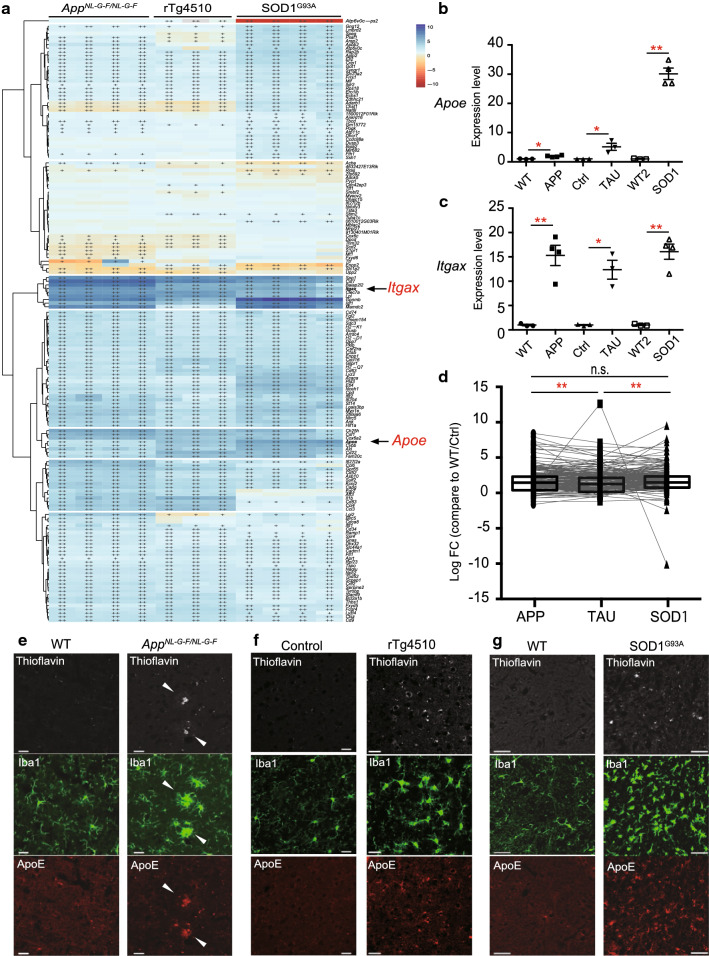
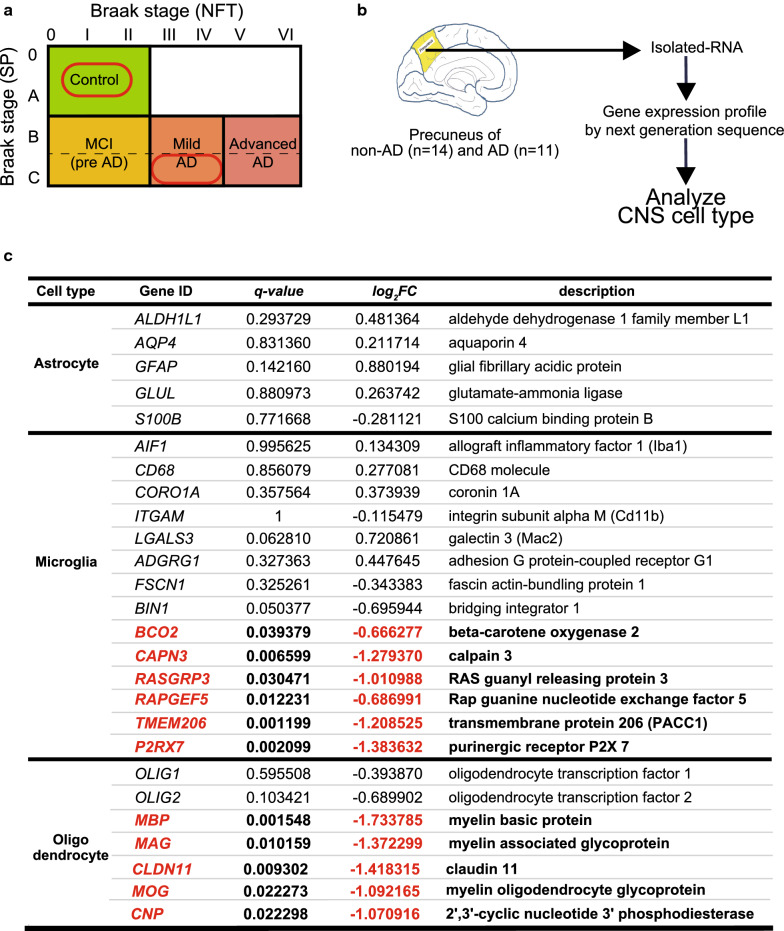
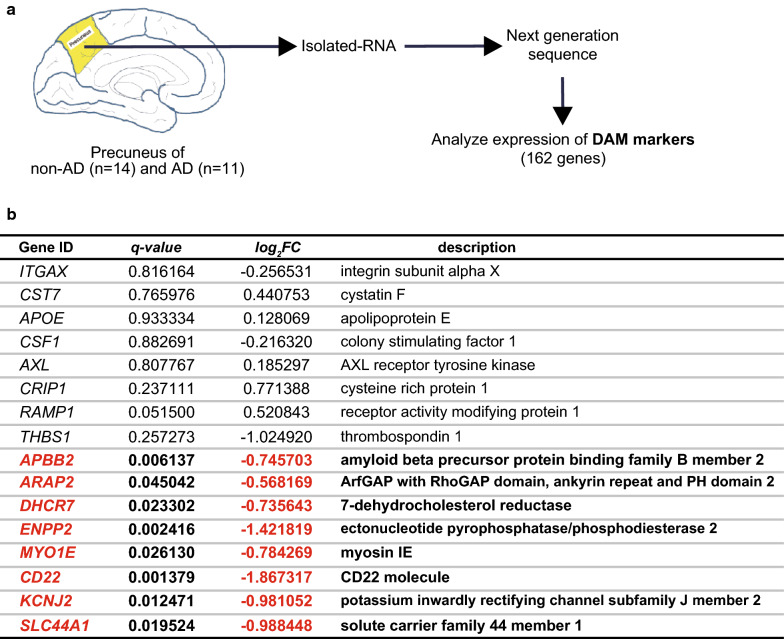
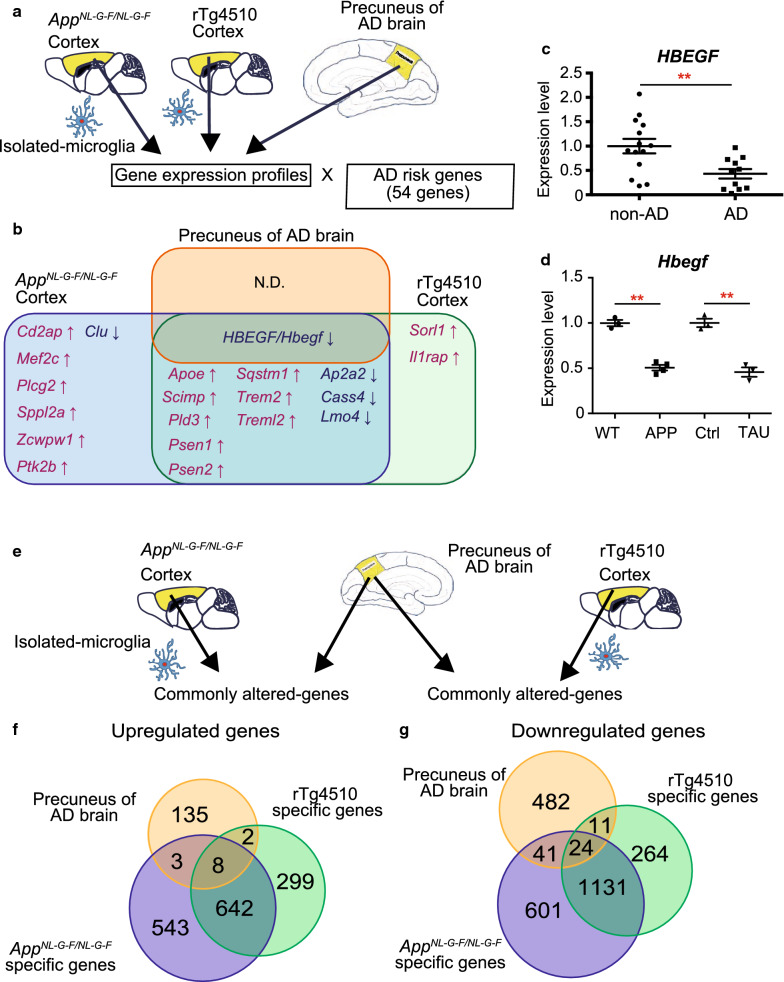
Microglia-mediated neuroinflammation has been implicated in the pathogenesis of Alzheimer's disease (AD). Although microglia in aging and neurodegenerative disease model mice show a loss of homeostatic phenotype and activation of disease-associated microglia (DAM), a correlation between those phenotypes and the degree of neuronal cell loss has not been clarified. In this study, we performed RNA sequencing of microglia isolated from three representative neurodegenerative mouse models, AppNL-G-F/NL-G-F with amyloid pathology, rTg4510 with tauopathy, and SOD1G93A with motor neuron disease by magnetic activated cell sorting. In parallel, gene expression patterns of the human precuneus with early Alzheimer's change (n = 11) and control brain (n = 14) were also analyzed by RNA sequencing. We found that a substantial reduction of homeostatic microglial genes in rTg4510 and SOD1G93A microglia, whereas DAM genes were uniformly upregulated in all mouse models. The reduction of homeostatic microglial genes was correlated with the degree of neuronal cell loss. In human precuneus with early AD pathology, reduced expression of genes related to microglia- and oligodendrocyte-specific markers was observed, although the expression of DAM genes was not upregulated. Our results implicate a loss of homeostatic microglial function in the progression of AD and other neurodegenerative diseases. Moreover, analyses of human precuneus also suggest loss of microglia and oligodendrocyte functions induced by early amyloid pathology in human.

Keywords: Alzheimer’s disease; Animal model; Microglia; Neuroinflammation; Next generation sequence; Precuneus.


Conflict of interest statement

The authors report no biomedical financial interests or potential conflicts of interest.

Figures

Fig. 1
Fig. 1
Altered gene expression profiles of microglia isolated from mouse models of neurodegenerative diseases. a Schematic overview of gene expression analysis of microglia isolated from mouse models of different neurodegenerative diseases. b Timeline of the phenotype, pathology, and sampling for each mouse model. Venn diagram displaying the numbers of significantly upregulated (c) and downregulated (d) genes among each comparison between neurodegenerative models and controls: 3318 deregulated genes (1366 upregulated and 1952 downregulated) in AppNL-G-F/NL-G-F microglia (n = 4 for each genotype), 2631 deregulated genes (1070 upregulated and 1561 downregulated) in rTg4510 microglia (n = 3 for each genotype), and 3106 deregulated genes (1881 upregulated and 1225 downregulated) in SOD1G93A microglia (n = 4 for each genotype) (q < 0.05, |FC| > 1.5, TPM > 5). e Principal component analysis of gene expression profiles of microglia isolated from neurodegenerative disease models and their controls. WT, wild-type; Ctrl, control
Fig. 2
Fig. 2
Decreases in gene expression linked to homeostatic microglia in mouse models of neurodegenerative diseases. Expression of homeostatic microglial genes analyzed by RNA sequencing (RNA-seq) and quantitative PCR (WT: n = 4 and AppNL-G-F/NL-G-F: n = 4; Ctrl: n = 3 and rTg4510: n = 3; WT: n = 4 and SOD1G93A: n = 4). WT, wild-type; Ctrl, control. a A heat map of homeostatic microglial genes in isolated-microglia of the mouse models of neurodegenerative diseases. Colors of the individual cells denote relative expression levels of the neurodegenerative models. +: q < 0.05, ++: q < 0.001. b, c Quantitative PCR analysis to determine the expression levels of P2ry12 and Sall1 mRNA in isolated-microglia of each mouse model. b P2ry12 expression level (AppNL-G-F/NL-G-F: FC = −1.14, p = 0.2275; rTg4510: FC = −2.07, p = 0.00285; SOD1G93A: FC = −7.35, p = 1.74E−06). c Sall1 expression level (AppNL-G-F/NL-G-F: FC = −1.02, p = 1; rTg4510: FC = −2.21, p = 0.0420; SOD1G93A: FC = −4.04, p = 6.71E−05). Data are represented as the mean ± SEM. *p < 0.05, **p < 0.001. Bonferroni-corrected Student’s t test. d Log2FC values against WT/Ctrl for 68 homeostatic microglial genes in the isolated microglia from the cortex of APPNL-G-F/NL-G-F and rTg4510 mice, and spinal cord of SOD1G93A mice. AppNL-G-F/NL-G-F (median log2FC = 0.227), rTg4510 (median log2FC = −0.0504, adj. p = 7.33E−07), and SOD1G93A (median log2FC = −0.633, adj. p = 1.61E−11) mice. Data are represented as the median with 5th and 95th percentile. *p < 0.05, **p < 0.001. Wilcoxon’s signed rank test, followed by a multiple testing correction using the Bonferroni–Holm method. eg Representative immunofluorescent images demonstrating amyloid β (Aβ, thioflavin), Tau (AT8) or hSOD1 (white), Iba1 (green), and TMEM119 (red) in cortex of e WT and AppNL-G-F/NL-G-F mouse, f Ctrl and rTg4510 mouse, and g spinal cord of WT and SOD1G93A mouse. Arrowheads indicate Aβ and Aβ-associated microglia. Scale bars: 20 µm (e, f) and 50 µm (g)
Fig. 3
Fig. 3
Elevated gene expression of disease-associated microglia (DAM) in mouse models of neurodegenerative diseases. DAM gene expression analyzed by RNA sequencing (RNA-Seq) and quantitative PCR (WT: n = 4 and AppNL-G-F/NL-G-F: n = 4; Ctrl: n = 3 and rTg4510: n = 3; WT: n = 4 and SOD1G93A: n = 4). WT, wild-type; Ctrl, control. a A heat map of DAM genes in isolated-microglia. Colors indicate upregulated (blue) and downregulated genes (red) relative to each control. +: q < 0.05, ++: q < 0.001. b, c Quantitative PCR analysis to determine expression levels of Apoe and Itgax mRNA in isolated-microglia of each mouse model. b Apoe expression level (AppNL-G-F/NL-G-F: FC = 1.91, p = 0.0126; rTg4510: FC = 5.51, p = 0.0251; SOD1G93A: FC= 30.1, p = 0.000177). c Itgax expression level (AppNL-G-F/NL-G-F: FC = 15.3, p = 0.00638; rTg4510: FC = 12.4, p = 0.0129; SOD1G93A: FC = 16.1, p = 0.00138). Data are represented as the mean ± SEM. *p < 0.05, **p < 0.001. Bonferroni-corrected Student’s t test. d Log2FC values against WT/Ctrl for 162 DAM genes in the isolated microglia from the cortex of APPNL-G-F/NL-G-F and rTg4510 mice, and spinal cord of SOD1G93A mice. AppNL-G-F/NL-G-F (median log2FC = 1.466), rTg4510 (median log2FC = 1.275, adj. p = 2.12E−03), and SOD1G93A (median log2FC = 1.484, adj. p = 1.14E−01) mice. Data are represented as the median with 5th and 95th percentile. *p < 0.05, **p < 0.001. Wilcoxon’s signed rank test, followed by a multiple testing correction using the Bonferroni–Holm method. eg Representative immunofluorescent images demonstrating expression of Aβ, Tau, or SOD1 (thioflavin, white), Iba1 (green), and ApoE (red) in the cortex of e WT and AppNL-G-F/NL-G-F mouse, f Ctrl and rTg4510 mouse, and g the spinal cord of WT and SOD1G93A mouse. Arrowheads indicate Aβ and Aβ-associated microglia. Scale bars: 20 µm (e, f) and 50 µm (g)
Fig. 4
Fig. 4
RNA sequencing reveals altered gene expression of each CNS cell-type in human precuneus with Alzheimer’s disease (AD) pathology. a Human brain samples were selected for analysis based on the Braak staing as follows: control brain (non-AD) defined as Braak stage (senile plaque: SP): 0–A, Braak stage (neurofibrillary tangle: NFT): 0–II; and AD brain defined as Braak stage (SP): C and Braak stage (NFT): III–IV. b Schematic overview of the gene expression analysis of the CNS cell-type markers in the precuneus of non-AD (n = 14) and AD (n = 11). c Expression of representative genes enriched in astrocytes, microglia, and oligodendrocytes in precuneus of AD brain with fold change. Downregulated genes (statistically significant, q < 0.05) are shown in red and bold
Fig. 5
Fig. 5
Altered expression of disease-associated microglia (DAM) genes in human precuneus of Alzheimer’s disease (AD) pathology. a Schematic overview of expression analysis of DAM genes in the precuneus of non-AD and AD brain. b List of representative DAM genes and DAM genes with significantly altered expression in the precuneus of AD brains (non-AD: n = 14 and AD: n = 11). Gene ID with description, q-value, and fold change are shown. Significantly downregulated genes (q < 0.05) are shown in red and bold
Fig. 6
Fig. 6
Comparative gene expression analysis of human precuneus of Alzheimer’s disease (AD) brain with microglia isolated from the AD mouse models with amyloid and Tau pathology. a Schematic overview of the comparative expression analysis of the genes defined as risk factors for AD in human AD precuneus and microglia isolated from AppNL-G-F/NL-G-F and rTg4510 mice. b Venn diagram displaying the differentially expressed AD risk genes among each comparison (q < 0.05, |FC| > 1.5, cut-off TPM > 5). Upregulated and downregulated genes were shown in red and black, respectively. HBEGF/Hbegf was the only gene commonly deregulated (AD: log2FC = −0.843, q = 0.00861, AppNL-G-F/NL-G-F: log2FC = −1.710, q = 1.32E−23; rTg4510: log2FC = −0.738, q = 1.97E−05). Cd2ap, Mef2c, Plcg2, Sppl2a, Zcwpw1, Ptk2b and Clu were altered specifically in AppNL-G-F/NL-G-F microglia. Sorl1 and Il1rap were specifically deregulated in rTg4510 microglia. Apoe, Scimp, Pld3, Psen1, Psen2, Sqstm1, Trem2, Treml2, Ap2a2, Cass4, and Lmo4l were commonly altered in AppNL-G-F/NL-G-F and rTg4510 microglia. c, d Quantitative PCR analysis to determine expression level for HBEGF/Hbegf mRNA in human precuneus and isolated-microglia from each mouse model. c HBEGF expression level (FC = −1.83, p = 0.00560). d Hbegf expression level (AppNL-G-F/NL-G-F: FC = −1.98, p = 0.000272; rTg4510: FC = −2.19, p = 0.00277). Data are represented as the mean ± SEM. *p < 0.05, **p < 0.001. Bonferroni-corrected Student’s t test. c non-AD (n = 14) and AD (n = 11). d WT (n = 3) and AppNL-G-F/NL-G-F (n = 4); Ctrl and rTg4510 (n = 3 for each genotype). WT, wild-type; Ctrl, control. e Schematic overview of the comparative expression analysis of microglia isolated from mice with amyloid or Tau pathology and human precuneus with early AD. f, g Venn diagrams displaying the number of significantly upregulated (f) and downregulated (g) genes among each comparison between human AD precuneus and microglia isolated from AD mice and controls: 708 deregulated genes (149 upregulated and 559 downregulated) in AD precuneus (non-AD: n = 14 and AD: n = 11; q < 0.05, |FC| > 1.2); 2993 deregulated genes (1196 upregulated and 1797 downregulated) in AppNL-G-F/NL-G-F microglia (n = 4 for each genotype); and 2381 deregulated genes (951 upregulated and 1430 downregulated) in rTg4510 microglia (n = 3 for each genotype) (q < 0.05, |FC| > 1.5, TPM > 5)

Similar articles

Cited by

References

    1. Benjamini Y, Hochberg Y. Controlling the false discovery rate: a practical and powerful approach to multiple testing. J R Stat Soc Ser B. 1995;57:289–300. doi: 10.2307/2346101. - DOI
    1. Braak HBE. Neuropathological stageing of Alzheimer-related changes. Acta Neuropathol. 1991;82:239–259. doi: 10.1007/bf00308809. - DOI - PubMed
    1. Butovsky O, Jedrychowski MP, Moore CS, Cialic R, Lanser AJ, Gabriely G, Koeglsperger T, Dake B, Wu PM, Doykan CE, et al. Identification of a unique TGF-beta-dependent molecular and functional signature in microglia. Nat Neurosci. 2014;17:131–143. doi: 10.1038/nn.3599. - DOI - PMC - PubMed
    1. Cantarella G, Di Benedetto G, Puzzo D, Privitera L, Loreto C, Saccone S, Giunta S, Palmeri A, Bernardini R. Neutralization of TNFSF10 ameliorates functional outcome in a murine model of Alzheimer’s disease. Brain. 2015;138:203–216. doi: 10.1093/brain/awu318. - DOI - PMC - PubMed
    1. Castillo E, Leon J, Mazzei G, Abolhassani N, Haruyama N, Saito T, Saido T, Hokama M, Iwaki T, Ohara T, et al. Comparative profiling of cortical gene expression in Alzheimer’s disease patients and mouse models demonstrates a link between amyloidosis and neuroinflammation. Sci Rep. 2017;7:17762. doi: 10.1038/s41598-017-17999-3. - DOI - PMC - PubMed

Publication types

MeSH terms