. 2021 Feb 17;41(7):1401-1417.
doi: 10.1523/JNEUROSCI.1492-20.2020. Epub 2021 Jan 5.

Structural and Functional Synaptic Plasticity Induced by Convergent Synapse Loss in the Drosophila Neuromuscular Circuit

Affiliations

Structural and Functional Synaptic Plasticity Induced by Convergent Synapse Loss in the Drosophila Neuromuscular Circuit

Yupu Wang et al. J Neurosci. .

Abstract

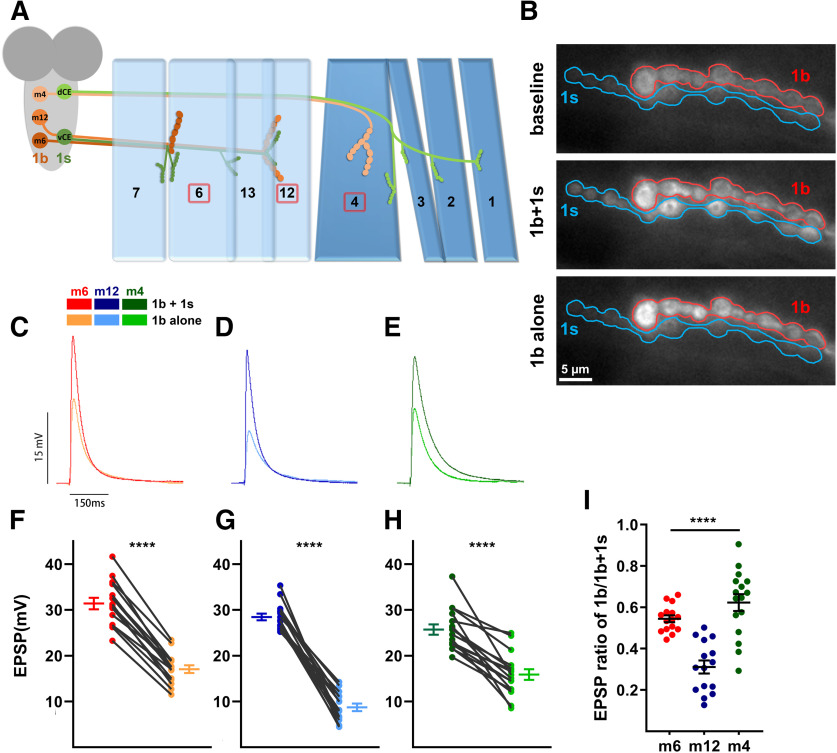
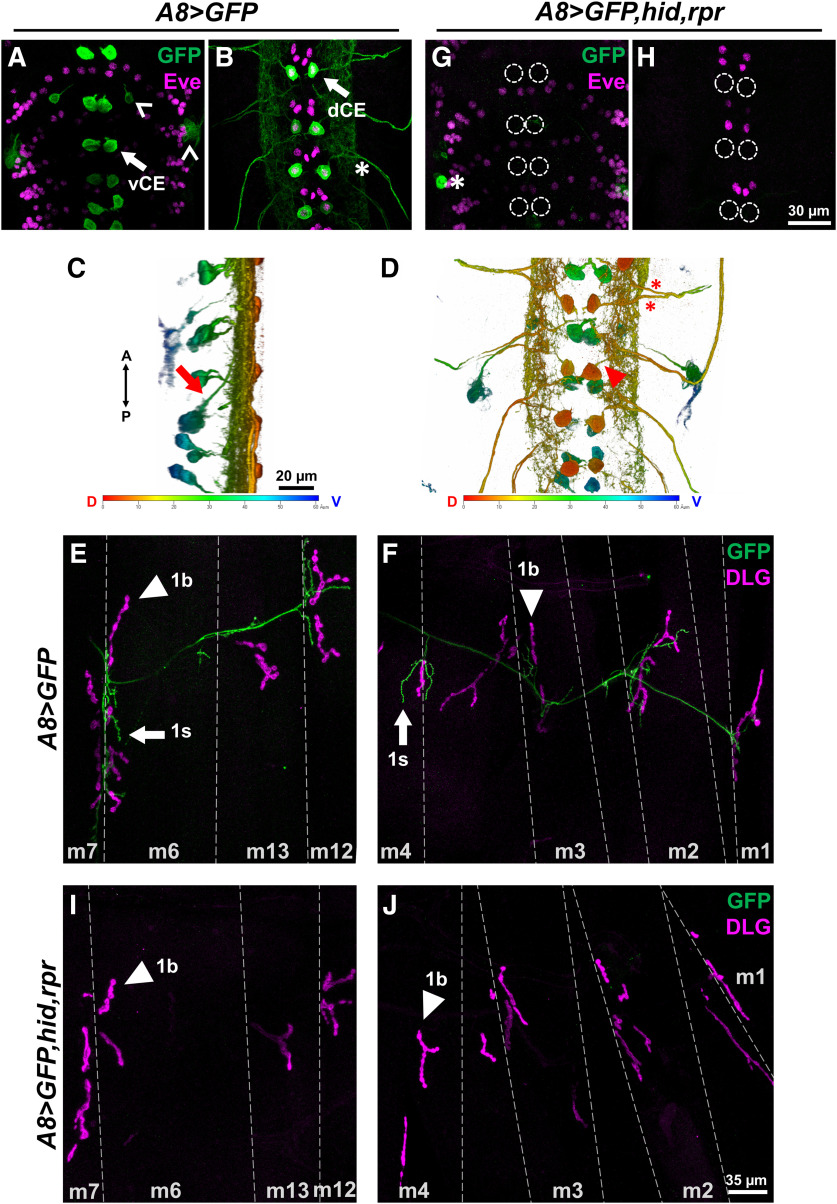
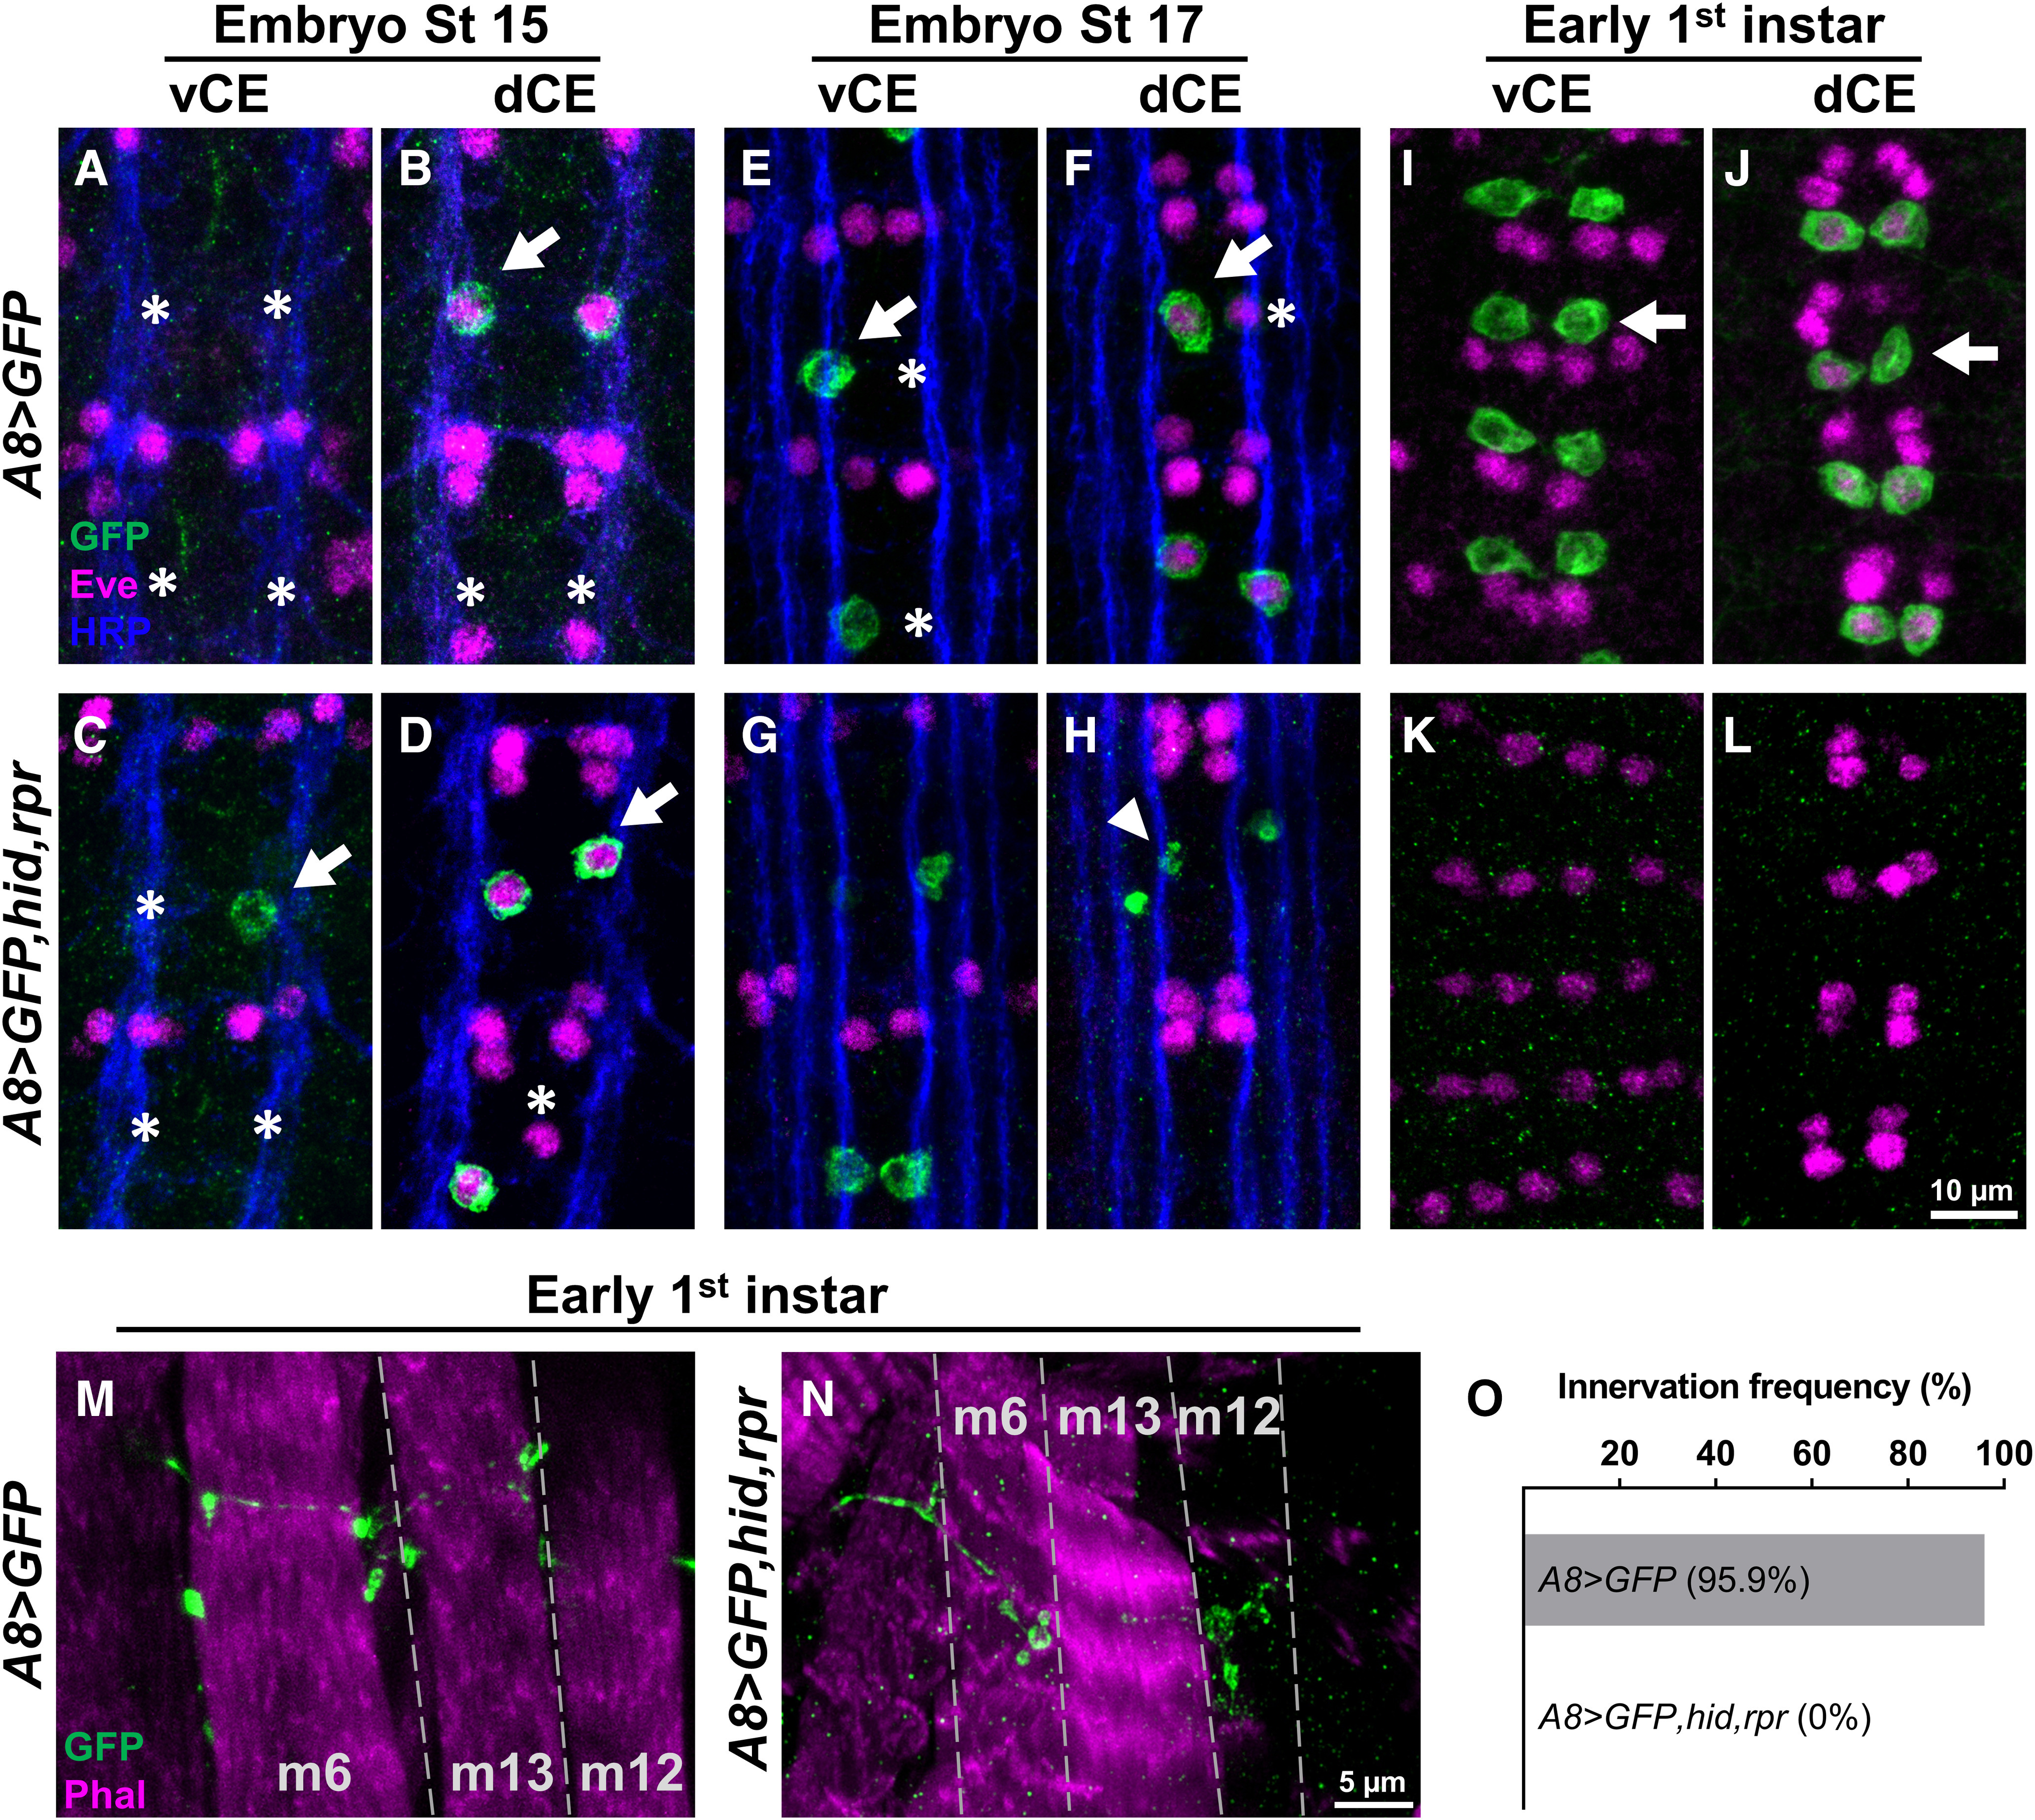
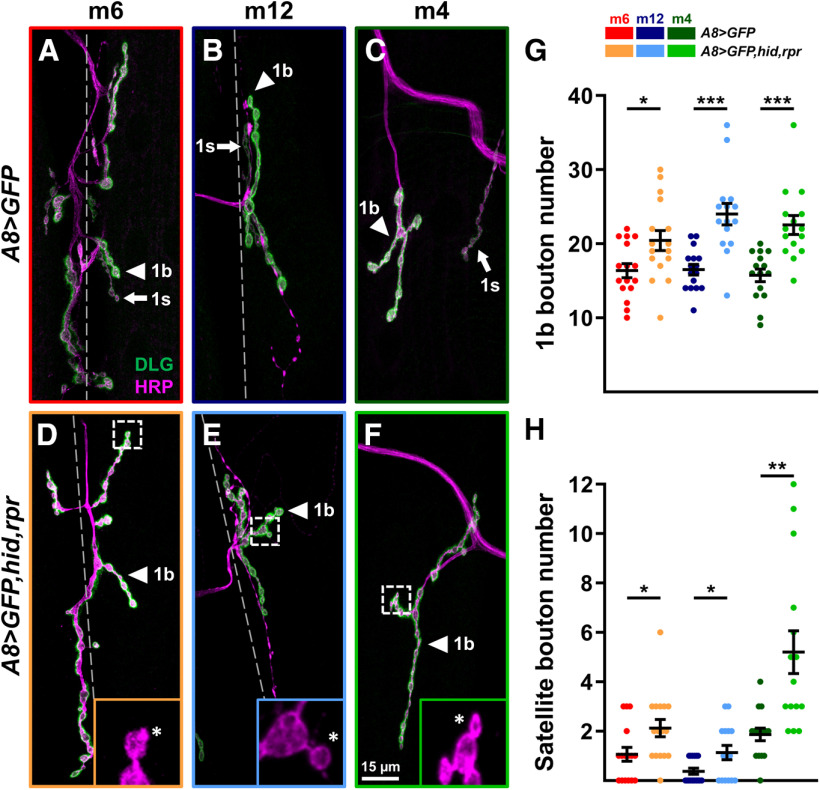
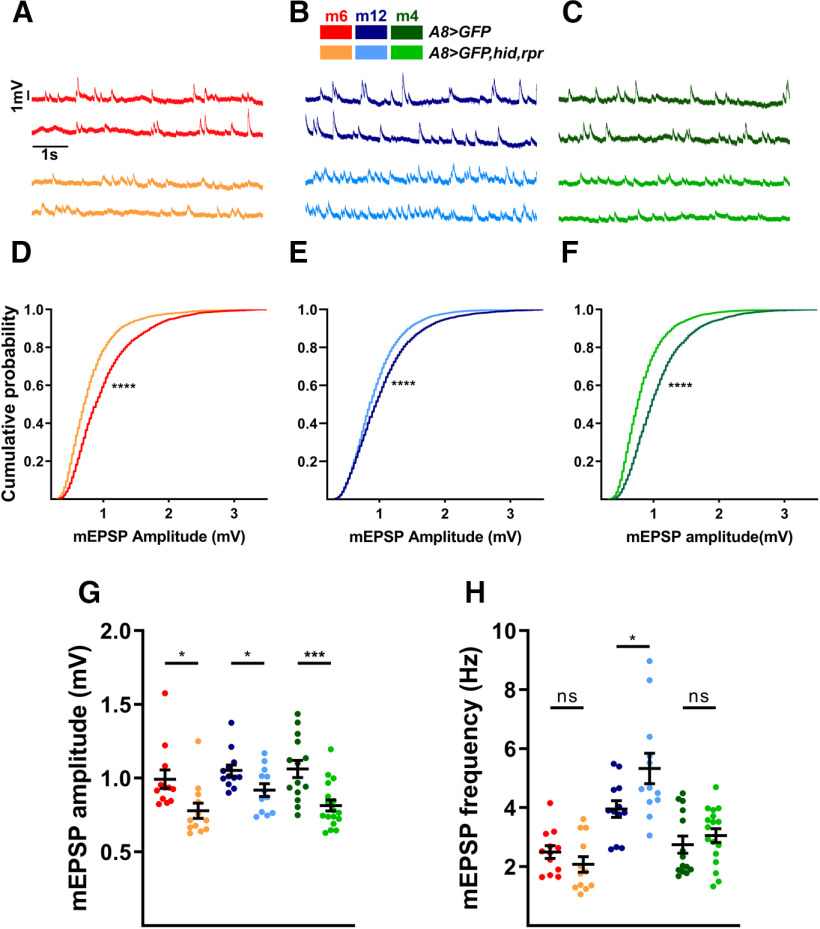
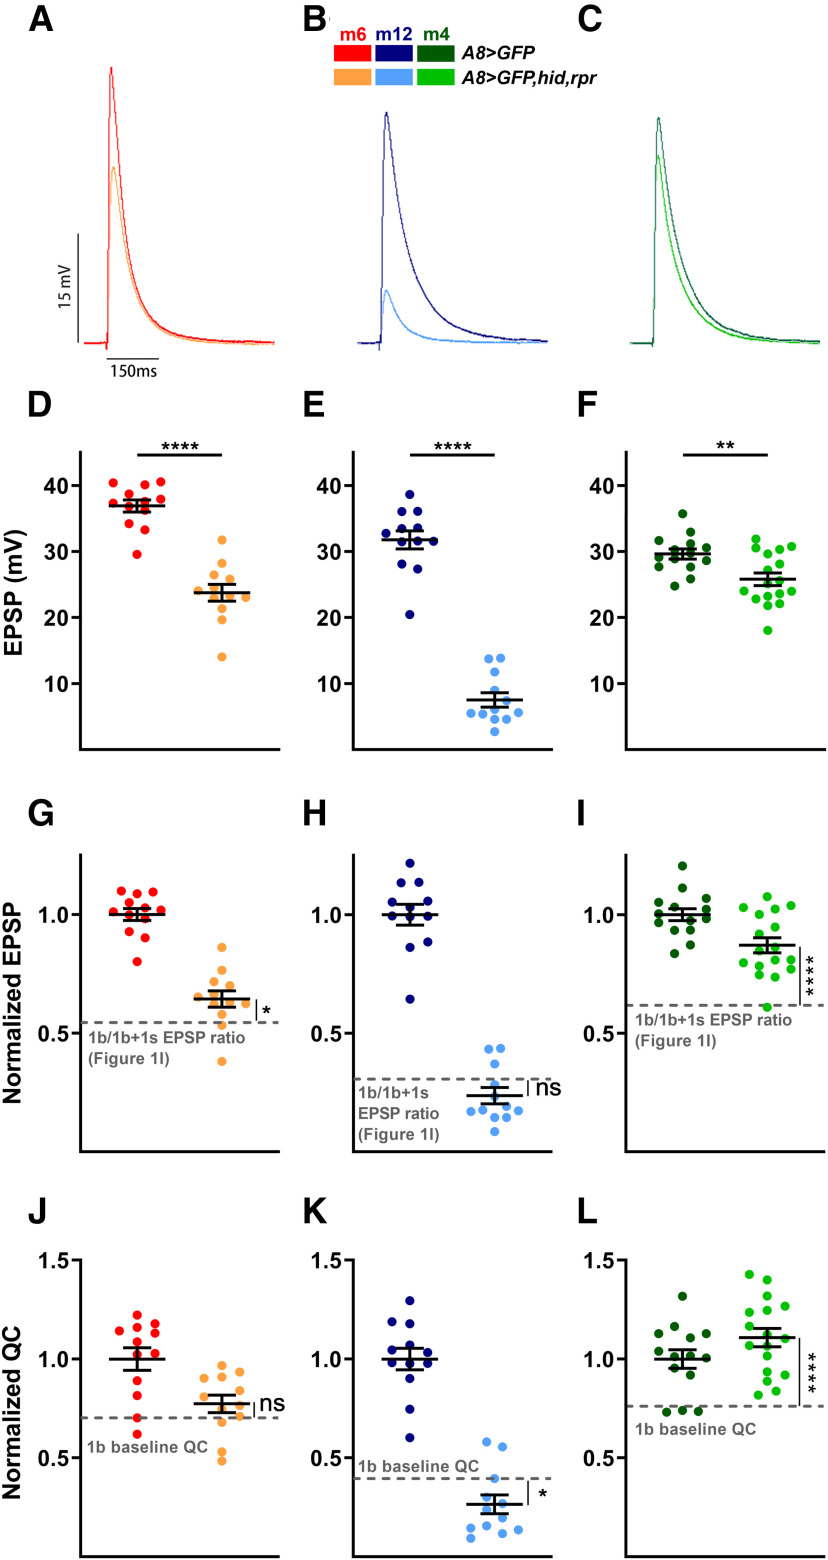
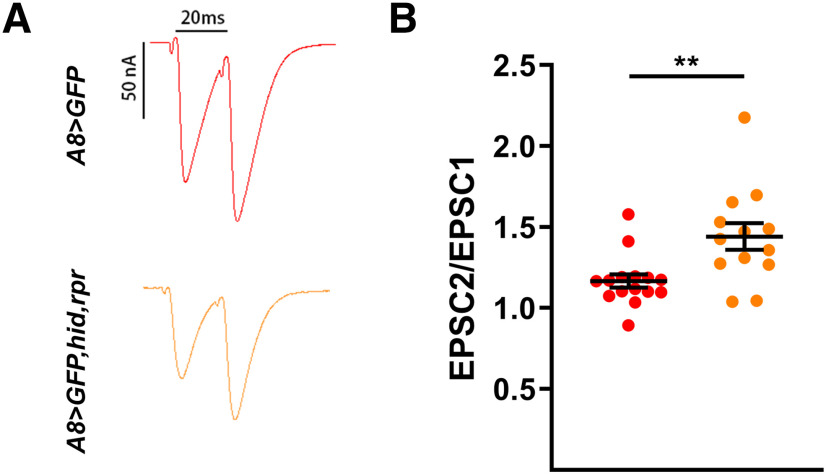
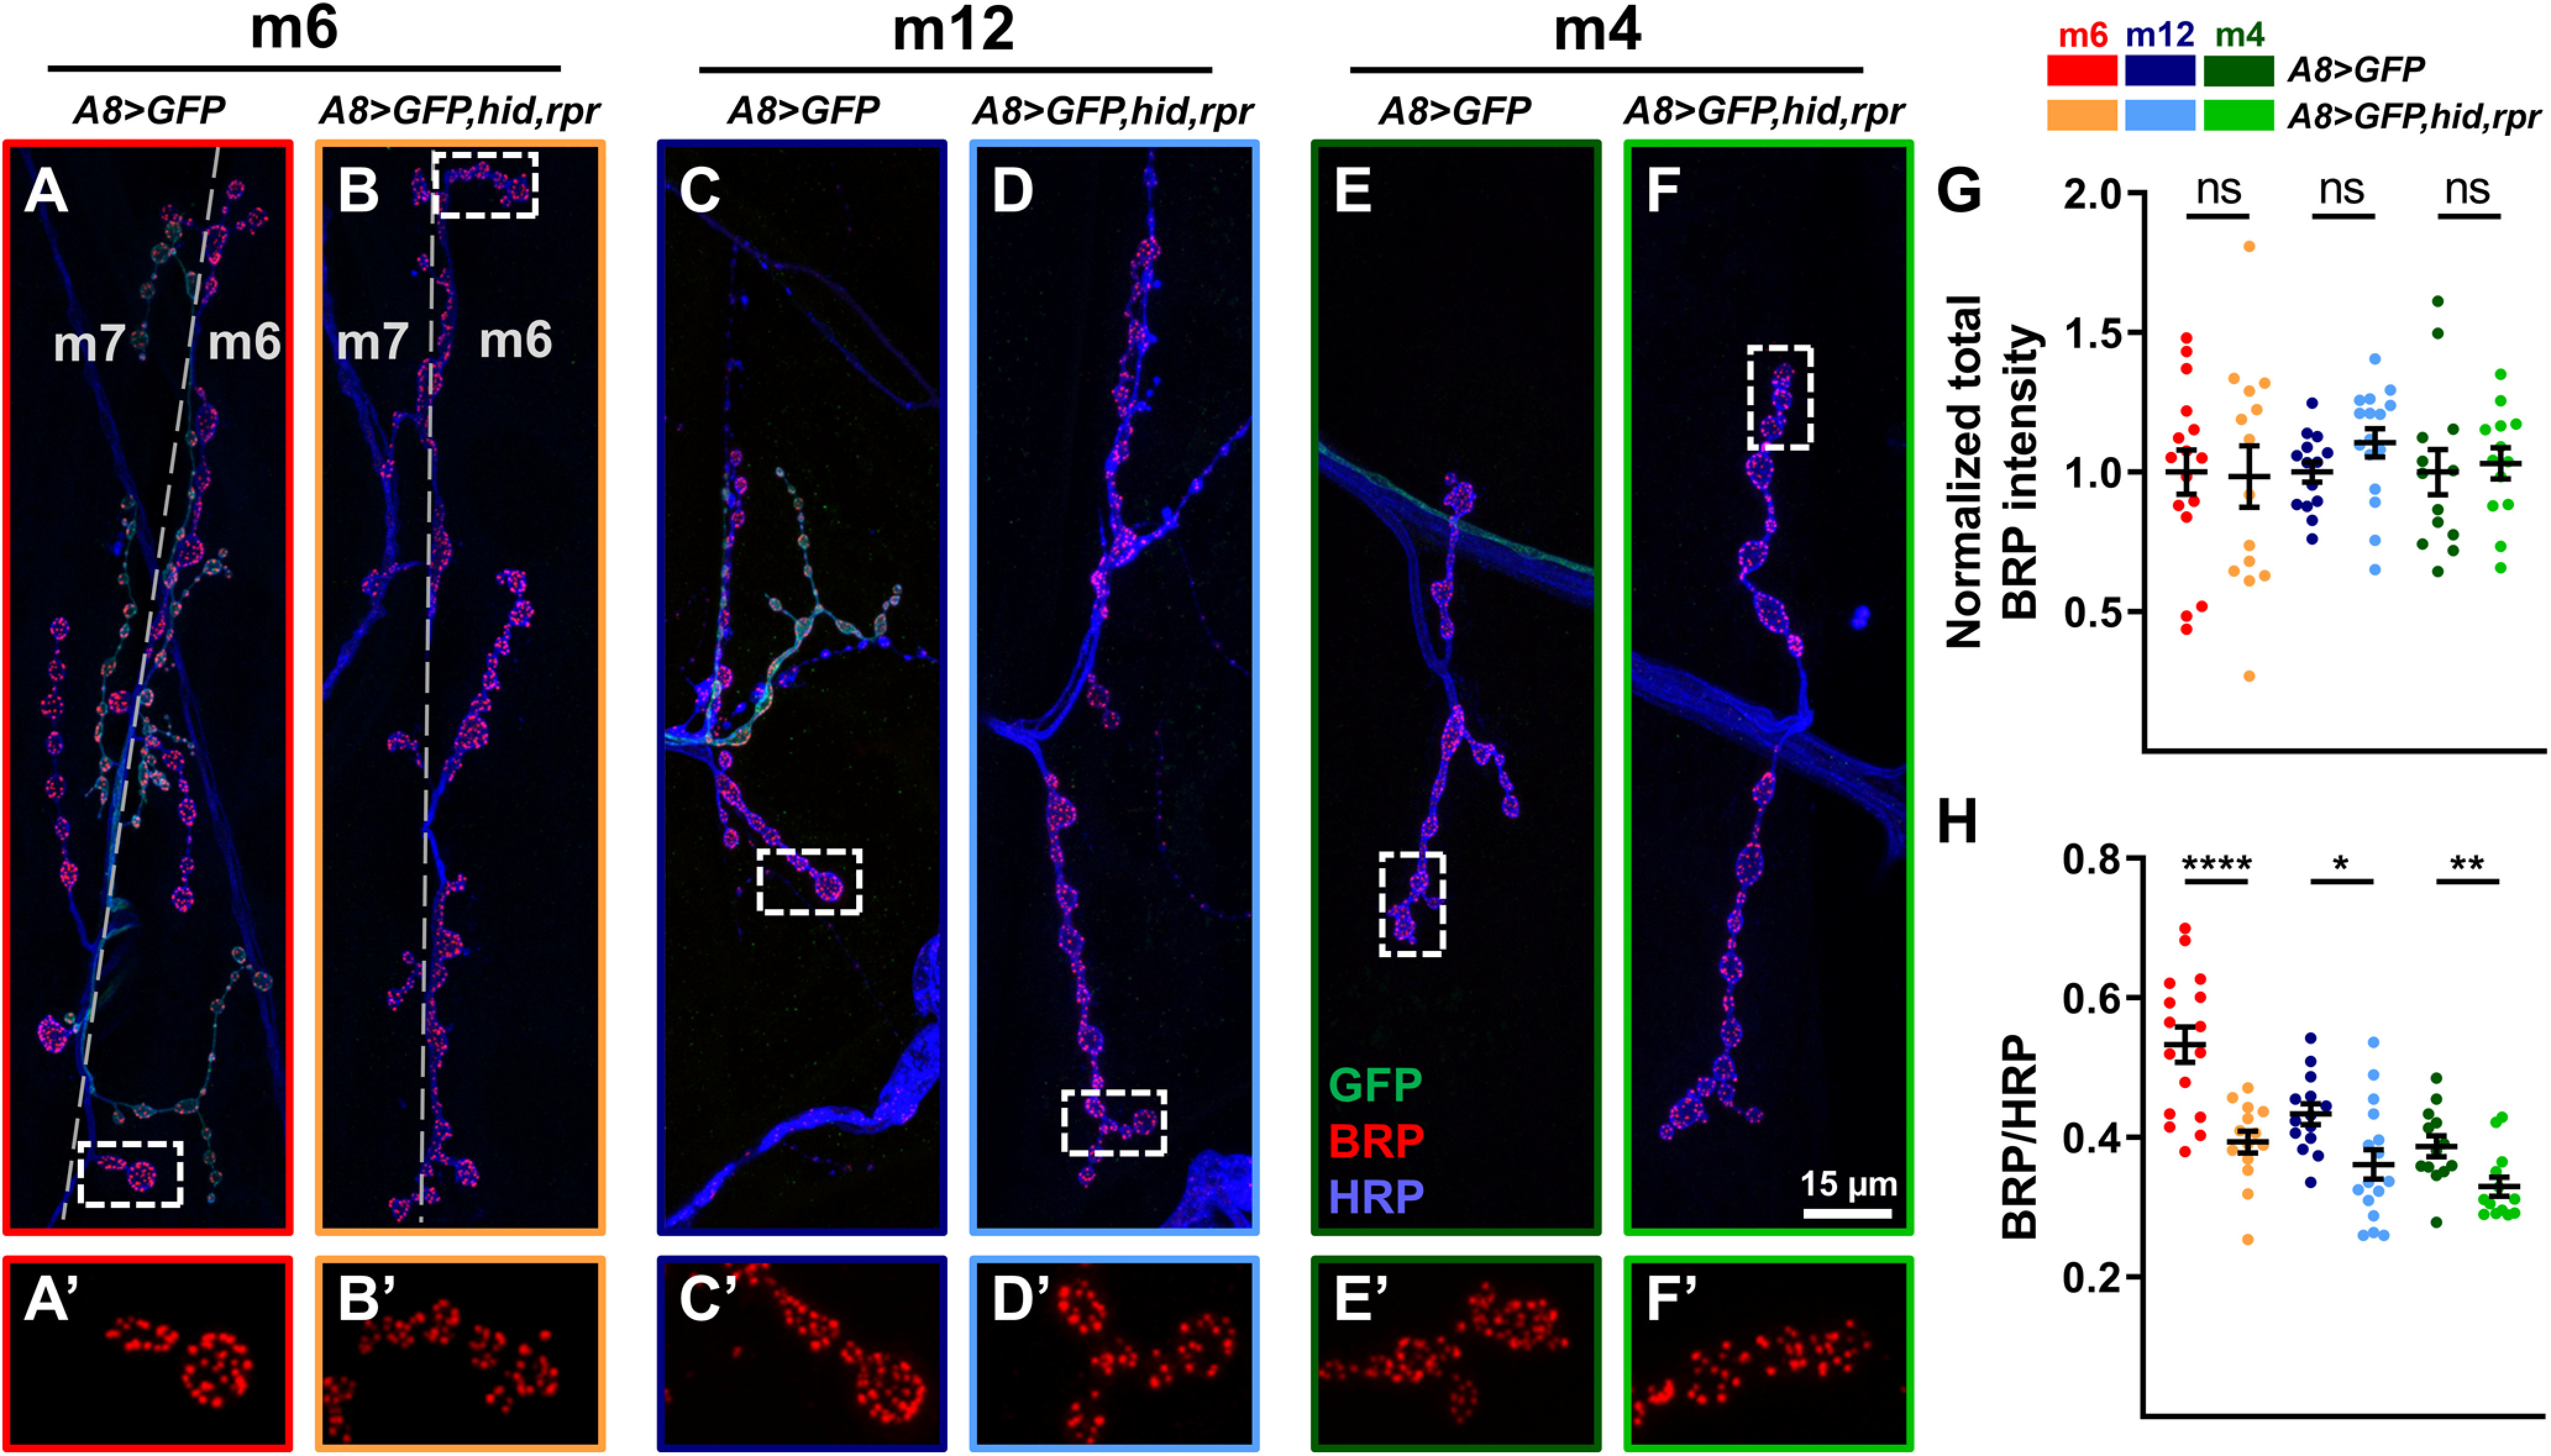
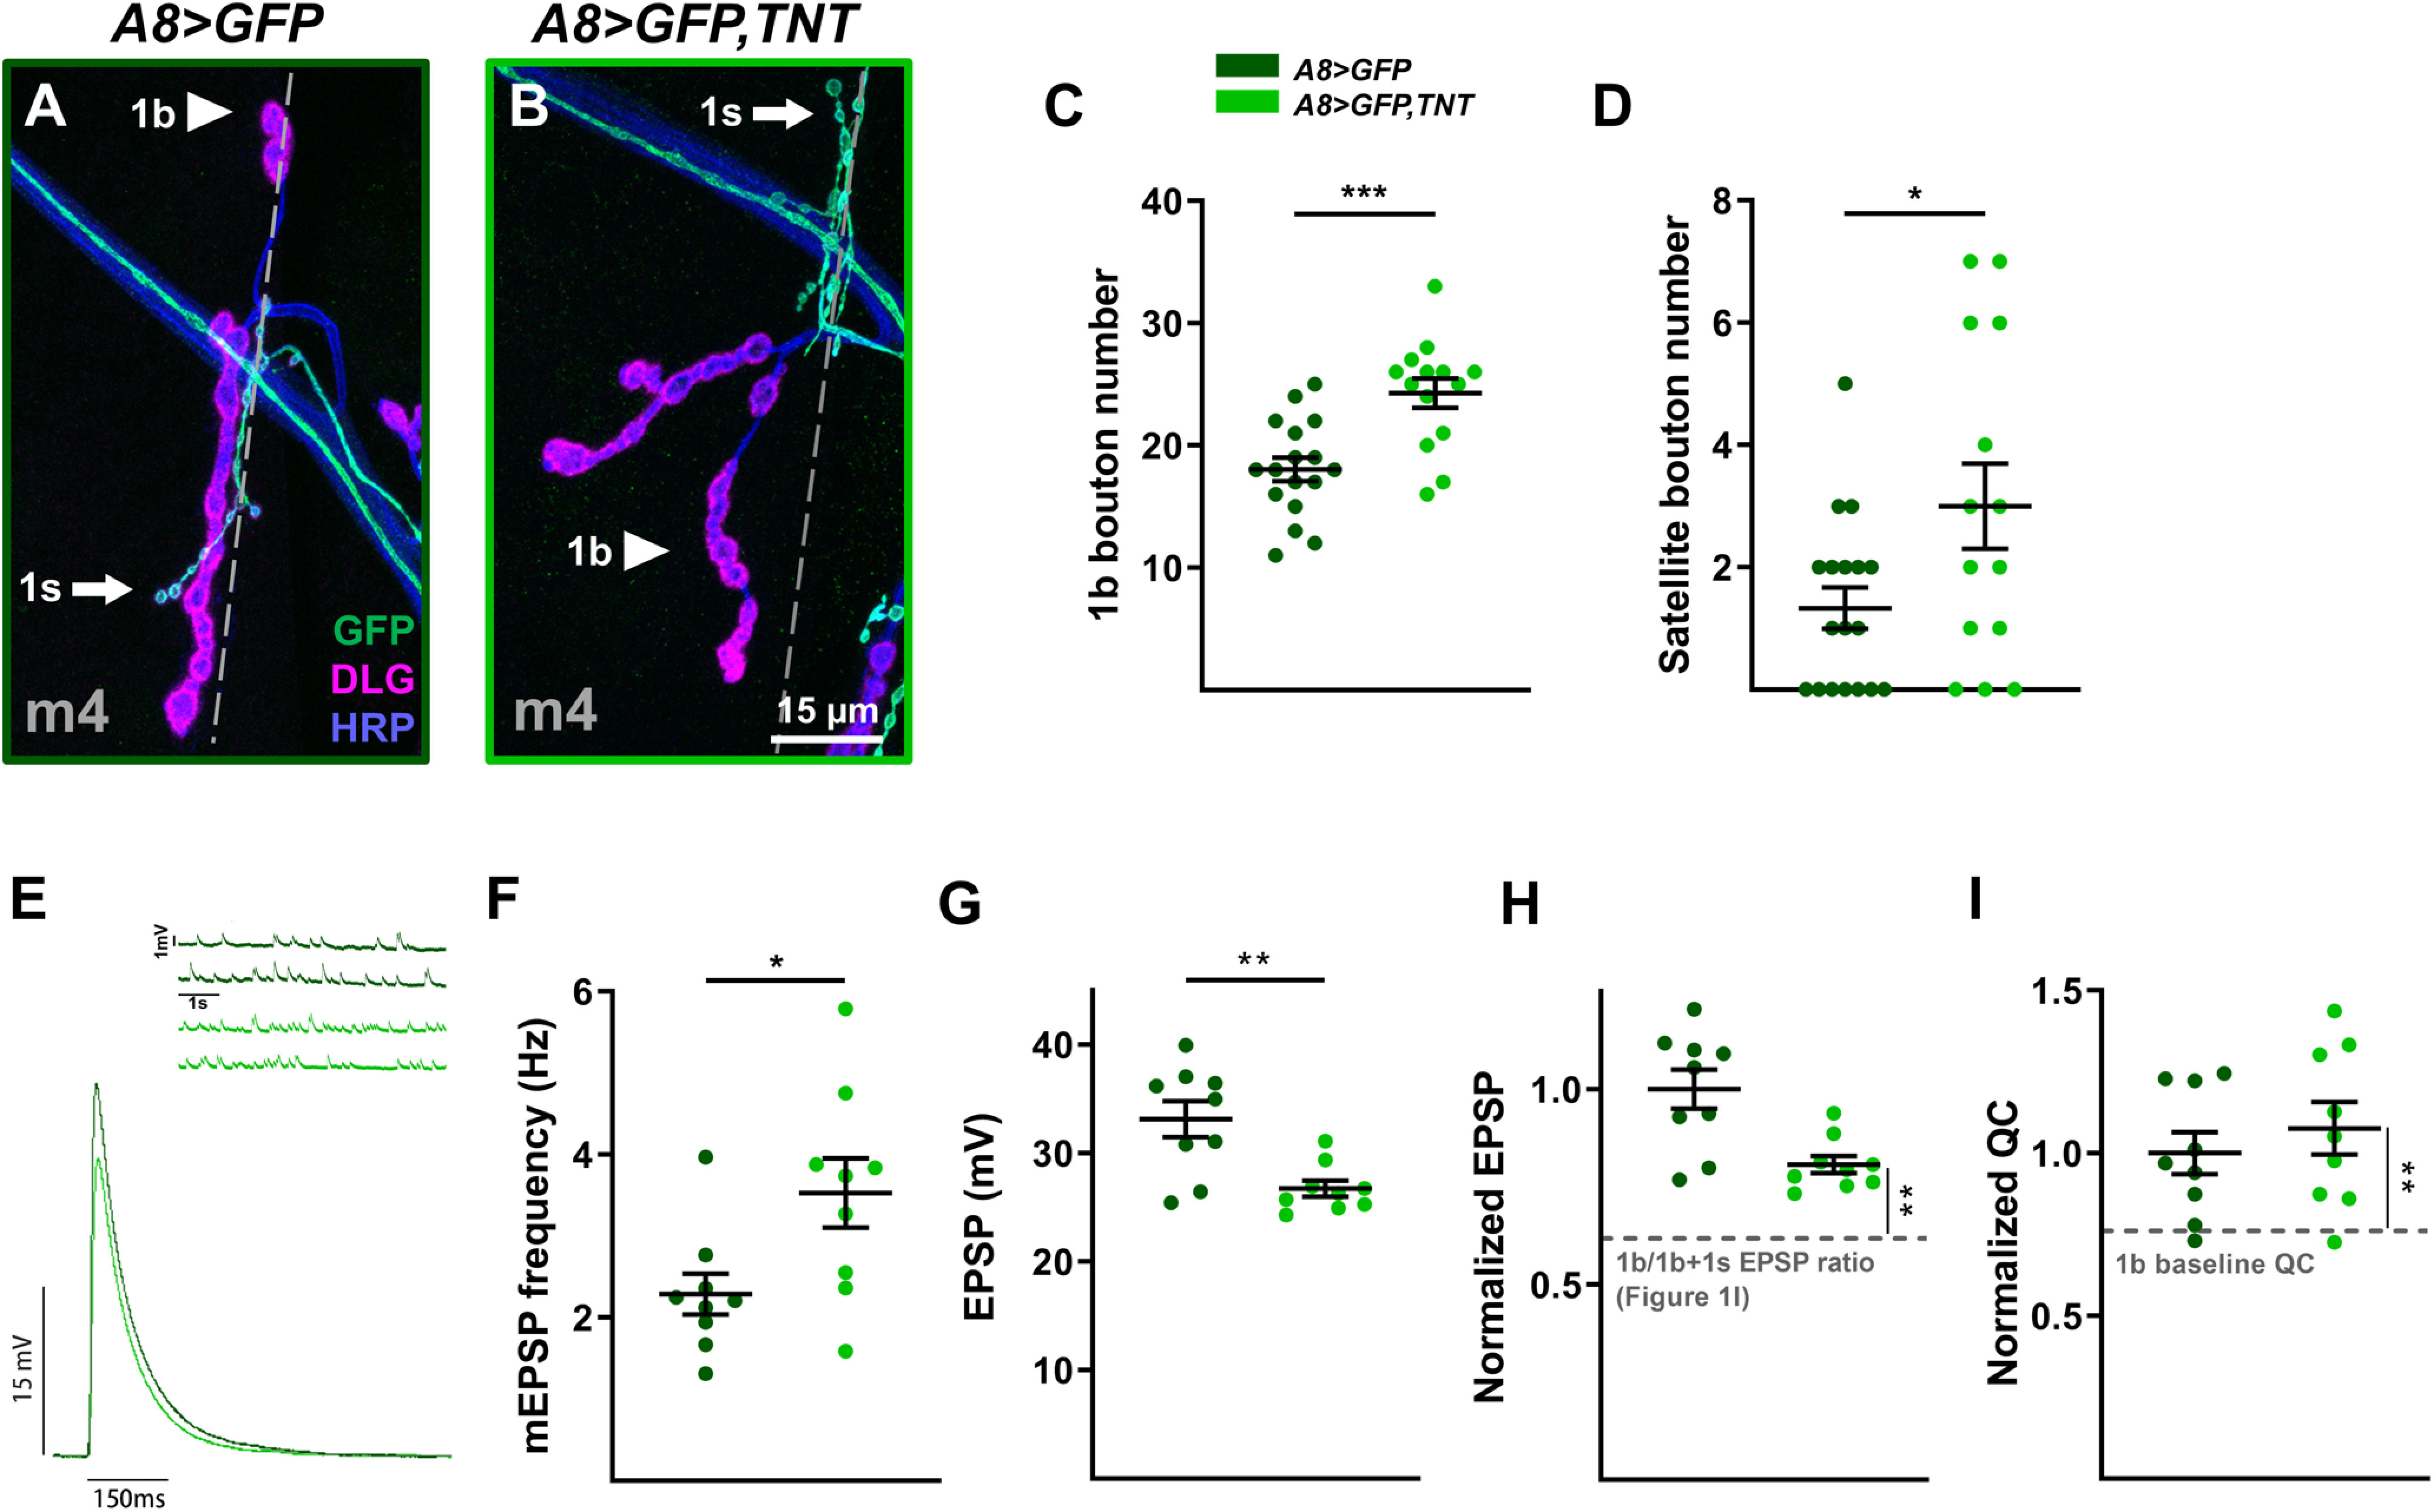
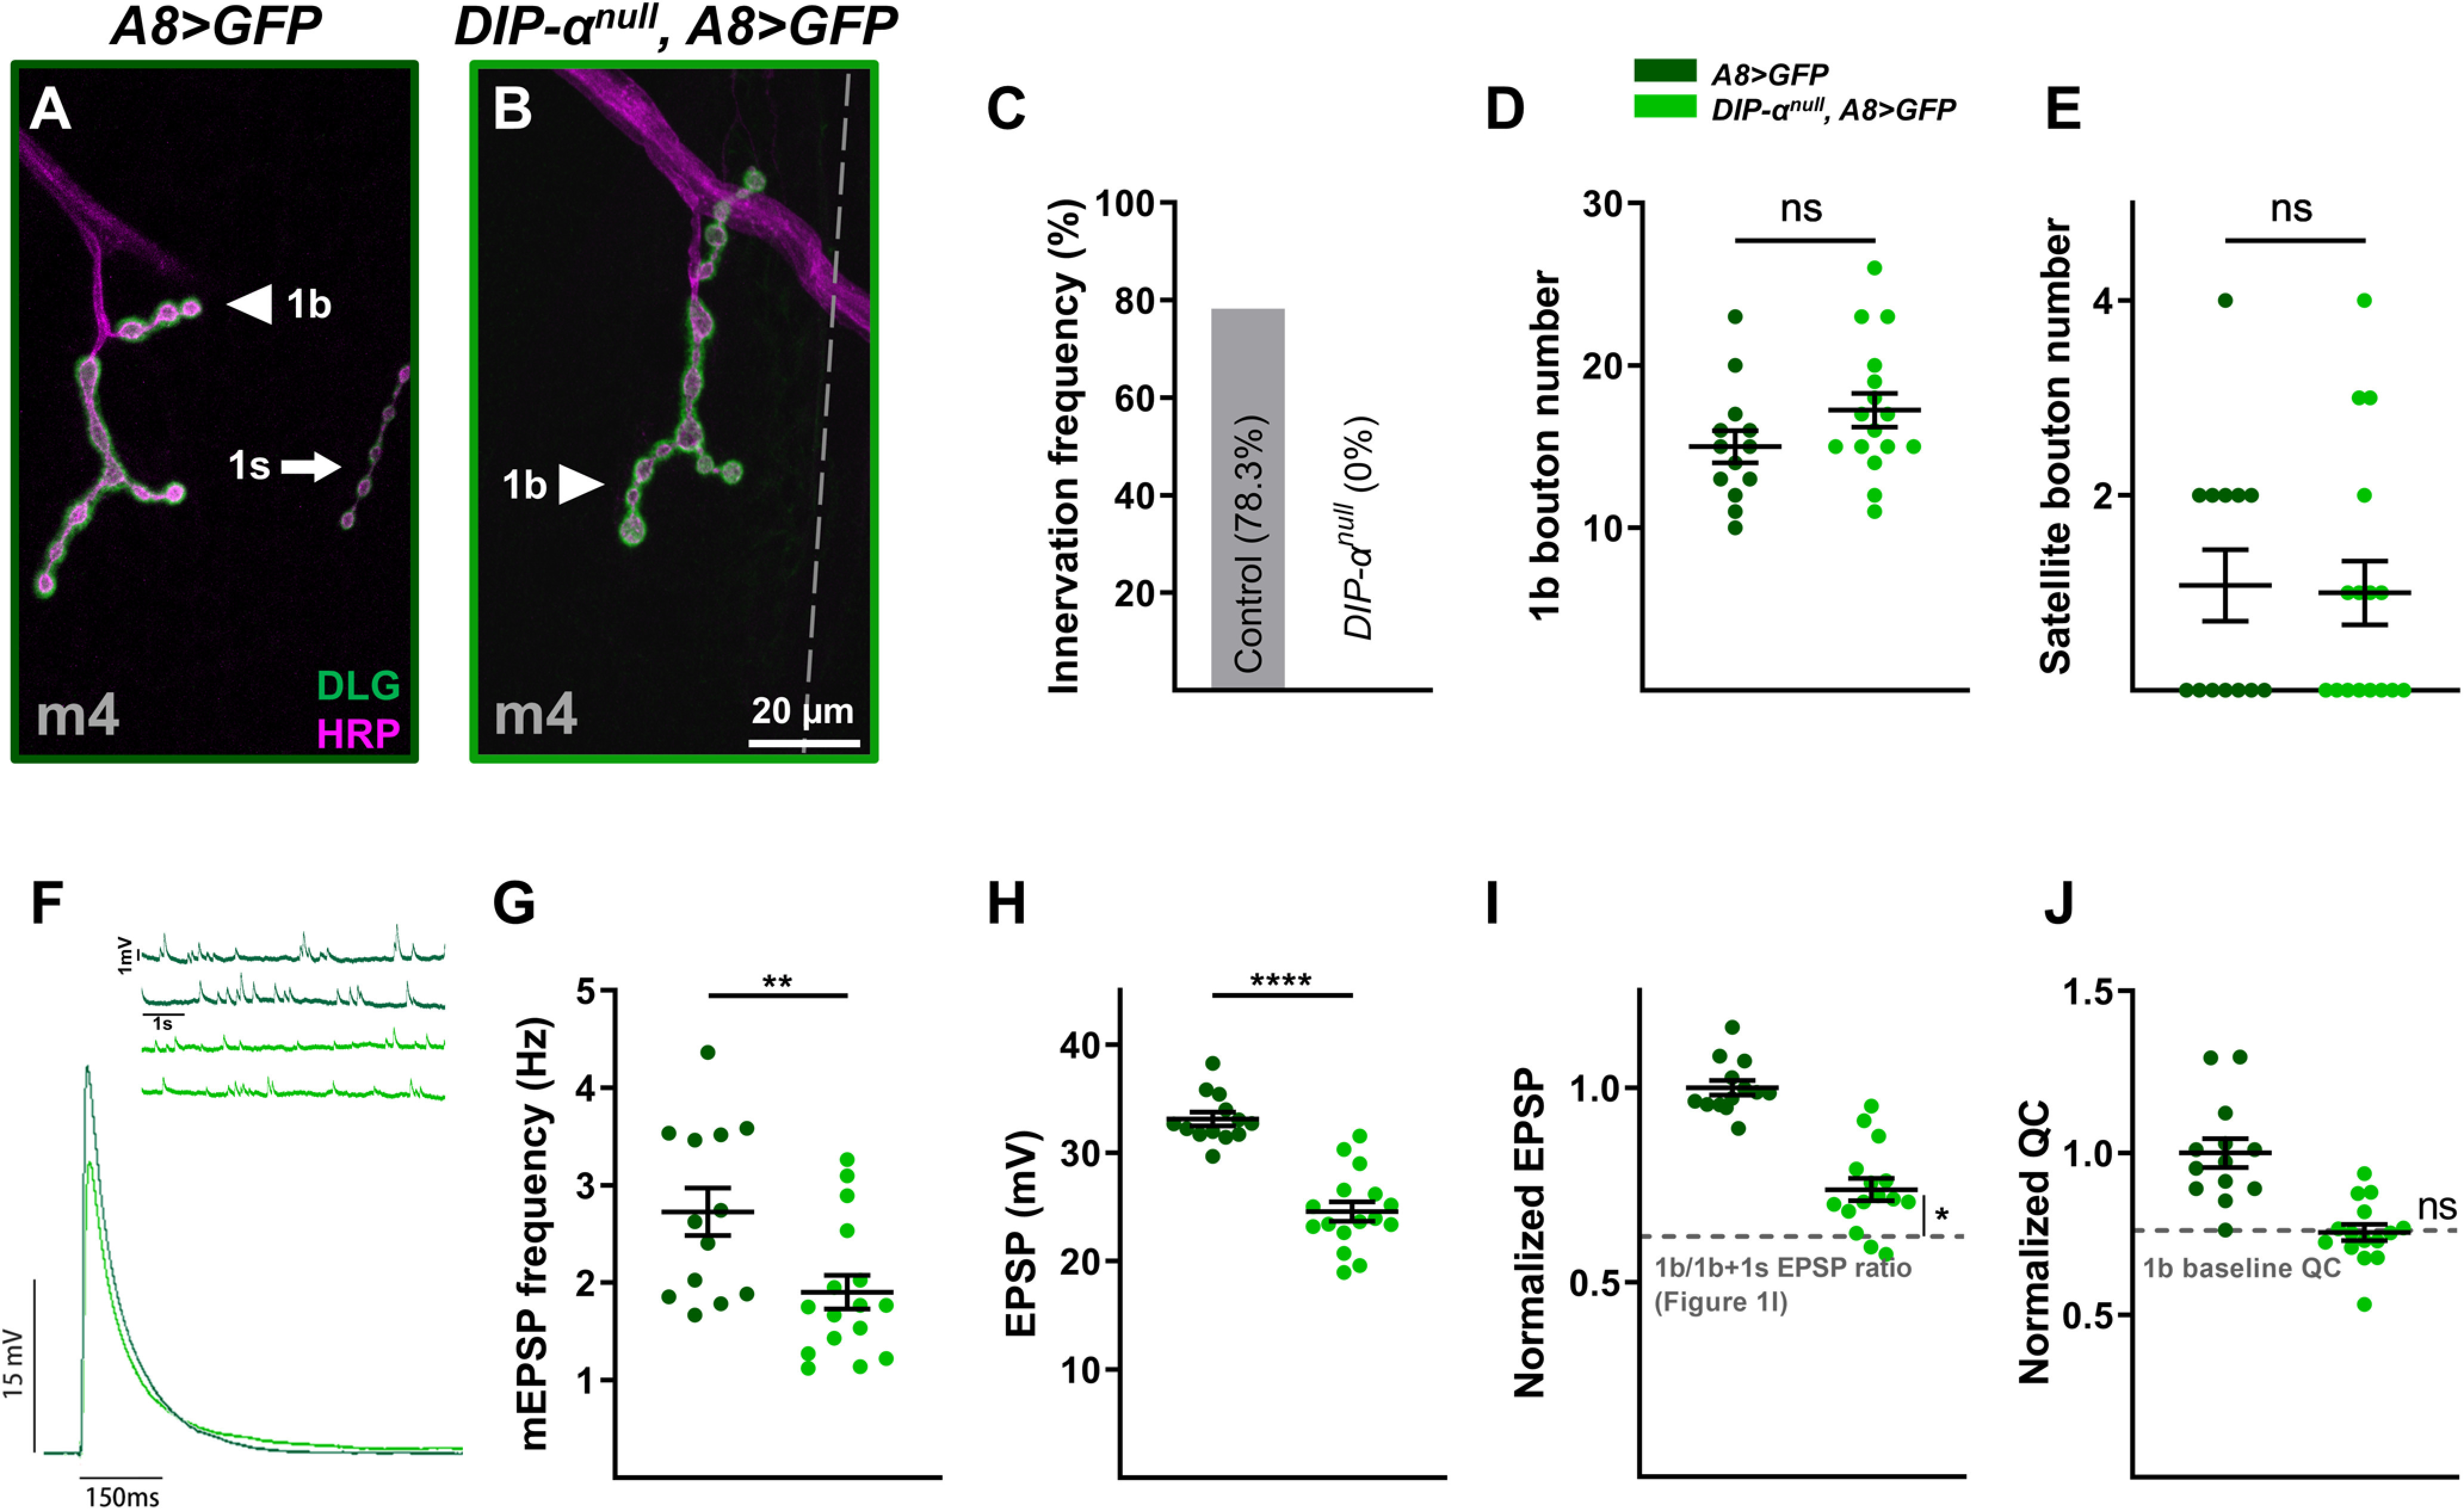
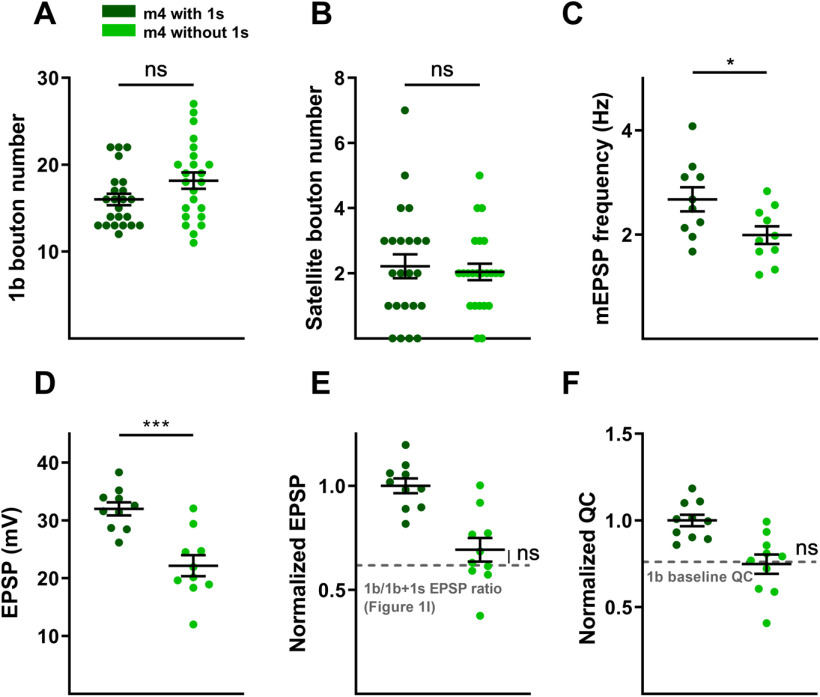
Throughout the nervous system, the convergence of two or more presynaptic inputs on a target cell is commonly observed. The question we ask here is to what extent converging inputs influence each other's structural and functional synaptic plasticity. In complex circuits, isolating individual inputs is difficult because postsynaptic cells can receive thousands of inputs. An ideal model to address this question is the Drosophila larval neuromuscular junction (NMJ) where each postsynaptic muscle cell receives inputs from two glutamatergic types of motor neurons (MNs), known as 1b and 1s MNs. Notably, each muscle is unique and receives input from a different combination of 1b and 1s MNs; we surveyed multiple muscles for this reason. Here, we identified a cell-specific promoter that allows ablation of 1s MNs postinnervation and measured structural and functional responses of convergent 1b NMJs using microscopy and electrophysiology. For all muscles examined in both sexes, ablation of 1s MNs resulted in NMJ expansion and increased spontaneous neurotransmitter release at corresponding 1b NMJs. This demonstrates that 1b NMJs can compensate for the loss of convergent 1s MNs. However, only a subset of 1b NMJs showed compensatory evoked neurotransmission, suggesting target-specific plasticity. Silencing 1s MNs led to similar plasticity at 1b NMJs, suggesting that evoked neurotransmission from 1s MNs contributes to 1b synaptic plasticity. Finally, we genetically blocked 1s innervation in male larvae and robust 1b synaptic plasticity was eliminated, raising the possibility that 1s NMJ formation is required to set up a reference for subsequent synaptic perturbations.SIGNIFICANCE STATEMENT In complex neural circuits, multiple convergent inputs contribute to the activity of the target cell, but whether synaptic plasticity exists among these inputs has not been thoroughly explored. In this study, we examined synaptic plasticity in the structurally and functionally tractable Drosophila larval neuromuscular system. In this convergent circuit, each muscle is innervated by a unique pair of motor neurons. Removal of one neuron after innervation causes the adjacent neuron to increase neuromuscular junction outgrowth and functional output. However, this is not a general feature as each motor neuron differentially compensates. Further, robust compensation requires initial coinnervation by both neurons. Understanding how neurons respond to perturbations in adjacent neurons will provide insight into nervous system plasticity in both healthy and disease states.

Keywords: co-innervation; compensation; neuromuscular junction; neurotransmission; plasticity; synaptic growth.


Figures

Figure 1.
Figure 1.
1b and 1s MNs differentially contribute to the total EPSPs. A, Schematic of the innervation pattern of a subset of 1s MNs (vCE: dark green; dCE: light green) and 1b MNs (m6-1b: rust; m12-1b: orange; m4-1b: peach). Muscles analyzed in this study are marked by the red boxes. B, Representative frames showing the baseline fluorescence (top), 1b + 1s firing event (middle), and 1b alone firing event (bottom) of m6 in MHC-CD8::GCaMP6f-Sh larvae (1b: red; 1s: blue; also see Movie 1). C–E, Representative EPSP traces of 1b + 1s and 1b alone on m6 (C), m12 (D), and m4 (E). Traces and graphs are color coded as indicated in the color key. F–H, Paired EPSP amplitudes of m6 (F, t(14)=18.60, p < 0.0001, paired t test), m12 (G, t(14)=15.73, p < 0.0001, paired t test), and m4 (H, t(15)=7.43, p < 0.0001, paired t test). I, Calculated EPSP ratios of 1b/1b + 1s of m6, m12, and m4 (F(2,43)=26.03, p < 0.0001, one-way ANOVA, Tukey post hoc test). Error bars indicate ±SEM ****p < 0.0001. n values (NMJs/larva) are 15/12, 15/12, and 16/15, respectively.
Figure 2.
Figure 2.
A8-GAL4 drives expression in 1s MNs and can be used to ablate 1s MNs. A, B, Representative third instar larval VNC z-sections showing ventral (A) and dorsal (B) cell bodies labeled with GFP (green) and Eve (magenta; labels nuclei of dCE and other neurons) in A8>GFP. Arrows indicate GFP-positive vCE and dCE cell bodies. Carets indicate other cells that express A8. Asterisks indicate two axons exiting the VNC. C, D, 3D representations of A8-expressing neurons in the VNC viewed from lateral (C) and dorsal (D) sides (same VNC as A and B). Arrow in C shows a ventral cell (left, green) that projects an axon to the dorsal midline. Arrowhead in D shows an ipsilateral projection from a dorsal cell. Heat map colors are as follows: red denotes the dorsal-most region; and blue denotes the ventral most region. Asterisks indicate axons exiting the VNC similar to B. E, F, Representative third instar larval abdominal hemisegment labeled with GFP (green) and the postsynaptic marker DLG (magenta) in A8>GFP. Ventral muscles (m6, m7, m13, and m12) innervated by vCE (E) and dorsal muscles (m4, m3, m2 and m1) innervated by dCE (F). Arrows indicate 1s NMJs and arrowheads indicate 1b NMJs. G, H, Representative third instar larval VNCs lacking vCE (G) and dCE (H) labeled with GFP (green) and Eve (magenta) in A8>GFP,hid,rpr. Dashed circles mark the absence of vCE and dCE. Note that both vCE and dCE cell bodies are ablated by the third instar stage. Asterisk marks a GFP-positive cell that remained. I, J, Representative third instar larval abdominal hemisegment showing ventral muscles (I) and dorsal muscles (J), labeled with GFP (green) and DLG (magenta) in A8>GFP,hid,rpr. Note that all NMJs from vCE and dCE are absent (no GFP). Arrowheads indicate 1b NMJs.
Figure 3.
Figure 3.
A8>hid,rpr-induced cell death occurs after 1s innervation. A–L, Representative images depicting the presence or absence of vCE and dCE cell bodies from embryonic stage 15 (A–D), stage 17 (E–H), and early first instar (I–L) larval VNCs labeled with GFP (green), Eve (magenta), and Fasciclin 2 (blue) in control (A8>GFP) and 1s-ablated (A8>GFP,hid,rpr) animals. Arrows and asterisks indicate the cells expressing or not expressing A8, respectively. A, B, A8 expression begins at embryonic stage 15. In A8>GFP,hid,rpr, vCEs, and dCEs undergo apoptosis starting at embryonic stage 17 (G, H), noted by the loss of Eve staining in dCE and GFP-positive debris (indicated by arrowhead), and are completely absent in early first instar larvae (K, L). M, N, Representative 1s NMJs labeled with GFP (green) and a muscle marker, phalloidin (magenta), in control (M) and 1s-ablated early first instar larvae (N). Note that 1s NMJs are labeled by GFP in control animals, and some 1s NMJs are still present in A8>GFP,hid,rpr animals, suggesting that A8>GFP,hid,rpr-induced cell death happens after 1s NMJ formation. O, Innervation frequency of 1s MNs in control and 1s-ablated late first instar larvae. Three muscles (m6, m12, and m4) were pooled and analyzed together. All 1s NMJs were eliminated in 1s-ablated animals by this stage. n values (NMJs/larva) are 76/5 and 86/5 for O.
Figure 4.
Figure 4.
1b NMJs expand upon ablation of 1s MNs. A–F, Representative NMJ arbors (1b arbors and 1s arbors, arrowheads and arrows, respectively) of m6 (A, D), m12 (B, E), and m4 (C, F) labeled with DLG (green) and HRP (magenta) in control (A8>GFP) and 1s-ablated (A8>GFP,hid,rpr) third instar larvae. Insets are 5× zoomed images of corresponding dashed regions in D–F. Satellite boutons are indicated by asterisks. Note that 1s NMJs are absent in 1s-ablated animals. Images and graphs are color coded as indicated in the color key. G, Quantification of 1b bouton number of m6 (t(30)=2.458, p = 0.02, unpaired t test), m12 (t(26)=4.449, p = 0.0001, unpaired t test), and m4 (t(28)=4.431, p = 0.0001, unpaired t test) in control and 1s-ablated animals (satellite 1b boutons were not included). H, Quantification of satellite boutons of m6 (t(30)=2.359, p = 0.025, unpaired t test), m12 (t(19.05)=2.397, p = 0.0269, unpaired t test with Welch's correction), and m4 (t(16.41)=3.682, p = 0.0019, unpaired t test with Welch's correction) in control and 1s-ablated animals. Error bars indicate ±SEM. *p < 0.05, **p < 0.01, ***p < 0.001. n values (NMJs/larva) are 16/8, 16/8, 16/8, 15/8, 15/8, and 15/8, respectively.
Figure 5.
Figure 5.
Loss of 1s MNs decreases overall mEPSP amplitudes and increases 1b mEPSP frequencies. A–C, Representative mEPSP recordings of m6 (A), m12 (B), and m4 (C) in control (A8>GFP) and 1s-ablated (A8>GFP,hid,rpr) animals. Traces and graphs are color coded as indicated in the color key. D–F, Pooled cumulative probability distributions of m6 (D; p < 0.0001, K-S test), m12 (E; p < 0.0001, K-S test), and m4 (F; p < 0.0001, K-S test). G, Quantification of mEPSP amplitude of m6 (t(22) = 2.630, p = 0.0153, unpaired t test), m12 (t(22) = 2.294, p = 0.0317, unpaired t test), and m4 (t(29) = 3.700, p = 0.0009, unpaired t test) in control and 1s-ablated animals. Each data point represents the average mEPSP amplitude from one sample. H, Quantification of mEPSP frequencies of m6 (t(22) = 1.224, p = 0.2339, unpaired t test), m12 (t(22) = 2.331, p = 0.0293, unpaired t test), and m4 (t(29) = 0.8369, p = 0.4095, unpaired t test) in control and 1s-ablated animals. Each data point represents the average mEPSP frequency from one sample. Error bars indicate ±SEM. *p < 0.05, ***p < 0.001, ****p < 0.0001, ns - not significant. n values (NMJs/larva) are 12/9, 12/11, 12/9, 12/12, 14/11, and 17/14, respectively.
Figure 6.
Figure 6.
1b NMJs elevate evoked neurotransmission in a target-specific manner in the absence of 1s inputs. A–C, Representative EPSP traces of m6 (A), m12 (B), and m4 (C) in control (A8>GFP) and 1s-ablated (A8>GFP,hid,rpr) animals. Traces and graphs are color coded as indicated in the color key. D–F, Quantification of EPSP amplitudes in m6 (D; t(22) = 8.306, p < 0.0001, unpaired t test), m12 (E; t(22) = 13.82, p < 0.0001, unpaired t test), and m4 (F; t(29) = 3.057, p = 0.0048, unpaired t test) in control and 1s-ablated animals. G–I, Normalized EPSPs of m6 (G; t(25) = 2.301, p = 0.0300, unpaired t test), m12 (H; t(25) = 1.552, p = 0.1332, unpaired t test), and m4 (I; t(31) = 4.605, p < 0.0001, unpaired t test) in control and 1s-ablated third instar larvae. Normalized EPSPs in A8>GFP,hid,rpr are compared with the EPSP ratio of 1b/1b + 1s calculated from corresponding muscles in Figure 1I, indicated by gray dashed line. Note m6-1b slightly compensates, m12-1b does not compensate and m4 largely compensates the loss of 1s MNs. J–L, Normalized QC of m6 (J; t(25) = 1.239, p = 0.2268, unpaired t test), m12 (K; t(25) = 2.119, p = 0.0442, unpaired t test), and m4 (L; t(31) = 4.639, p < 0.0001, unpaired t test) in control and 1s-ablated larvae. Normalized QCs were compared with 1b baseline QC (see Materials and Methods). Note m4-1b shows an increased QC, while m12-1b shows a decrease. Error bars indicate ±SEM. *p < 0.05, **p < 0.01, ****p < 0.0001, ns - not significant. n values (NMJs/larva) are 12/9, 12/11, 12/9, 12/12, 14/11, and 17/14, respectively.
Figure 7.
Figure 7.
Overall paired-pulse ratio is increased upon ablation of 1s MNs. A, Representative paired-pulse recordings of m6 in control (A8>GFP) and 1s-ablated (A8>GFP,hid,rpr) animals. B, Quantification of paired-pulse ratio (EPSC2/EPSC1) in control (red) and 1s-ablated animals (orange; t(26) = 3.120, p = 0.0044, unpaired t test). n values (NMJs/larva) are 15/10, 13/10, respectively. Error bars indicate ±SEM. **p < 0.01.
Figure 8.
Figure 8.
Quantification of BRP levels at 1b NMJs. A–F, Representative BRP immunostaining from m6 (A, B), m12 (C, D), and m4 (E, F) in control (A8>GFP) and 1s-ablated (A8>GFP,hid,rpr) animals labeled with GFP (green), BRP (red), and HRP (blue). A–F, 2.5× zoomed 1b boutons corresponding to dashed regions in A–F showing BRP staining. G, Quantification of normalized total BRP intensity of 1b NMJs on m6 (t(28) = 0.1199, p = 0.9054, unpaired t test), m12 (t(28) = 1.627, p = 0.1148, unpaired t test), and m4 (t(24) = 0.3189, p = 0.7525, unpaired t test). Images and graphs are color coded as indicated in the color key. H, Quantification of BRP/HRP sum intensity ratio (density) from m6 (t(24.31) = 4.705, p < 0.0001, unpaired t test with Welch's correction), m12 (t(28) = 2.736, p = 0.0107, unpaired t test), and m4 (t(24) = 2.847, p = 0.0089, unpaired t test). Error bars indicate ±SEM. *p < 0.05, **p < 0.01, ****p < 0.0001, ns - not significant. n values (NMJs/larva) are 16/8, 14/8, 14/8, 16/8, 13/7, and 13/7, respectively.
Figure 9.
Figure 9.
Quantification of GluRIIA levels at 1b NMJs. A–F, Representative GluRIIA immunostaining from m6 (A, B), m12 (C, D), and m4 (E, F) in control (A8>GFP) and 1s-ablated animals (A8>GFP,hid,rpr) labeled with GFP (green), GluRIIA (red), and DLG (blue). A–F, 2.5× zoomed 1b boutons corresponding to dashed regions in A–F showing GluRIIA staining. G, Quantification of normalized total GluRIIA intensity of m6 (t(18.38) = 3.812, p = 0.0012, unpaired t test with Welch's correction), m12 (t(28) = 1.337, p = 0.1921, unpaired t test), and m4 (t(26) = 2.049, p = 0.0507, unpaired t test). Images and graphs are color coded as indicated in the color key. H, Quantification of GluRIIA/DLG sum intensity ratio (density) of m6 (t(29) = 1.108, p = 0.2771, unpaired t test), m12 (t(28) = 0.8544, p = 0.4002, unpaired t test), and m4 (t(26) = 0.2679, p = 0.7909, unpaired t test). Error bars indicate ±SEM. **p < 0.01, ns - not significant. n values (NMJs/larva) are 16/8, 15/8, 14/7, 16/8, 15/8, and 13/7, respectively.
Figure 10.
Figure 10.
Loss of 1s evoked neurotransmission contributes to 1b synaptic plasticity. A, B, Representative m4 NMJs labeled with GFP (green), DLG (magenta), and HRP (blue) in control (A; A8>GFP: dark green) and 1s-silenced (B; A8>GFP,TNT: light green) animals. C, Quantification of 1b boutons on m4 in control and 1s-silenced animals (t(29) = 4.099, p = 0.0003, unpaired t test). Images, representative traces, and graphs are color coded as indicated in the color key. D, Quantification of satellite boutons from m4 in control and 1s-silenced animals (t(18.90) = 2.161, p = 0.0437, unpaired t test with Welch's correction). E, Representative mEPSP and EPSP recordings in control and 1s-silenced animals. F, Quantification of mEPSP frequencies from m4 in control and 1s-silenced animals (t(16) = 2.515, p = 0.0230, unpaired t test). G, Quantification of EPSP amplitudes in control and 1s-silenced animals (t(11.01) = 3.529, p = 0.0047, unpaired t test with Welch's correction). H, Normalized EPSP from m4 in control and 1s-silenced animals (t(20.75) = 3.736, p = 0.0012, unpaired t test with Welch's correction). Normalized EPSP of 1s-silenced animals is compared with the EPSP ratio of 1b/1b + 1s calculated from m4 in Figure 1I, indicated by gray dashed line. I, Normalized QC from m4 in control and 1s-silenced animals (t(23) = 3.159, p = 0.0044, unpaired t test). QC from 1s-silenced m4 was estimated using corrected EPSP and estimated 1b-derived mEPSP amplitude. Normalized QC was compared with 1b baseline QC (see Materials and Methods). Error bars indicate ±SEM. *p < 0.05, **p < 0.01, ***p < 0.001. n values (NMJs/larva) are 14/10, 17/9 for C and D, and 9/7, 9/6 for EI.
Figure 11.
Figure 11.
Robust 1b MN synaptic plasticity requires initial 1s innervation. A, B, Representative m4 NMJs labeled with DLG (green) and HRP (magenta) in control (A8>GFP: dark green; A) and mutant (DIP-αnull, A8>GFP: light green; B) animals. C, Quantification of 1s innervation frequency in control and mutant first instar larvae. No m4-1s NMJs observed in mutants. D, Quantification of 1b boutons from m4 in control and mutant animals (t(27) = 1.552, p = 0.1323, unpaired t test). Images, representative traces, and graphs are color coded as indicated in the color key. E, Quantification of satellite boutons from m4 in control and mutant animals (t(27) = 0.1563, p = 0.8770, unpaired t test). F, Representative mEPSP and EPSP recordings from control and mutant animals. G, Quantification of mEPSP frequencies from m4 in control and mutant animals (t(27) = 2.824, p = 0.0088, unpaired t test). H, Quantification of EPSP amplitudes in control and mutant animals (t(27) = 7.505, p < 0.0001, unpaired t test). I, Normalized EPSPs from m4 in control and mutant animals (t(29) = 2.215, p = 0.0348, unpaired t test). Normalized mutant EPSP is compared with the EPSP ratio of 1b/1b + 1s calculated from m4 in Figure 1I, indicated by gray dashed line. Note that m4-1b-derived EPSP increases 23% in DIP-α mutants but increases 45% in A8>GFP,hid,rpr (Fig. 6I). J, Normalized QC from m4 in control and mutant animals (t(20.14) = 0.086, p = 0.9326, unpaired t test with Welch's correction). Normalized QC was compared with 1b baseline QC (see Materials and Methods). Error bars indicate ±SEM. *p < 0.05, **p < 0.01, ****p < 0.0001, ns - not significant. n values (NMJs/larva) are 46/8 and 20/4 for B and C; 13/8 and 16/8 for D and E; and 13/10 and 16/10 for FJ.
Figure 12.
Figure 12.
m4s that naturally lack 1s innervation do not show 1b plasticity. A, Quantification of 1b boutons from m4 with and without 1s innervation (t(44) = 1.885, p = 0.0661, unpaired t test). B, Quantification of satellite boutons from m4 with and without 1s innervation (t(44) = 0.3895, p = 0.6988, unpaired t test). C, Quantification of mEPSP frequencies from m4 with and without 1s innervation (t(18) = 2.414, p = 0.0267, unpaired t test). D, Quantification of EPSP amplitudes from m4 with and without 1s innervation (t(18) = 4.576, p = 0.0002, unpaired t test). E, Normalized EPSPs from m4 without 1s innervation are compared with the EPSP ratio of 1b/1b + 1s calculated from m4 in Figure 1I, indicated by the gray dashed line (t(24) = 1.263, p = 0.2186, unpaired t test). F, Normalized QC from m4 without 1s innervation is compared with the 1b baseline QC (see Materials and Methods; t(24) = 0.1449, p = 0.8860, unpaired t test). Error bars indicate ±SEM. *p < 0.05, ***p < 0.001, ns - not significant. n values (NMJs/larva) are 23/17 and 23/17 for A and B, and 10/7 and 10/9 for CF.

References

    1. Akbergenova Y, Cunningham KL, Zhang YV, Weiss S, Littleton JT (2018) Characterization of developmental and molecular factors underlying release heterogeneity at Drosophila synapses. eLife 7:e38268. - PMC - PubMed
    1. Andreae LC, Burrone J (2015) Spontaneous neurotransmitter release shapes dendritic arbors via long-range activation of NMDA receptors. Cell Rep 10:873–882. 10.1016/j.celrep.2015.01.032 - DOI - PMC - PubMed
    1. Andreae LC, Burrone J (2018) The role of spontaneous neurotransmission in synapse and circuit development. J Neurosci Res 96:354–359. 10.1002/jnr.24154 - DOI - PMC - PubMed
    1. Aponte-Santiago NA, Ormerod KG, Akbergenova Y, Littleton JT (2020) Synaptic plasticity induced by differential manipulation of tonic and phasic motoneurons in Drosophila. J Neurosci 40:6270–6288. 10.1523/JNEUROSCI.0925-20.2020 - DOI - PMC - PubMed
    1. Ashley J, Sorrentino V, Lobb-Rabe M, Nagarkar-Jaiswal S, Tan L, Xu S, Xiao Q, Zinn K, Carrillo RA (2019) Transsynaptic interactions between IgSF proteins DIP-α and Dpr10 are required for motor neuron targeting specificity. Elife 8:e42690 10.7554/eLife.42690 - DOI - PMC - PubMed

Publication types

MeSH terms

Substances

LinkOut - more resources