. 2021 Jan 5;12(1):124.
doi: 10.1038/s41467-020-20430-7.

Benchmarking joint multi-omics dimensionality reduction approaches for the study of cancer

Affiliations

Benchmarking joint multi-omics dimensionality reduction approaches for the study of cancer

Laura Cantini et al. Nat Commun. .

Abstract

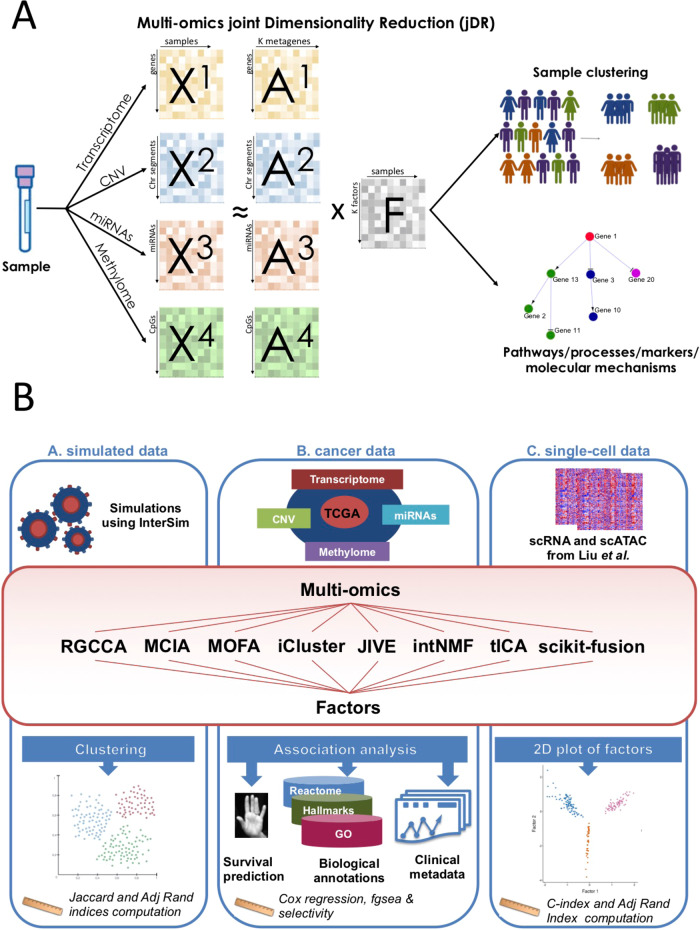
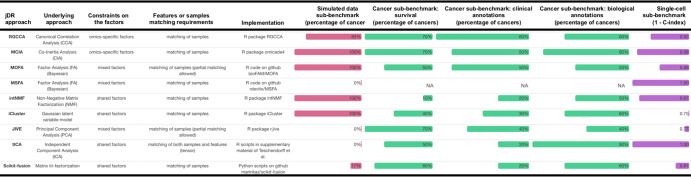
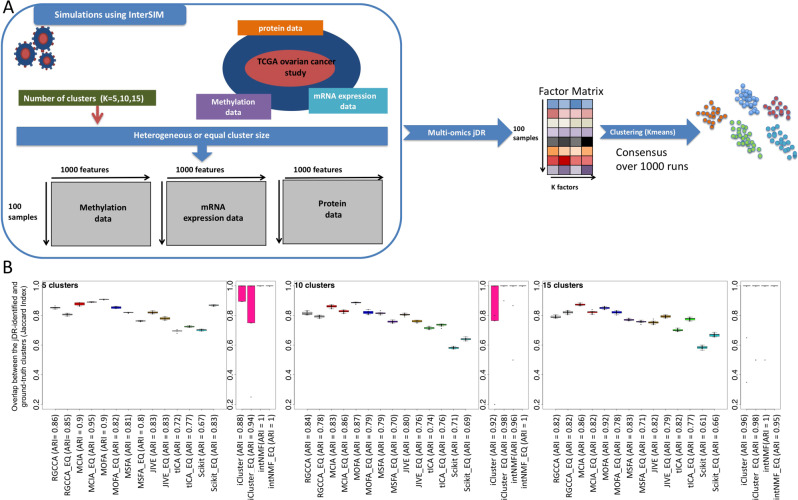
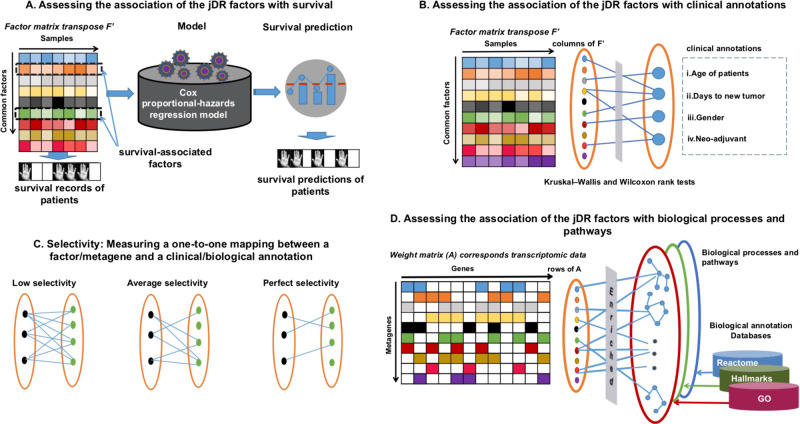
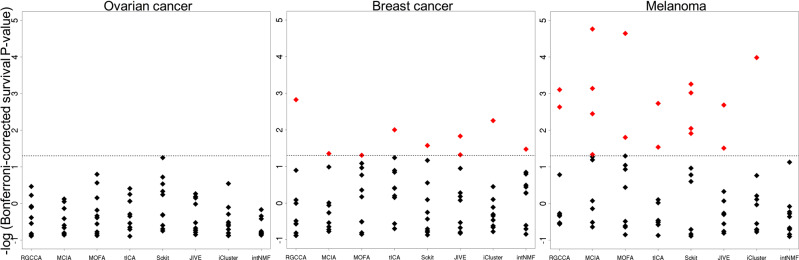
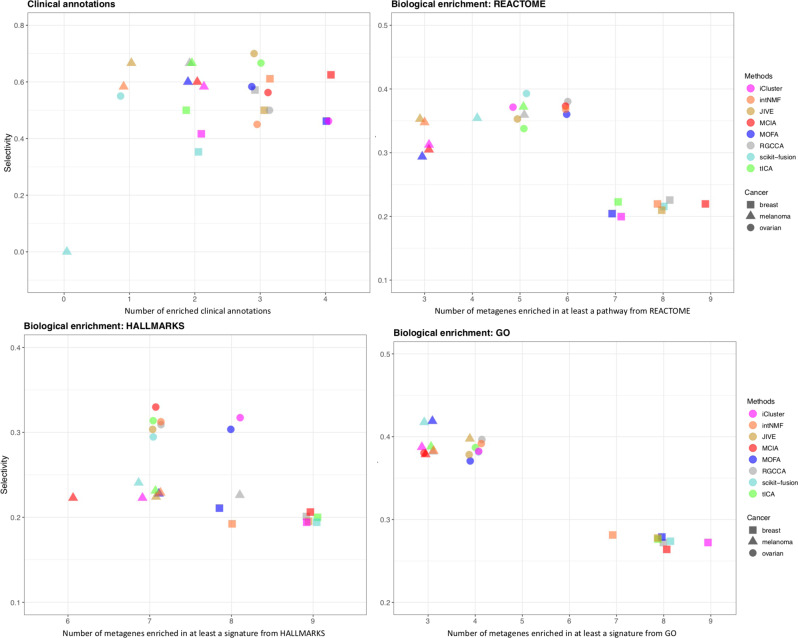
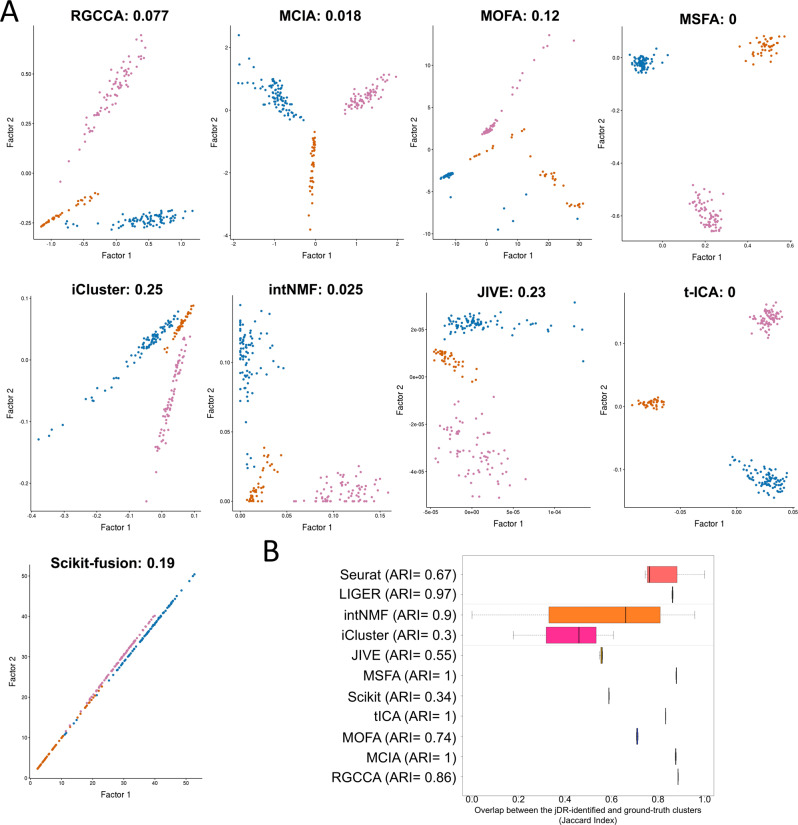
High-dimensional multi-omics data are now standard in biology. They can greatly enhance our understanding of biological systems when effectively integrated. To achieve proper integration, joint Dimensionality Reduction (jDR) methods are among the most efficient approaches. However, several jDR methods are available, urging the need for a comprehensive benchmark with practical guidelines. We perform a systematic evaluation of nine representative jDR methods using three complementary benchmarks. First, we evaluate their performances in retrieving ground-truth sample clustering from simulated multi-omics datasets. Second, we use TCGA cancer data to assess their strengths in predicting survival, clinical annotations and known pathways/biological processes. Finally, we assess their classification of multi-omics single-cell data. From these in-depth comparisons, we observe that intNMF performs best in clustering, while MCIA offers an effective behavior across many contexts. The code developed for this benchmark study is implemented in a Jupyter notebook-multi-omics mix (momix)-to foster reproducibility, and support users and future developers.


Conflict of interest statement

The authors declare no competing interests.

Figures

Fig. 1
Fig. 1. Joint Dimensionality Reduction methods and benchmark workflow overview.
a Multiomics are profiled from the same sample. Each omics corresponds to a different matrix Xi. jDR methods factorize the matrices Xi into the product of a factor matrix F and weight matrices Ai. These matrices can then be used to cluster samples and identify molecular processes. b Workflow of our benchmark, subdivided in three subparts: First, we simulated multiomics datasets and evaluated the performance of the nine jDR approaches in retrieving ground-truth sample clustering. Second, we used TCGA multiomics cancer data to assess the strengths of jDR methods in predicting survival, clinical annotations, and known pathways/biological processes. Finally, we evaluated the performances of the methods in classifying multiomics single-cell data from cancer cell lines.
Fig. 2
Fig. 2. Dimensionality reduction approaches benchmarked in this study.
The list of the jDR methods benchmarked in this study is reported together with their underlying approach, constraints on the factors, features or samples matching requirements, implementation and a summary of the benchmarking performances. The benchmarking performances are organized as follows: simulated data, cancer survival, cancer clinical annotations, biological annotations, and single cell.
Fig. 3
Fig. 3. jDR clustering of simulated multiomics datasets.
a Workflow of the simulation sub-benchmark from the data generation with interSIM, to the jDR output and its clustering based on k-means. b Boxplots of the Jaccard Index computed between the clusters identified by the different jDR methods and the ground-truth clusters imposed on the simulated data (for 5, 10, and 15 imposed clusters). For each method (e.g., RGCCA), performances on heterogeneous and equally sized clusters are reported (denoted as RGCCA and RGCCA_EQ, respectively). The corresponding Adjusted Rand Index (ARI) values are further reported near to the name of the jDR methods along the x-axis. The number of samples here considered is 100 and the results are obtained over 1000 independent runs of k-means clustering. Data are presented as mean values ± sd, whiskers denote max, and min values.
Fig. 4
Fig. 4. graphic summary of the cancer sub-benchmark.
a Testing the association of jDR factors with survival; b Testing the association of jDR factors with clinical annotations; c Graphical explanation of the selectivity score: measuring the one-to-one mapping between factors and clinical/biological annotations; d Testing association of jDR factors with biological processes and pathways.
Fig. 5
Fig. 5. Identification of factors predictive of survival in ovarian, breast, and melanoma cancer samples by the jDR methods.
For each method the Bonferroni-corrected p-values associating each of the 10 factors to survival (Cox regression-based survival analysis) are reported. The dot lines correspond to a corrected p-value threshold of 0.05. The results corresponding to the other seven cancer types are presented in Supplementary Fig. 1A.
Fig. 6
Fig. 6. Identification of factors associated with clinical annotations, and metagenes associated with biological annotations in ovarian, breast, and melanoma samples, by the jDR methods.
For clinical annotations, the plot represents, for each method, the number of clinical annotations enriched in at least one factor together with the selectivity of the associations between the factors and the clinical annotations (Method). For the three annotation sources (MsigDB Hallmarks, REACTOME and Gene Ontology), the number of metagenes identified by the different jDR methods enriched in at least a biological annotation are plotted against the selectivity of the associations between the metagene and the annotation. See Supplementary Fig. 3 for the results corresponding to the other seven cancer types.
Fig. 7
Fig. 7. jDR clustering of single-cell multiomics according to the cancer cell line of origin.
a Scatterplots of factor 1 and 2 (i.e., the first two columns of the factor matrix) are reported for each jDR method. The colors denote the cancer cell line of origin: pink for K562, orange for Hela and blue for HCT. The C-index (in the range [0–1]) reports the quality of the obtained clusters (0 being the best). b Boxplots of the Jaccard Index corresponding to the application of jDR plus LIGER and Seurat for single-cell multiomics clustering. The corresponding Adjusted Rand Index (ARI) values are further reported near to the name of the jDR methods along the x-axis. The number of cells here considered is 206 and the results are obtained over 1000 independent runs of k-means clustering. Data are presented as mean values ± sd, whiskers denote max, and min values.

References

    1. Cancer Genome Atlas Research Network et al. The Cancer Genome Atlas Pan-Cancer analysis project. Nat. Genet. 2013;45:1113–1120. doi: 10.1038/ng.2764. - DOI - PMC - PubMed
    1. Stuart T, Satija R. Integrative single-cell analysis. Nat. Rev. Genet. 2019;20:257–272. doi: 10.1038/s41576-019-0093-7. - DOI - PubMed
    1. Gligorijević, V. & Pržulj, N. Methods for biological data integration: perspectives and challenges. J. R. Soc. Interface12, 20150571 (2015). - PMC - PubMed
    1. Kristensen VN, et al. Principles and methods of integrative genomic analyses in cancer. Nat. Rev. Cancer. 2014;14:299–313. doi: 10.1038/nrc3721. - DOI - PubMed
    1. Bersanelli M, et al. Methods for the integration of multi-omics data: mathematical aspects. BMC Bioinform. 2016;17:S15. doi: 10.1186/s12859-015-0857-9. - DOI - PMC - PubMed

Publication types

Substances