. 2021 Jan 1;12(3):652-681.
doi: 10.7150/jca.41160. eCollection 2021.

A Double-Edged Sword: The Anti-Cancer Effects of Emodin by Inhibiting the Redox-Protective Protein MTH1 and Augmenting ROS in NSCLC

Affiliations

A Double-Edged Sword: The Anti-Cancer Effects of Emodin by Inhibiting the Redox-Protective Protein MTH1 and Augmenting ROS in NSCLC

Divya Wahi et al. J Cancer. .

Abstract

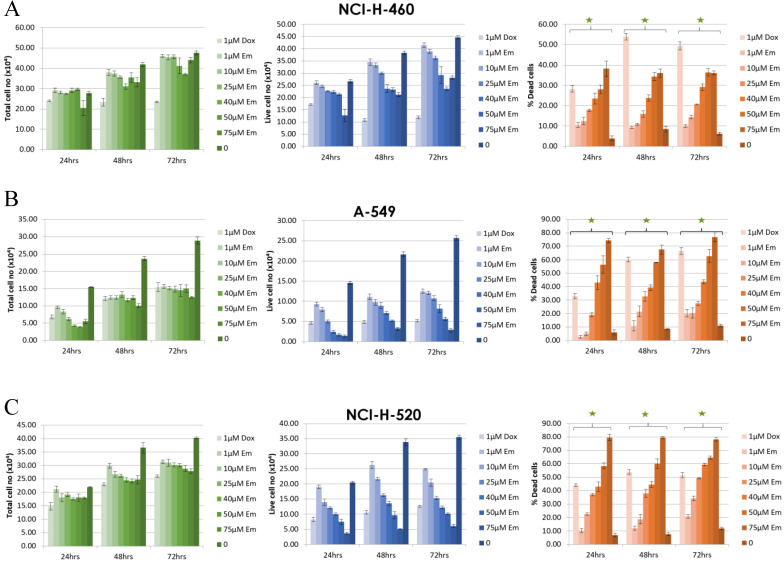
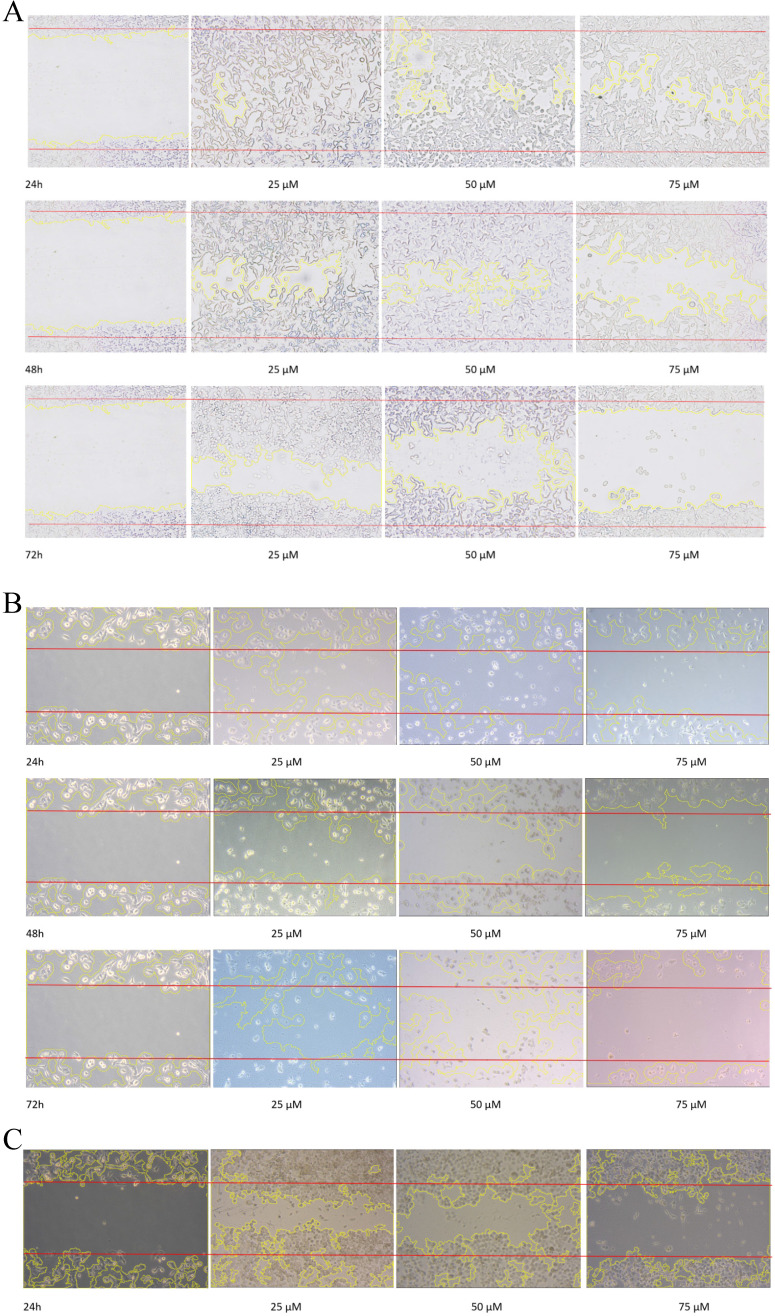
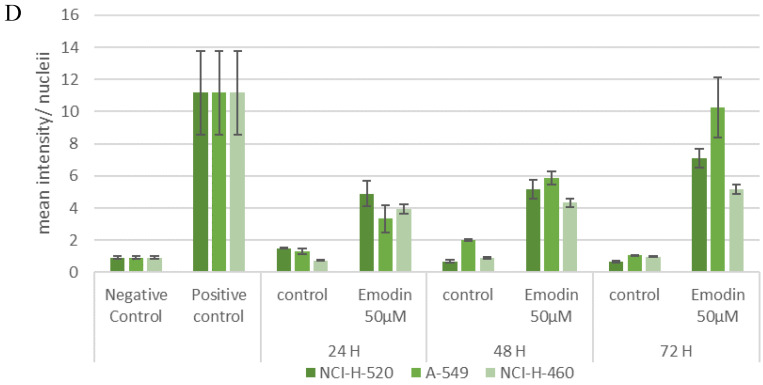
Background: Reactive oxygen species (ROS), playing a two-fold role in tumorigenesis, are responsible for tumor formation and progression through the induction of genome instability and pro-oncogenic signaling. The same ROS is toxic to cancer cells at higher levels, oxidizing free nucleotide precursors (dNTPs) as well as damaging DNA leading to cell senescence. Research has highlighted the tumor cell-specific expression of a redox-protective phosphatase, MutT homolog 1 (MTH1), that performs the enzymatic conversion of oxidized nucleotides (like 8-oxo-dGTP) to their corresponding monophosphates, up-regulated in numerous cancers, circumventing their misincorporation into the genomic DNA and preventing damage and cell death. Methods: To identify novel natural small molecular inhibitors of MTH1 to be used as cancer therapeutic agents, molecular screening for MTH1 active site binders was performed from natural small molecular libraries. Emodin was identified as a lead compound for MTH1 active site functional inhibition and its action on MTH1 inhibition was validated on non-small cell lung cancer cellular models (NSCLC). Results: Our study provides strong evidence that emodin mediated MTH1 inhibition impaired NSCLC cell growth, inducing senescence. Emodin treatment enhanced the cellular ROS burdens, on one hand, damaged dNTP pools and inhibited MTH1 function on the other. Our work on emodin indicates that ROS is the key driver of cancer cell-specific increased DNA damage and apoptosis upon MTH1 inhibition. Consequently, we observed a time-dependent increase in NSCL cancer cell susceptibility to oxidative stress with emodin treatment. Conclusions: Based on our data, the anti-cancer effects of emodin as an MTH1 inhibitor have clinical potential as a single agent capable of functioning as a ROS inducer and simultaneous blocker of dNTP pool sanitation in the treatment of NSCL cancers. Collectively, our results have identified for the first time that the potential molecular mechanism of emodin function, increasing DNA damage and apoptosis in cancer cells, is via MTH1 inhibition.

Keywords: Emodin; MTH-1; NCSLC; NUDT-1; ROS; lung cancer; oxidative DNA damage.


Conflict of interest statement

Competing Interests: The authors have declared that no competing interest exists.

Figures

Figure 1
Figure 1
A. Stereo view of the MTH1 binding site is shown. The protein portions building up the binding site are coloured as pink mesh and emodin as ligand (Green) is embedded deep in the active site of MTH1. B. Molecular interactions between MTH1 protein and emodin, showing the hydrophobic interactions (in red) and hydrogen bonds (in green). The diagram is illustrated using LIGPLOT software.
Figure 2
Figure 2
Emodin-MTH1 complex - Graphical representation of A. The RMSD analysis of the 50 ns trajectory to examine the detailed dynamics of all binding atoms. B. The RMSF analysis. C. The radius of gyration (Rg) analysis. D. The SASA analysis. E. The H-bond lengths of the simulated complex.
Figure 3
Figure 3
Measurement of cell proliferation by Trypan Blue assay. A, B and C are graphical representation of the Total, Live and Percent Dead cells caused by increasing emodin treatment (0, 1, 10, 25, 40, 50 and 75 µM) at 24, 48 and 72 h, as measured by phase-contrast for NCI-H-460 (Large cell carcinoma), A-549 (adenocarcinoma) and NCI-H-520 (squamous cell carcinoma) cell lines respectively. Data shown as mean ± S.E.M. of three independent experiments and * indicate P values < 0.05.
Figure 4
Figure 4
Measurement of cell proliferation by MTT assay. A, B and C are graphical representation of percent inhibition caused by increasing emodin treatment (0, 10, 25, 50, 75, 100, 150 and 200 µM) at 24, 48 and 72 h, for NCI-H-520 (squamous cell carcinoma), NCI-H-460 (Large cell carcinoma) and A-549 (adenocarcinoma) cell lines respectively as measured by MTT colorimetric assay, absorbance taken at 595nm. IC50 values are calculated from sigmoidal fitting of growth curves. Data shown as mean ± S.E.M. of three independent experiments.
Figure 5
Figure 5
Cell cycle analysis. A, B and C are the graphical representation of the number of cells in G1, S and G2/M phases of NSCLC cells with emodin treatment (0, 25, 50 and 75 µM) at 24, 48 and 72 h, as measured by BD FACS Aria Flow Cytometer for NCI-H-520 (squamous cell carcinoma), A-549 (adenocarcinoma) and NCI-H-460 (Large cell carcinoma) cell lines respectively. D. Flow cytometric plots of NCI-H-520 cells with emodin treatment (0, 25, 50 and 75 µM) at 24, 48 and 72 h. Western Blot Analysis of Cell Cycle proteins. E. Protein level expression profile of CDK-4, Cyclin B1, CDK-2 and Cyclin D1 respectively. F (a-d). The graphical representation of the protein levels quantified by Image-J software. The data are representative of three independent experiments carried out under the same conditions.
Figure 5
Figure 5
Cell cycle analysis. A, B and C are the graphical representation of the number of cells in G1, S and G2/M phases of NSCLC cells with emodin treatment (0, 25, 50 and 75 µM) at 24, 48 and 72 h, as measured by BD FACS Aria Flow Cytometer for NCI-H-520 (squamous cell carcinoma), A-549 (adenocarcinoma) and NCI-H-460 (Large cell carcinoma) cell lines respectively. D. Flow cytometric plots of NCI-H-520 cells with emodin treatment (0, 25, 50 and 75 µM) at 24, 48 and 72 h. Western Blot Analysis of Cell Cycle proteins. E. Protein level expression profile of CDK-4, Cyclin B1, CDK-2 and Cyclin D1 respectively. F (a-d). The graphical representation of the protein levels quantified by Image-J software. The data are representative of three independent experiments carried out under the same conditions.
Figure 6
Figure 6
Measurement of Apoptosis by Annexin V-PI assay. A, B and C are Representative plots obtained from flow cytometry for NCI-H-460 (Large cell carcinoma), A-549 (adenocarcinoma) and NCI-H-520 (squamous cell carcinoma) cells under increasing emodin treatment (0, 25, 50 and 75 µM) at 24, 48 and 72 h respectively. The lower left quadrant indicates the viable cells. The lower right quadrant represents the annexin V positive/propidium iodide (PI) negative staining indicating early apoptotic cells. The upper right quadrant represents high annexin V and PI staining both, indicating late apoptosis and the upper left quadrant represents low annexin V and high PI staining indicating necrosis. D, E and F are the graphical representation of percent inhibition for NCI-H-520 (squamous cell carcinoma), A-549 (adenocarcinoma) and NCI-H-460 (Large cell carcinoma) cells respectively. G and H. Protein level expression profiles of Survivin, Bax, Bcl-2 and PARP and Caspase-3 cleavage respectively. I: The graphical representation of the protein levels quantified by Image-J software. Data shown as mean ± S.E.M. of three independent experiments.
Figure 6
Figure 6
Measurement of Apoptosis by Annexin V-PI assay. A, B and C are Representative plots obtained from flow cytometry for NCI-H-460 (Large cell carcinoma), A-549 (adenocarcinoma) and NCI-H-520 (squamous cell carcinoma) cells under increasing emodin treatment (0, 25, 50 and 75 µM) at 24, 48 and 72 h respectively. The lower left quadrant indicates the viable cells. The lower right quadrant represents the annexin V positive/propidium iodide (PI) negative staining indicating early apoptotic cells. The upper right quadrant represents high annexin V and PI staining both, indicating late apoptosis and the upper left quadrant represents low annexin V and high PI staining indicating necrosis. D, E and F are the graphical representation of percent inhibition for NCI-H-520 (squamous cell carcinoma), A-549 (adenocarcinoma) and NCI-H-460 (Large cell carcinoma) cells respectively. G and H. Protein level expression profiles of Survivin, Bax, Bcl-2 and PARP and Caspase-3 cleavage respectively. I: The graphical representation of the protein levels quantified by Image-J software. Data shown as mean ± S.E.M. of three independent experiments.
Figure 7
Figure 7
Wound scratch assay. A, B and C are photographical representation of the visual wound healing under increasing emodin treatment (0, 25, 50 and 75 µM) at 24, 48 and 72 h, as measured by phase-contrast for NCI-H-520 (squamous cell carcinoma), A-549 (adenocarcinoma) and NCI-H-460 (Large cell carcinoma) cell lines respectively. D, E and F are the graphical representation of scratch areas for A, B and C respectively. G. Protein level expression profiles of Vimentin and Integrin β1 respectively. H. The graphical representation of the protein levels quantified by Image-J software. Data shown as mean ± S.E.M. of three independent experiments.
Figure 7
Figure 7
Wound scratch assay. A, B and C are photographical representation of the visual wound healing under increasing emodin treatment (0, 25, 50 and 75 µM) at 24, 48 and 72 h, as measured by phase-contrast for NCI-H-520 (squamous cell carcinoma), A-549 (adenocarcinoma) and NCI-H-460 (Large cell carcinoma) cell lines respectively. D, E and F are the graphical representation of scratch areas for A, B and C respectively. G. Protein level expression profiles of Vimentin and Integrin β1 respectively. H. The graphical representation of the protein levels quantified by Image-J software. Data shown as mean ± S.E.M. of three independent experiments.
Figure 8
Figure 8
A. Confocal microscopic images of NCI-H-520 cell line stained with CellROX™ Deep Red, showing increasing red fluorescence (increasing ROS). B. Confocal microscopic images of NCI-H-520 cell line stained with CellROX™ Green, showing increasing green fluorescence (increasing ROS). C and D. Graphical representation of the mean fluorescent intensity/ nuclei indicating an increase in the fluorescence signal of ROS in cells with increasing emodin treatment for 24 h, as observed under the confocal microscope for A and B respectively.
Figure 9
Figure 9
Mitochondrial membrane potential analysis by JC-1 staining. A. Confocal microscopy images of NCI-H-520 (squamous cell carcinoma) cells with emodin treatment (0, 10, 25, 50 and 75 µM) and CCCP (positive control) at 24h, stained with JC-1 dye. B. graphical representation of the fluorescent intensities depicted as the ratio of monomer:aggregates from the Confocal microscopy images of NCI-H-520 (squamous cell carcinoma) cells represented in A. C, D and E shows the graphical representation plots of fluorescent intensities (ratio of monomer:aggregates) obtained from fluorimetry for NCI-H-520 (squamous cell carcinoma), A-549 (adenocarcinoma) and NCI-H-460 (large cell carcinoma) cells under increasing emodin treatment (0, 10, 25, 50, 75, 100, 150 and 200 µM) at 24, 48 and 72 h respectively. The data shown as mean ± S.E.M. of three independent experiments carried out under the same conditions.
Figure 10
Figure 10
Mitochondrial membrane potential analysis by DIOC6 staining. A. Confocal microscopy images of NCI-H-520 (squamous cell carcinoma) cells with emodin treatment (0, 10, 25, 50 and 75 µM) and CCCP (positive control) at 24h, stained with DIOC6 dye. B. Graphical representation of the fluorescent intensities of the Confocal microscopic images of NCI-H-520 (squamous cell carcinoma) cells represented in A. C, D and E shows the graphical representation plots of fluorescent intensities obtained from fluorimetry for NCI-H-520 (squamous cell carcinoma), A-549 (adenocarcinoma) and NCI-H-460 (Large cell carcinoma) cells under increasing emodin treatment (0, 10, 25, 50, 75, 100, 150 and 200 µM) at 24, 48 and 72 h respectively. The data shown as mean ± S.E.M. of three independent experiments carried out under the same conditions.
Figure 11
Figure 11
Analysis of DNA fragmentation induced by emodin treatment. A, B and C are photographical representation of the visual ladder like DNA bands formed under increasing emodin treatment (0, 25, 50 and 75 µM) at 24, 48 and 72 h, as assessed by 1% agarose gel electrophoresis and ethidium bromide staining for NCI-H-520, A-549 and NCI-H-460 cell lines respectively. L: Ladder, C: Control, 25: 25 µM emodin, 50: 50 µM emodin, 75: 75 µM emodin. The data are representative of three independent experiments carried out under the same conditions.
Figure 12
Figure 12
Analysis of Comet Assay. A, B and C are photographical representation of the visual comet like DNA from cells formed under increasing emodin treatment (0, 25, 50 and 75 µM) at 24, 48 and 72 h (at 10X and 60X), as assessed by single cell gel electrophoresis and ethidium bromide staining, observed under confocal microscope for NCI-H-520 (squamous cell carcinoma). D, E and F are graphical representations of the comet tail moments of NCI-H-460 (Large cell carcinoma), A-549 (adenocarcinoma) and NCI-H-520 (squamous cell carcinoma) cell lines respectively. Data shown as mean ± S.E.M. of three independent experiments and * indicate P values < 0.05.
Figure 12
Figure 12
Analysis of Comet Assay. A, B and C are photographical representation of the visual comet like DNA from cells formed under increasing emodin treatment (0, 25, 50 and 75 µM) at 24, 48 and 72 h (at 10X and 60X), as assessed by single cell gel electrophoresis and ethidium bromide staining, observed under confocal microscope for NCI-H-520 (squamous cell carcinoma). D, E and F are graphical representations of the comet tail moments of NCI-H-460 (Large cell carcinoma), A-549 (adenocarcinoma) and NCI-H-520 (squamous cell carcinoma) cell lines respectively. Data shown as mean ± S.E.M. of three independent experiments and * indicate P values < 0.05.
Figure 13
Figure 13
Analysis of TUNEL Assay. A, B and C are the Confocal microscopy images of NCI-H-520 (squamous cell carcinoma), A-549 (adenocarcinoma) and NCI-H-460 (Large cell carcinoma) cells under emodin treatment (50 µM) at 24, 48 and 72 h along with vehicle controls respectively stained with the TUNEL assay protocol. Increasing Green fluorescence indicates increasing DNA Damage. D. graphical representation plot of fluorescent intensities obtained from confocal microscopy images for A-C. The data shown as mean ± S.E.M. of three independent experiments carried out under the same conditions.
Figure 13
Figure 13
Analysis of TUNEL Assay. A, B and C are the Confocal microscopy images of NCI-H-520 (squamous cell carcinoma), A-549 (adenocarcinoma) and NCI-H-460 (Large cell carcinoma) cells under emodin treatment (50 µM) at 24, 48 and 72 h along with vehicle controls respectively stained with the TUNEL assay protocol. Increasing Green fluorescence indicates increasing DNA Damage. D. graphical representation plot of fluorescent intensities obtained from confocal microscopy images for A-C. The data shown as mean ± S.E.M. of three independent experiments carried out under the same conditions.
Figure 14
Figure 14
Analysis of DNA damage and repair activation. A, B and C are the Confocal microscopy images of NCI-H-520 (squamous cell carcinoma), A-549 (adenocarcinoma) and NCI-H-460 (Large cell carcinoma) cells under emodin treatment (50 µM) at 24 h along with vehicle controls respectively stained with ATM-p, DNA-PKCs and 53 BP-1 Primary antibodies subsequently stained with Alexa-488 labelled Secondary antibodies. Increasing Green fluorescence indicates increasing expression of the DNA Damage and repair induction specific proteins. D. Protein level expression profiles of ATM-p, DNA-PKCs and 53 BP-1 respectively. The data shown is representative of three independent experiments carried out under the same conditions.
Figure 15
Figure 15
A. Codon Plus protein expression study on SDS page gel where Lane 1: un-induced @37°C for 1 h, Lane 2: IPTG induced @37°C for 1 h, Lane 3: un-induced @37°C for 3 h, Lane 4: IPTG induced @37°C for 3 h, Lane 5: un-induced @18°C overnight and Lane 6: IPTG induced @18°C overnight. B. Codon Plus protein purification study on SDS page gel where Lane 1: Cell Pellet, Lane 2: Before Sonication, Lane 3: Total Cell Lysate, Lane 4: Lysate supernatant, Lane 5: Lysate Flow Through, Lane 6: 10 mM Imidazole Wash, Lane 7: 25 mM Imidazole Wash, Lane 8: 150 mM Imidazole Elution 1, Lane 9: 150 mM Imidazole Elution 2, Lane 10: 150 mM Imidazole Elution 3, Lane 11: 250 mM Imidazole Elution 1, Lane 12: 250 mM Imidazole Elution 2, Lane 13: 250 mM Imidazole Elution 3, Lane 14: 250 mM column wash. The data shown is representative of three independent experiments carried out under the same conditions.
Figure 16
Figure 16
Secondary structure analysis by circular dichroism. Spectra of the MTH1 protein is presented in molar ellipticity (deg.cm2.dmol-1). The spectrum was recorded at 25 °C in a 0.01 cm path cell length quartz cell using MTH1 protein at a concentration of 5 µM in a 10 mM Tris-HCl buffer (pH 7.4). Red: input structure; Green: predicted structure. An average of three consecutive spectral scans was used and corresponding blank buffer was subtracted.
Figure 17
Figure 17
Surface Plasmon Resonance sensorgram. A. SPR sensorgram showing surface competition assay of MTH1 protein (ligand) with emodin and (S)-crizotinib (analytes). As the concentration of the analyte molecule increased, the SPR response increased. B. plot of the mean Kd values of MTH1 protein (ligand) with emodin and (S)-crizotinib (analytes). An average of three Kd values was taken for plotting the mean.
Figure 18
Figure 18
Quantification of 8-hydroxy-2'-deoxyguanosine (nM)/ DNA (µM/ml). A-549 (adenocarcinoma), NCI-H-460 (Large cell carcinoma) and NCI-H-520 (squamous cell carcinoma) cells under emodin treatment (25, 50 µM) at 24, 48 and 72 h along with vehicle controls respectively as quantified using 8-OH-dG ELISA protocol.

Similar articles

Cited by

References

    1. WHO. Cancer. 2018.
    1. Coleman JF. Robbins and Cotran's Pathologic Basis of Disease, 8th Edition. The American Journal of Surgical Pathology. 2010;34:132.
    1. Siegel RL, Miller KD, Jemal A. Cancer statistics, 2015. CA: a cancer journal for clinicians. 2015;65:5–29. - PubMed
    1. Ziech D, Franco R, Pappa A, Panayiotidis MI. Reactive oxygen species (ROS)-induced genetic and epigenetic alterations in human carcinogenesis. Mutation research. 2011;711:167–73. - PubMed
    1. Ilonen IK, Räsänen JV, Sihvo EI, Knuuttila A, Salmenkivi KM, Ahotupa MO. et al. Oxidative stress in non-small cell lung cancer: Role of nicotinamide adenine dinucleotide phosphate oxidase and glutathione. Acta Oncologica. 2009;48:1054–61. - PubMed

LinkOut - more resources