Case Reports
. 2021 Feb;8(2):332-347.
doi: 10.1002/acn3.51270. Epub 2021 Jan 6.

Initial findings in traumatic peripheral nerve injury and repair with diffusion tensor imaging

Affiliations
Case Reports

Initial findings in traumatic peripheral nerve injury and repair with diffusion tensor imaging

Michael D Pridmore et al. Ann Clin Transl Neurol. 2021 Feb.

Abstract

Objective: Management of peripheral nerve injuries requires physicians to rely on qualitative measures from patient history, electromyography, and physical exam. Determining a successful nerve repair can take months to years for proximal injuries, and the resulting delays in clinical decision-making can lead to a negative impact on patient outcomes. Early identification of a failed nerve repair could prevent permanent muscle atrophy and loss of function. This study aims to test the feasibility of performing diffusion tensor imaging (DTI) to evaluate injury and recovery following repair of wrist trauma. We hypothesize that DTI provides a noninvasive and reliable assessment of regeneration, which may improve clinical decision-making and alter the clinical course of surgical interventions.

Methods: Clinical and MRI measurements from subjects with traumatic peripheral nerve injury, carpal tunnel syndrome, and healthy control subjects were compared to evaluate the relationship between DTI metrics and injury severity.

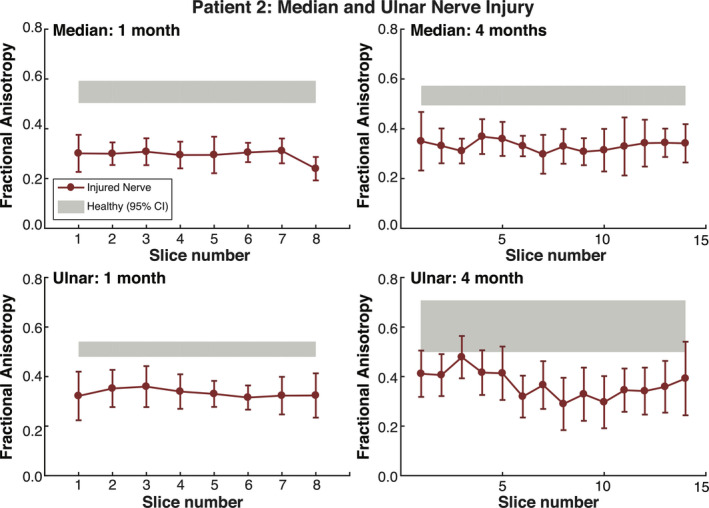
Results: Fractional anisotropy from DTI was sensitive to differences between damaged and healthy nerves, damaged and compressed nerves, and injured and healthy contralateral nerves. Longitudinal measurements in two injury subjects also related to clinical outcomes. Implications of other diffusion measures are also discussed.

Interpretation: DTI is a sensitive tool for wrist nerve injuries and can be utilized for monitoring nerve recovery. Across three subjects with nerve injuries, this study has shown how DTI can detect abnormalities between injured and healthy nerves, measure recovery, and determine if re-operation was successful. Additional comparisons to carpal tunnel syndrome and healthy nerves show that DTI is sensitive to the degree of impairment.


Conflict of interest statement

No authors in this manuscript have any conflict of interest to disclose.

Figures

Figure 1
Figure 1
Representative Images: Proton density‐weighted (PDW), fractional anisotropy (FA), mean diffusivity (MD), axial diffusivity (AD), and radial diffusivity (RD) maps show for traumatic peripheral nerve injury cohort (TPNI), carpal tunnel syndrome cohort (CTS), and control cohort. Green circles indicate the median nerve. Blue circles represent the ulnar nerve.
Figure 2
Figure 2
Group comparison of each DTI metric for the traumatic peripheral nerve injury (TPNI: red, n = 8), carpal tunnel syndrome (CTS: yellow, n = 18), and control cohorts (green, n = 8) across all subjects and timepoints. The black central mark represents the median, the edges of the box are the 25th and 75th percentile, and the whiskers show the interquartile range beyond these edges. This includes all longitudinal data for 3 TPNI and 8 CTS subjects.
Figure 3
Figure 3
Results of all TPNI subjects (n = 3) and timepoints comparing injured nerve data to the contralateral healthy nerve data for all DTI metrics acquired: FA (top‐left), MD (top‐right), AD (bottom‐left), and RD (bottom‐right). Circles represent the first timepoint, squares represent the second timepoint (TPNI 2 & 3), and diamond represents the third timepoint (TPNI 3). Red lines represent TPNI 1, green lines represent TPNI 2 (dark/light = median/ulnar), and blue represents TPNI 3. P‐values of Wilcoxon Signed‐Rank test are shown above each boxplot.
Figure 4
Figure 4
Proton density‐weighted (PDW) and fractional anisotropy (FA) maps for injured and healthy nerves in TPNI 3. Green circles indicate the median nerve. Blue circles represent the ulnar nerve. Worth nothing are the differences in intensity between the injured ulnar nerve and healthy ulnar nerve.
Figure 5
Figure 5
Results for TPNI 1: Fractional anisotropy plotted by slice. Red errorbars reflect individual data points of the injured ulnar nerve, with bars showing slice‐wise standard deviations. Gray errorbars reflect analogous information in contralateral healthy ulnar nerve, with the shaded gray area representing the 95% confidence interval (CI) for averaged healthy ulnar nerve across all slices.
Figure 6
Figure 6
Fibertracking results of TPNI 1 with a right arm median nerve injury. A proximal slice is shown at the bottom of the image with ascending fiber tracking of the injured ulnar nerve (left) and healthy median nerve (right). The white arrow indicates the area of injury. The nerve is color‐coded for fractional anisotropy (FA).
Figure 7
Figure 7
Results for TPNI 2: FA plotted by slice. Red errorbars reflect individual data points of the injured nerves, with bars showing slice‐wise standard deviations. The gray shaded gray area represents the 95% confidence interval (CI) for averaged healthy nerve data in the contralateral arm. The top charts show measures for median nerve across two timepoints. Likewise, the bottom charts show measures for the ulnar nerve across the same timepoints. The ulnar nerve was only partially transected and showed superior recovery, whereas the median nerve was fully transected and showed less recovery by the second timepoint.
Figure 8
Figure 8
Results for TPNI 3: Fractional Anisotropy plotted by slice. The red errorbars reflect individual data points of the injured ulnar nerve, with bars showing slice‐wise standard deviations. The gray shaded gray area represents the 95% confidence interval (CI) for averaged healthy ulnar nerve data in the contralateral arm. The top charts show measures across two timepoints, 3 and 6 months, whereas the bottom chart shows measures acquired at the third timepoint at 9 months postsurgery. At 6 months, FA decreased which mirrored clinical data showing failure. This led to re‐repair at 9 months and FA recovered.

References

    1. Campbell WW. Evaluation and management of peripheral nerve injury. Clin Neurophysiol 1978; 10.1016/j.clinph.2008.03.018. - DOI - PubMed
    1. Noble J, Munro CA, Prasad VSSV, Midha R. Analysis of upper and lower extremity peripheral nerve injuries in a population of patients with multiple injuries. J Trauma ‐ Inj Infect Crit Care 1998;45:116–122. - PubMed
    1. Chhabra A, Ahlawat S, Belzberg A, Andreseik G. Peripheral nerve injury grading simplified on MR neurography: As referenced to Seddon and Sunderland classifications. Indian J Radiol Imaging 2014;24:217. - PMC - PubMed
    1. Cross JD, Ficke JR, Hsu JR, et al. Battlefield orthopaedic injuries cause the majority of long‐term disabilities. J Am Acad Orthop Surg 2011;19:1–7. - PubMed
    1. Stansbury LG, Branstetter JG, Lalliss SJ. Amputation in military trauma surgery. J Trauma ‐ Inj Infect Crit Care 2007;63:940–944. - PubMed

Publication types

LinkOut - more resources