. 2021 Jan 6:10:e62209.
doi: 10.7554/eLife.62209.

The origins and consequences of UPF1 variants in pancreatic adenosquamous carcinoma

Affiliations

The origins and consequences of UPF1 variants in pancreatic adenosquamous carcinoma

Jacob T Polaski et al. Elife. .

Abstract

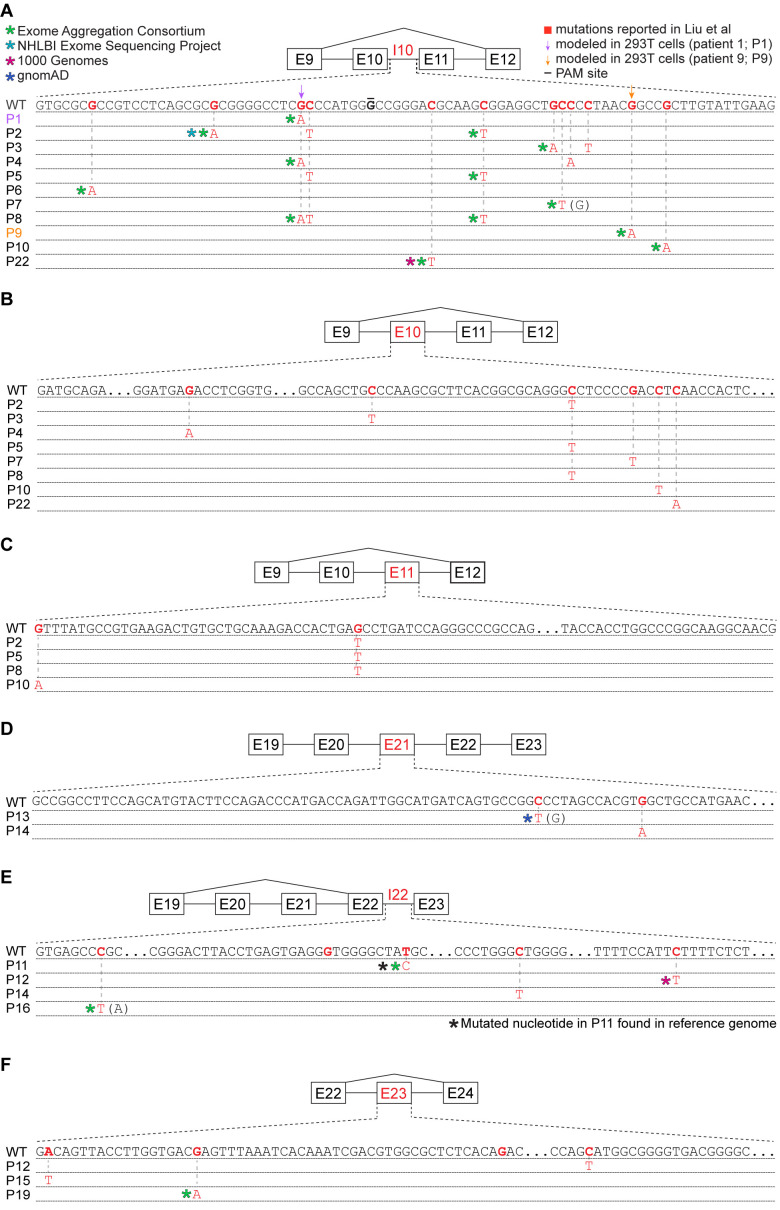
Pancreatic adenosquamous carcinoma (PASC) is an aggressive cancer whose mutational origins are poorly understood. An early study reported high-frequency somatic mutations affecting UPF1, a nonsense-mediated mRNA decay (NMD) factor, in PASC, but subsequent studies did not observe these lesions. The corresponding controversy about whether UPF1 mutations are important contributors to PASC has been exacerbated by a paucity of functional studies. Here, we modeled two UPF1 mutations in human and mouse cells to find no significant effects on pancreatic cancer growth, acquisition of adenosquamous features, UPF1 splicing, UPF1 protein, or NMD efficiency. We subsequently discovered that 45% of UPF1 mutations reportedly present in PASCs are identical to standing genetic variants in the human population, suggesting that they may be non-pathogenic inherited variants rather than pathogenic mutations. Our data suggest that UPF1 is not a common functional driver of PASC and motivate further attempts to understand the genetic origins of these malignancies.

Keywords: cancer biology; cancer genetics; cancer genomics; human; pancreatic cancer.

Plain language summary

Cancer is a group of complex diseases in which cells grow uncontrollably and spread into surrounding tissues and other parts of the body. All types of cancers develop from changes – or mutations – in the genes that affect the pathways involved in controlling the growth of cells. Different cancers possess unique sets of mutations that affect specific genes, and often, it is difficult to determine which of them play the most important role in a particular type of cancer. For example, pancreatic adenosquamous carcinoma, a rare and aggressive form of pancreatic cancer, is a devastating disease with a poor chance of survival – patients rarely live longer than one year after diagnosis. While the cells of this particular cancer display distinct features that separate them from other forms of pancreatic cancer, the genetic causes of these features are unclear. Using new technologies, some researchers have reported mutations in a ‘quality control’ gene called ‘UPF1’, which is responsible for destroying faulty forms of genetic material. However, subsequent studies did not find such mutations. To clarify the role of UPF1 in pancreatic adenosquamous carcinoma, Polaski et al. used mouse and human cancer cells with UPF1 mutations and monitored their effects on tumour growth and the development of features unique to this disease. Polaski et al. first injected mice with mouse pancreatic cancer cells containing mutations in UPF1 (mutated cells) and cancer cells without. Both groups of mice developed pancreatic tumours but there was no difference in tumour growth between the mutated and non-mutated cells, and neither cell type displayed distinct features. The researchers then generated human mutated cells, which were also found to lack any specific characteristics. Further analysis showed that the mutations did not stop UPF1 from working, in fact, over 40% of these mutations occurred naturally in humans without causing cancer. This suggests that UPF1 does not seem to be involved in pancreatic adenosquamous carcinoma. Further investigation is needed to illuminate key genetic players in the development of this type of cancer, which will be vital for improving treatments and outcomes for patients suffering from this disease.


Conflict of interest statement

JP, DU, LE, GA, SL, AV, RK, RB No competing interests declared

Figures

Figure 1.
Figure 1.. UPF1 mutations do not result in the acquisition of squamous histological features or confer a growth advantage to mutant cells in vivo.
(A) Schematic of UPF1 gene structure and corresponding encoded protein domains. Intron 10 (I10) contains the bulk of the mutations reported by Liu et al. Scissors indicate the sites targeted by the paired guide RNAs used to excise exons 10 and 11 (E10 and E11). Red nucleotides represent positions subject to point mutations reported in Liu et al. Arrows indicate specific mutations that we modeled in 293 T cells. The horizontal black line indicates the nucleotide within the protospacer adjacent motif (PAM) site that we mutated to prevent repeated cutting by Cas9 in 293 T cells. (B) Top, experimental strategy for testing whether mimicking UPF1 mis-splicing by deleting exons 10 and 11 promoted pancreatic cancer growth. Mice were orthotopically injected with mouse pancreatic cancer cells (KPC cells: KrasG12D; Trp53R172H/null; Pdx1-Cre) lacking Upf1 exons 10 and 11. Bottom, hematoxylin and eosin (H and E) stain of pancreatic tumor tissue harvested from the mice. (C) Line graph comparing tumor volume between mice injected with control (AdCas9; Cas9 only) or treatment (AdUpf1; Cas9 with Upf1-targeting guide RNAs) KPC cells. Tumor volume measured by ultrasound imaging. Error bars, standard deviation computed over surviving animals (n = 10 at first time point). n.s., not significant (p>0.05). p-values at each timepoint were calculated relative to the control group with an unpaired, two-tailed t-test. (D) Survival curves for the control (AdCas9) or treatment (AdUpf1) cohorts. Error bars, standard deviation computed over biological replicates (n = 10, each group). p-value was calculated relative to the control group by a logrank test. (E) Representative hematoxylin and eosin (H and E) staining of a pancreatic tumor resulting from orthotopic injection of control KPC cells displaying features of a moderately to poorly differentiated pancreatic ductal adenocarcinoma. Tumors were composed of medium-size duct-like structures and small tubular glands with lower mucin production. (F) Representative H and E image illustrating a moderately to poorly differentiated pancreatic ductal adenocarcinoma resulting from orthotopic injection of Upf1-targeted KPC cells. Depicted here is a section of the poorly differentiated component (arrow), which was characterized by solid sheets of tumor cells with large eosinophilic cytoplasms and marked nuclear polymorphism. (G) Representative H and E image of a pancreatic tumor resulting from orthotopic injection of Upf1-targeted KPC cells. The dashed circle marks a moderately differentiated component; the remainder is poorly differentiated. (H) Representative IHC image of a pancreatic tumor resulting from orthotopic injection of Upf1-targeted KPC cells for the squamous marker p40 (ΔNp63). No expression of the marker was observed in tumor cells.
Figure 1—figure supplement 1.
Figure 1—figure supplement 1.. Validation experiments in mouse KPC cells.
(A) Titration of adenovirus expressing Cas9 only (AdCas9) or Cas9 and guide RNAs targeting intron 9 and intron 11 of mouse Upf1 (AdUpf1) in KPC cells. Gel corresponds to PCR using genomic DNA with primers in exons 9 and 12 (E9, E12). The lower band, corresponding to excision of exons 10 and 11, was only observed in AdUpf1 conditions. This band was excised and sequence-verified by Sanger sequencing (sequence trace displayed below). (B) As (A), but assaying a cDNA library instead of genomic DNA using RT-PCR. The lower band, corresponding to spliced mRNA lacking exons 10 and 11, was only observed in AdUpf1 conditions. (C) Immunoblot with a probe against UPF1. Levels of full-length UPF1 protein are lower in AdUpf1 conditions, as expected. 1 and 2 indicate biological replicates. Tubulin serves as a loading control. (D) Raw gel image for the genomic DNA PCR shown in (A). The cropped region is boxed in white. (E) Raw gel image for the RT-PCR shown in (B). The cropped region is boxed in white. (F) Raw image of the western blot shown in (C). The cropped region is boxed in white. (G) Raw image of the western blot for the mouse tubulin loading control shown in (C). The cropped region is boxed in white.
Figure 2.
Figure 2.. Mutations in UPF1 intron 10 do not inhibit nonsense-mediated mRNA decay (NMD) or cause exon skipping.
(A) Box plot of NMD efficiency in 293 T cells engineered to contain wild-type (WT) or mutant (P1, P9) UPF1. P1 and P9 correspond to the IVS10+31G>A and IVS10-17G>A mutations reported by Liu et al. All cells have the protospacer adjacent motif (PAM) site mutation illustrated in Figure 1A. NMD efficiency estimated via the beta-globin reporter assay11. Middle line, notches, and whiskers indicate median, first and third quartiles, and range of data. Each point corresponds to a single biological replicate. n.s., not significant (p>0.05). p-values were calculated for each variant relative to the control by a two-sided Mann–Whitney test (p=0.40 for P1, 0.30 for P9). (B) Scatter plot showing transcriptome-wide quantification of transcripts containing NMD-promoting features in 293 T cells carrying the UPF1 mutation that was reportedly observed in patient 1 relative to control, wild-type cells. Each point corresponds to a single isoform that is a predicted NMD substrate (NMD(+)). Purple points represent NMD substrates that are significantly increased in UPF1-mutant cells relative to wild-type cells; black points represent NMD substrates that exhibit the opposite behavior. Plot is restricted to NMD substrates arising from differential inclusion of cassette exons. Significantly increased/decreased NMD substrates were defined as transcripts that displayed either an absolute increase/decrease in isoform ratio of ≥10% or an absolute log fold-change in expression of ≥2 with associated p≤0.05 (two-sided t-test). (C) As (B), but for 293 T cells carrying the UPF1 mutation that was reportedly observed in patient 9. Gold points represent NMD substrates that are significantly increased in UPF1-mutant cells relative to wild-type cells. (D) Summary of the numbers of NMD substrates arising from differential alternative splicing that exhibit significantly higher or lower levels in UPF1-mutant cells relative to wild-type cells. Analysis is identical to (B) and (C), but extended to the illustrated different types of alternative splicing. (E) Left, immunoblot of full-length UPF1 protein for the 293 T cell lines. Each lane represents a single biological replicate with the indicated genotype. GAPDH serves as a loading control. Equal amounts of protein were loaded in each lane (measured by fluorescence). Right, box plot illustrating UPF1 protein levels relative to GAPDH for each genotype. Middle line, notches, and whiskers indicate median, first and third quartiles, and range of data. Each point corresponds to a single biological replicate. Data was quantified with Fiji (v2.0.0). A.U., arbitrary units. n.s., not significant (p>0.05). p-values were calculated for each variant relative to the control by a two-sided Mann–Whitney test (p=0.10 for P1, 1.0 for P9). (F) PCR using primers that amplify both full-length UPF1 mRNA (FL) and mRNA lacking exons 10 and 11 (ΔE10-11). UPF1 mRNA lacking exons 10 and 11 was only detected in the positive control lanes (ΔE10-11 spike in), in which DNA corresponding to UPF1 cDNA lacking exons 10 and 11 was synthesized and added to cDNA libraries created from WT cells prior to PCR. Numbers above each lane indicate biological replicates. Numbers below each lane represent the abundance of the lower band as a percentage of total intensity (see Materials and methods). Data was quantified with Fiji (v2.0.0). (G) RNA-seq read coverage across the genomic locus containing UPF1 exons 9–12 in the indicated 293 T cell lines. Each sample corresponds to a distinct biological replicate. Numbers represent read counts that supported each indicated splice junction (Katz et al., 2015).
Figure 2—figure supplement 1.
Figure 2—figure supplement 1.. Validation experiments in human 293 T cells and raw gel images for western blot and RT-PCR.
(A) Sanger sequencing of genomic DNA from engineered 293 T cells verifying introduction of the mutation IVS10+31G>A in a homozygous state, as reported by Liu et al. for patient P1, as well as a single protospacer adjacent motif (PAM) site mutation. (B) Sanger sequencing of genomic DNA from engineered 293 T cells verifying introduction of the IVS10-17G>A mutation in a heterozygous state, as reported by Liu et al. for patient P9, as well as a single PAM site mutation. (C) Sanger sequencing of genomic DNA from engineered 293 T cells verifying introduction of a single PAM site mutation as a wild-type control. (D) Raw image of the western blot from Figure 2E. The cropped regions for UPF1 and GAPDH are boxed in red. (E) Raw image of the RT-PCR gel from Figure 2F. The cropped region for full-length UPF1 is boxed in red.
Figure 3.
Figure 3.. Many reported UPF1 mutations are identical to genetic variants.
(A) Illustration of the mutations in UPF1 intron 10 (I10) reported by Liu et al. Each row indicates the wild-type (WT) sequence from the reference human genome or mutations reported by Liu et al. (P1, patient 1). Purple and gold arrows indicate the mutations that we modeled with genome engineering in 293 T cells for patient 1 and patient 9, respectively. Red nucleotides represent positions subject to point mutations reported in Liu et al. The horizontal black line indicates the nucleotide within the protospacer adjacent motif (PAM) site that we mutated to prevent repeated cutting by Cas9. Parentheses indicate where we found genetic variation at a reported mutation position that differed from the specific mutated nucleotide reported by Liu et al. (B) As (A), but for UPF1 exon 10 (E10). (C) As (A), but for UPF1 exon 11 (E11). (D) As (A), but for UPF1 exon 21 (E21). (E) As (A), but for UPF1 intron 22 (I22). (F) As (A), but for UPF1 exon 23 (E23).

Similar articles

Cited by

References

    1. Auton A, Brooks LD, Durbin RM, Garrison EP, Kang HM, Korbel JO, Marchini JL, McCarthy S, McVean GA, Abecasis GR, 1000 Genomes Project Consortium A global reference for human genetic variation. Nature. 2015;526:68–74. doi: 10.1038/nature15393. - DOI - PMC - PubMed
    1. Avery P, Vicente-Crespo M, Francis D, Nashchekina O, Alonso CR, Palacios IM. Drosophila Upf1 and Upf2 loss of function inhibits cell growth and causes animal death in a Upf3-independent manner. RNA. 2011;17:624–638. doi: 10.1261/rna.2404211. - DOI - PMC - PubMed
    1. Borazanci E, Millis SZ, Korn R, Han H, Whatcott CJ, Gatalica Z, Barrett MT, Cridebring D, Von Hoff DD. Adenosquamous carcinoma of the pancreas: molecular characterization of 23 patients along with a literature review. World Journal of Gastrointestinal Oncology. 2015;7:132–140. doi: 10.4251/wjgo.v7.i9.132. - DOI - PMC - PubMed
    1. Dvinge H, Ries RE, Ilagan JO, Stirewalt DL, Meshinchi S, Bradley RK. Sample processing obscures cancer-specific alterations in leukemic transcriptomes. PNAS. 2014;111:16802–16807. doi: 10.1073/pnas.1413374111. - DOI - PMC - PubMed
    1. Escobar-Hoyos LF, Penson A, Kannan R, Cho H, Pan CH, Singh RK, Apken LH, Hobbs GA, Luo R, Lecomte N, Babu S, Pan FC, Alonso-Curbelo D, Morris JP, Askan G, Grbovic-Huezo O, Ogrodowski P, Bermeo J, Saglimbeni J, Cruz CD, Ho YJ, Lawrence SA, Melchor JP, Goda GA, Bai K, Pastore A, Hogg SJ, Raghavan S, Bailey P, Chang DK, Biankin A, Shroyer KR, Wolpin BM, Aguirre AJ, Ventura A, Taylor B, Der CJ, Dominguez D, Kümmel D, Oeckinghaus A, Lowe SW, Bradley RK, Abdel-Wahab O, Leach SD. Altered RNA splicing by mutant p53 activates oncogenic RAS signaling in pancreatic Cancer. Cancer Cell. 2020;38:198–211. doi: 10.1016/j.ccell.2020.05.010. - DOI - PMC - PubMed

Publication types

Associated data