Suppression gene drive in continuous space can result in unstable persistence of both drive and wild-type alleles
- PMID: 33404162
- PMCID: PMC7887089
- DOI: 10.1111/mec.15788
Suppression gene drive in continuous space can result in unstable persistence of both drive and wild-type alleles
Abstract
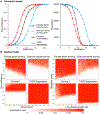
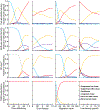
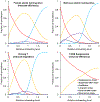
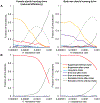
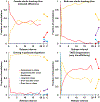
Rapid evolutionary processes can produce drastically different outcomes when studied in panmictic population models vs. spatial models. One such process is gene drive, which describes the spread of "selfish" genetic elements through a population. Engineered gene drives are being considered for the suppression of disease vectors or invasive species. While laboratory experiments and modelling in panmictic populations have shown that such drives can rapidly eliminate a population, it remains unclear if these results translate to natural environments where individuals inhabit a continuous landscape. Using spatially explicit simulations, we show that the release of a suppression drive can result in what we term "chasing" dynamics, in which wild-type individuals recolonize areas where the drive has locally eliminated the population. Despite the drive subsequently reconquering these areas, complete population suppression often fails to occur or is substantially delayed. This increases the likelihood that the drive is lost or that resistance evolves. We analyse how chasing dynamics are influenced by the type of drive, its efficiency, fitness costs, and ecological factors such as the maximal growth rate of the population and levels of dispersal and inbreeding. We find that chasing is more common for lower efficiency drives when dispersal is low and that some drive mechanisms are substantially more prone to chasing behaviour than others. Our results demonstrate that the population dynamics of suppression gene drives are determined by a complex interplay of genetic and ecological factors, highlighting the need for realistic spatial modelling to predict the outcome of drive releases in natural populations.
Keywords: biotechnology; ecological genetics; genetically modified organisms; population dynamics; population ecology; population genetics - theoretical.
© 2021 John Wiley & Sons Ltd.
Figures

Similar articles
-
Gene drives for invasive wasp control: Extinction is unlikely, with suppression dependent on dispersal and growth rates.Ecol Appl. 2023 Oct;33(7):e2912. doi: 10.1002/eap.2912. Epub 2023 Sep 13. Ecol Appl. 2023. PMID: 37615220
-
Simulations Reveal High Efficiency and Confinement of a Population Suppression CRISPR Toxin-Antidote Gene Drive.ACS Synth Biol. 2023 Mar 17;12(3):809-819. doi: 10.1021/acssynbio.2c00611. Epub 2023 Feb 24. ACS Synth Biol. 2023. PMID: 36825354
-
Making waves: Comparative analysis of gene drive spread characteristics in a continuous space model.Mol Ecol. 2023 Oct;32(20):5673-5694. doi: 10.1111/mec.17131. Epub 2023 Sep 11. Mol Ecol. 2023. PMID: 37694511
-
Incorporating ecology into gene drive modelling.Ecol Lett. 2023 Sep;26 Suppl 1:S62-S80. doi: 10.1111/ele.14194. Ecol Lett. 2023. PMID: 37840022 Review.
-
Resistance to natural and synthetic gene drive systems.J Evol Biol. 2020 Oct;33(10):1345-1360. doi: 10.1111/jeb.13693. Epub 2020 Sep 24. J Evol Biol. 2020. PMID: 32969551 Free PMC article. Review.
Cited by
-
Population suppression with dominant female-lethal alleles is boosted by homing gene drive.BMC Biol. 2024 Sep 11;22(1):201. doi: 10.1186/s12915-024-02004-x. BMC Biol. 2024. PMID: 39256812 Free PMC article.
-
A Comparative Assessment of Self-limiting Genetic Control Strategies for Population Suppression.Mol Biol Evol. 2025 Mar 5;42(3):msaf048. doi: 10.1093/molbev/msaf048. Mol Biol Evol. 2025. PMID: 40036822 Free PMC article.
-
Cleave and Rescue gamete killers create conditions for gene drive in plants.bioRxiv [Preprint]. 2024 Feb 27:2023.10.13.562303. doi: 10.1101/2023.10.13.562303. bioRxiv. 2024. Update in: Nat Plants. 2024 Jun;10(6):936-953. doi: 10.1038/s41477-024-01701-3. PMID: 37873352 Free PMC article. Updated. Preprint.
-
Manipulating the Destiny of Wild Populations Using CRISPR.Annu Rev Genet. 2023 Nov 27;57:361-390. doi: 10.1146/annurev-genet-031623-105059. Epub 2023 Sep 18. Annu Rev Genet. 2023. PMID: 37722684 Free PMC article. Review.
-
A framework for identifying fertility gene targets for mammalian pest control.Mol Ecol Resour. 2024 Feb;24(2):e13901. doi: 10.1111/1755-0998.13901. Epub 2023 Nov 27. Mol Ecol Resour. 2024. PMID: 38009398 Free PMC article.
References
-
- Hart SP, Usinowicz J, Levine JM. The spatial scales of species coexistence. Nat Ecol Evol, 1, 1066–1073, 2017. - PubMed
-
- Barton NH, Kelleher J, Etheridge AM. A new model for extinction and recolonization in two dimensions: quantifying phylogeography. Evolution, 64, 2701–15, 2010. - PubMed
-
- Barton NH, Depaulis F, Etheridge AM. Neutral evolution in spatially continuous populations. Theor Popul Biol, 61, 31–48, 2002. - PubMed
Publication types
MeSH terms
Grants and funding
LinkOut - more resources
Full Text Sources
Other Literature Sources

