. 2021 Oct;17(10):3140-3159.
doi: 10.1080/15548627.2020.1871204. Epub 2021 Jan 19.

BNIP3L-mediated mitophagy is required for mitochondrial remodeling during the differentiation of optic nerve oligodendrocytes

Affiliations

BNIP3L-mediated mitophagy is required for mitochondrial remodeling during the differentiation of optic nerve oligodendrocytes

Meysam Yazdankhah et al. Autophagy. 2021 Oct.

Abstract

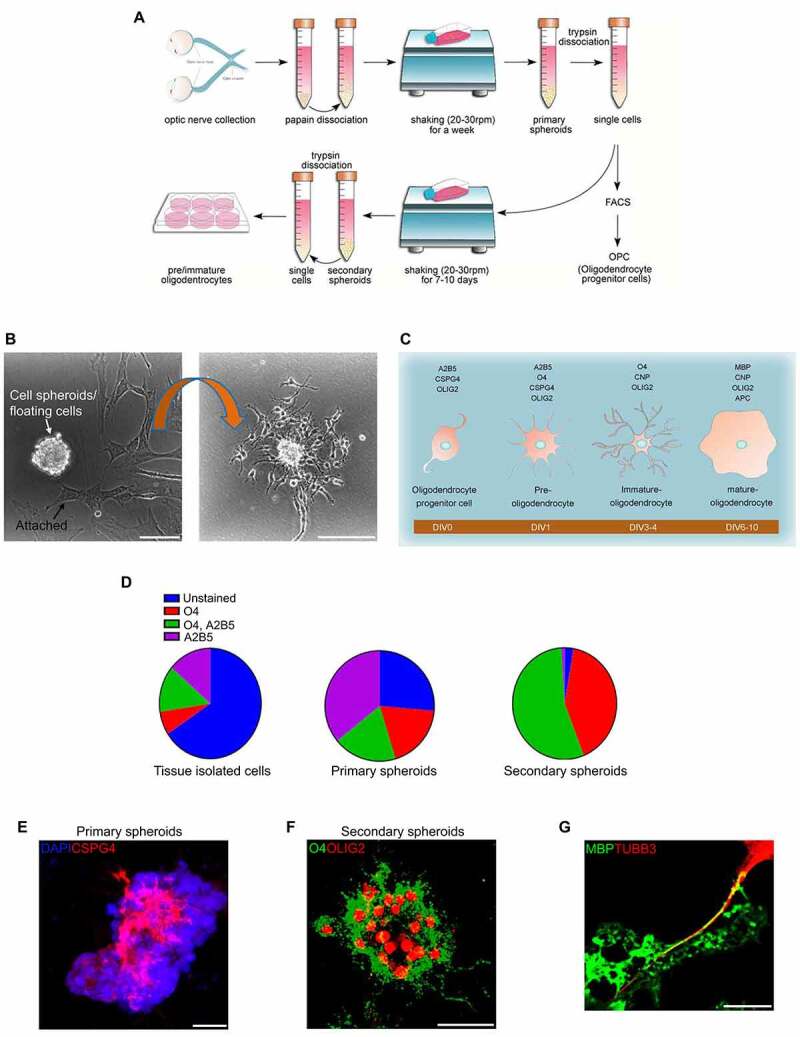
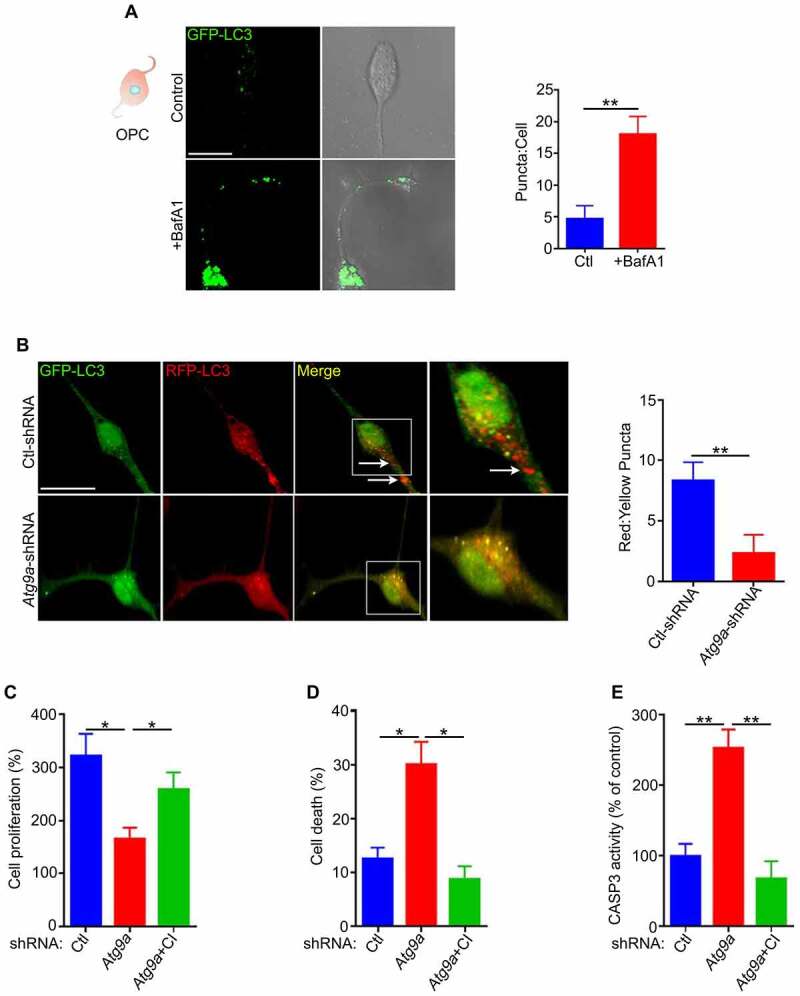
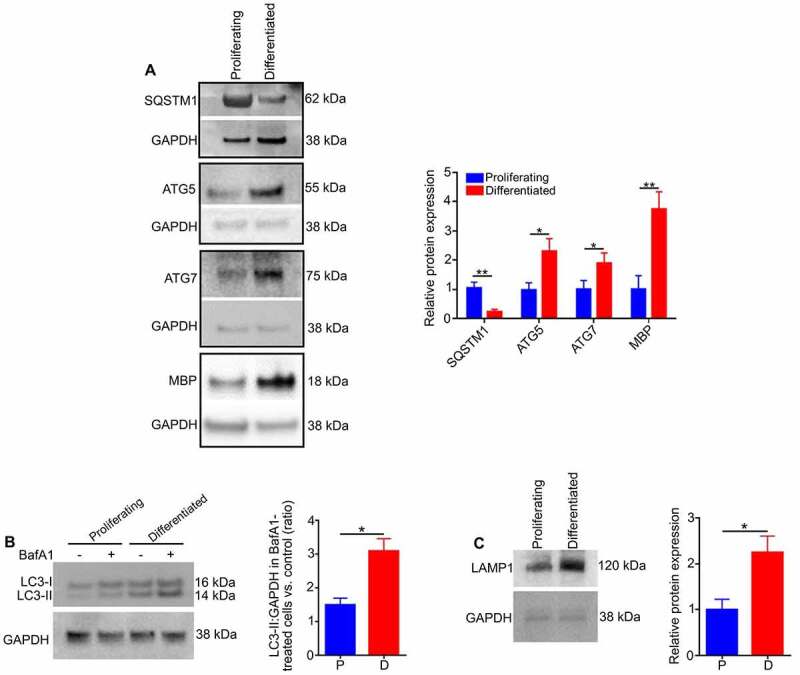
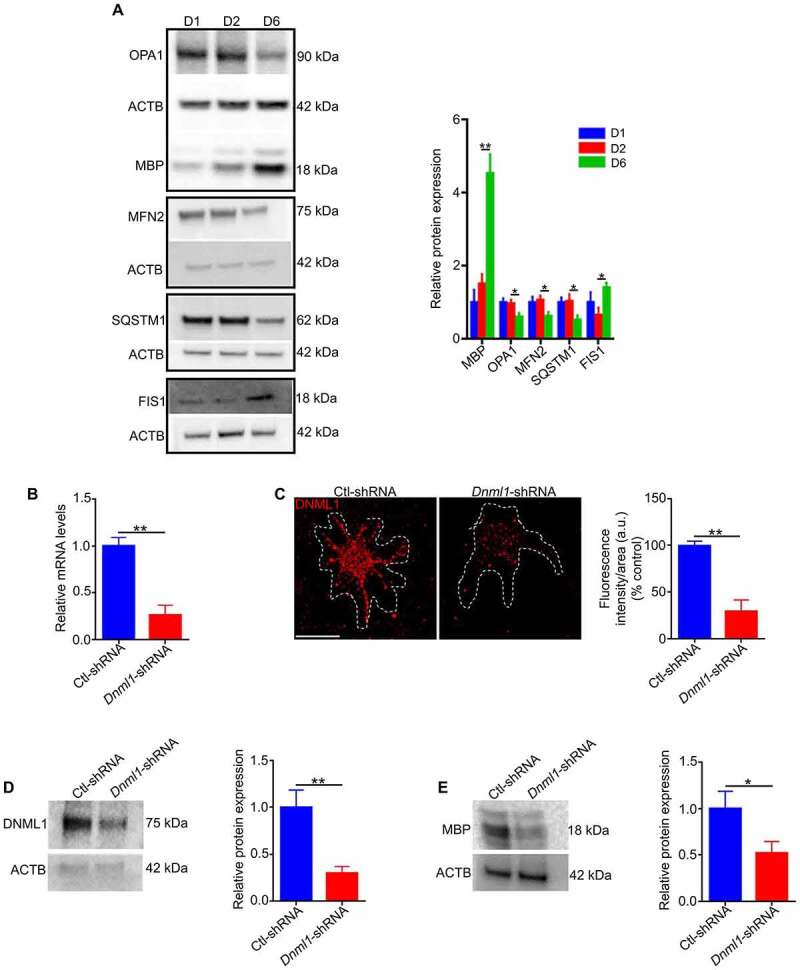
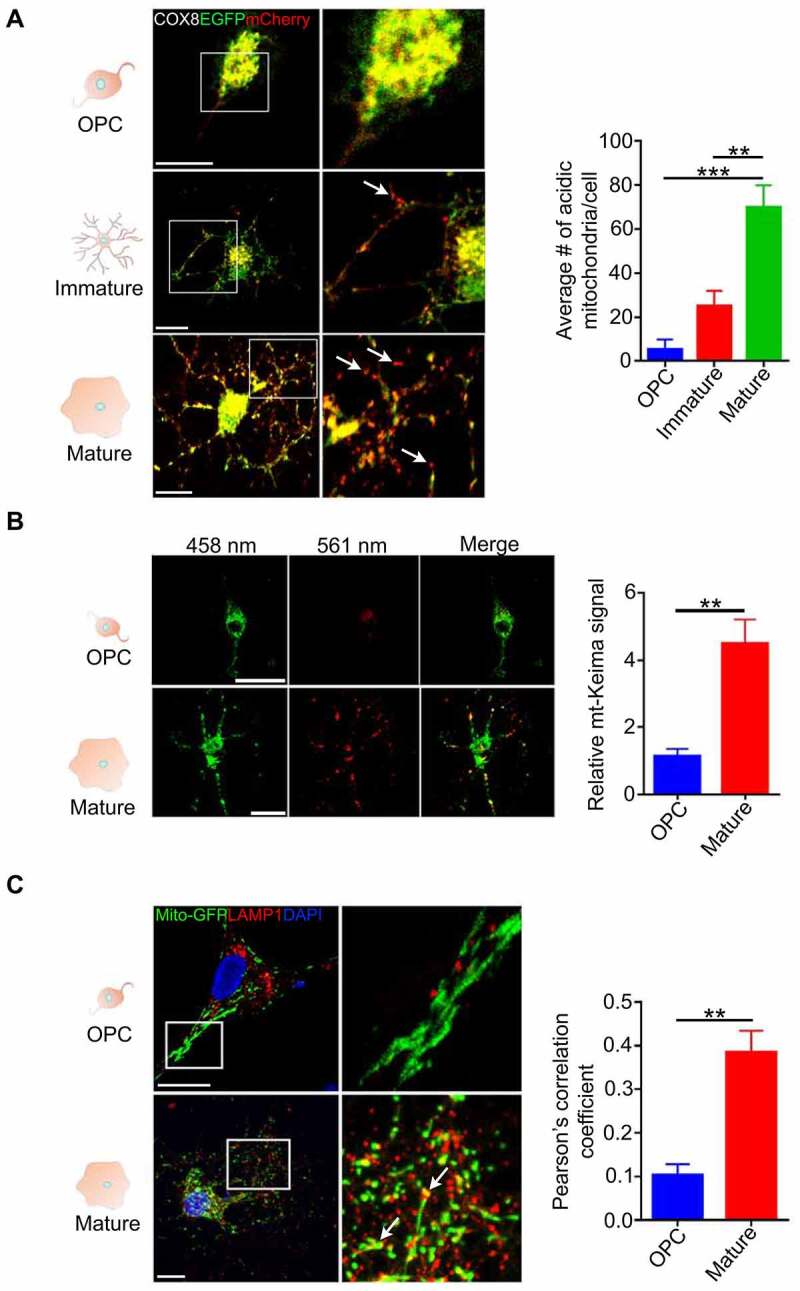
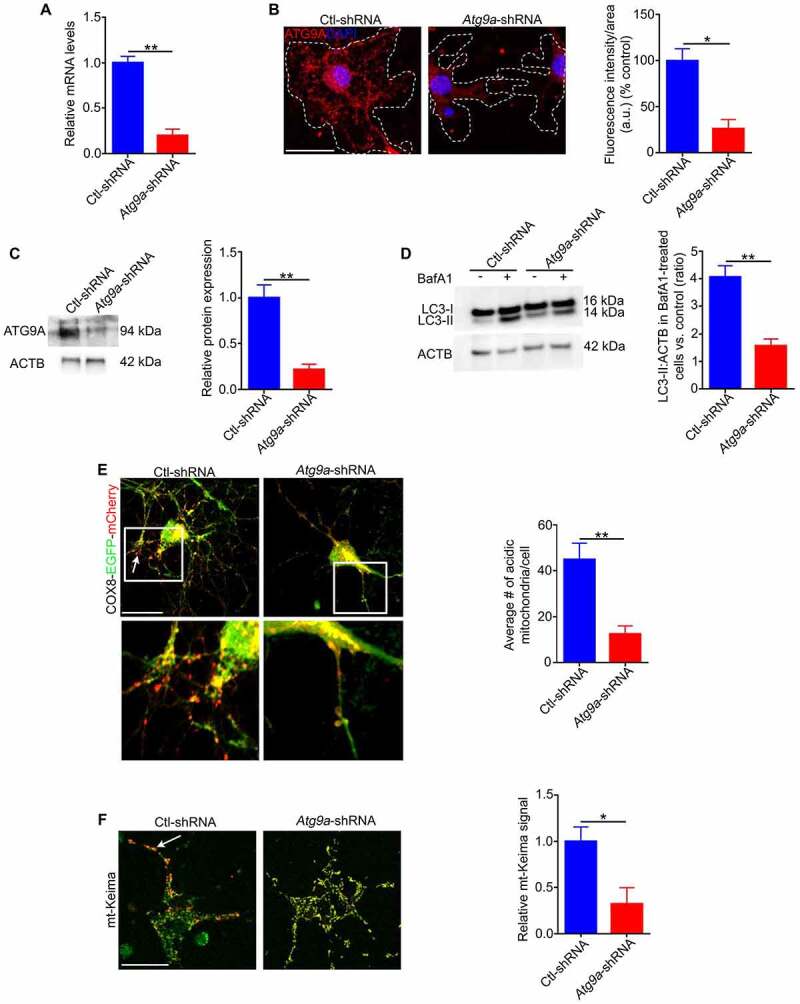
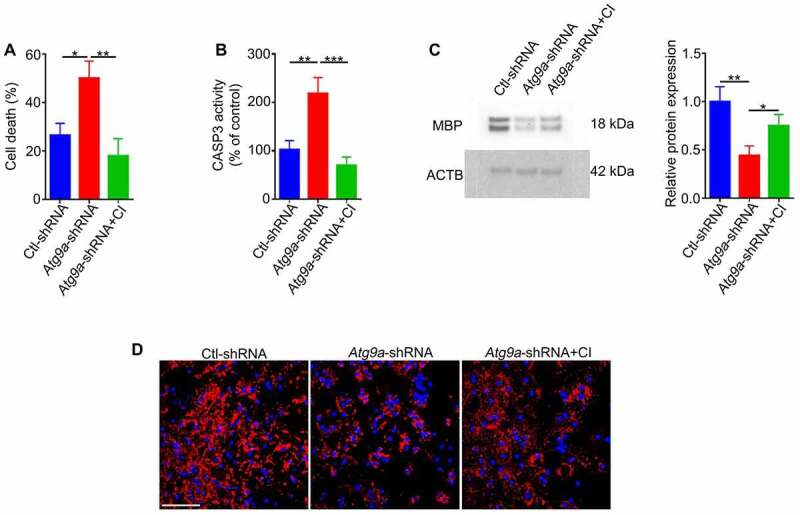
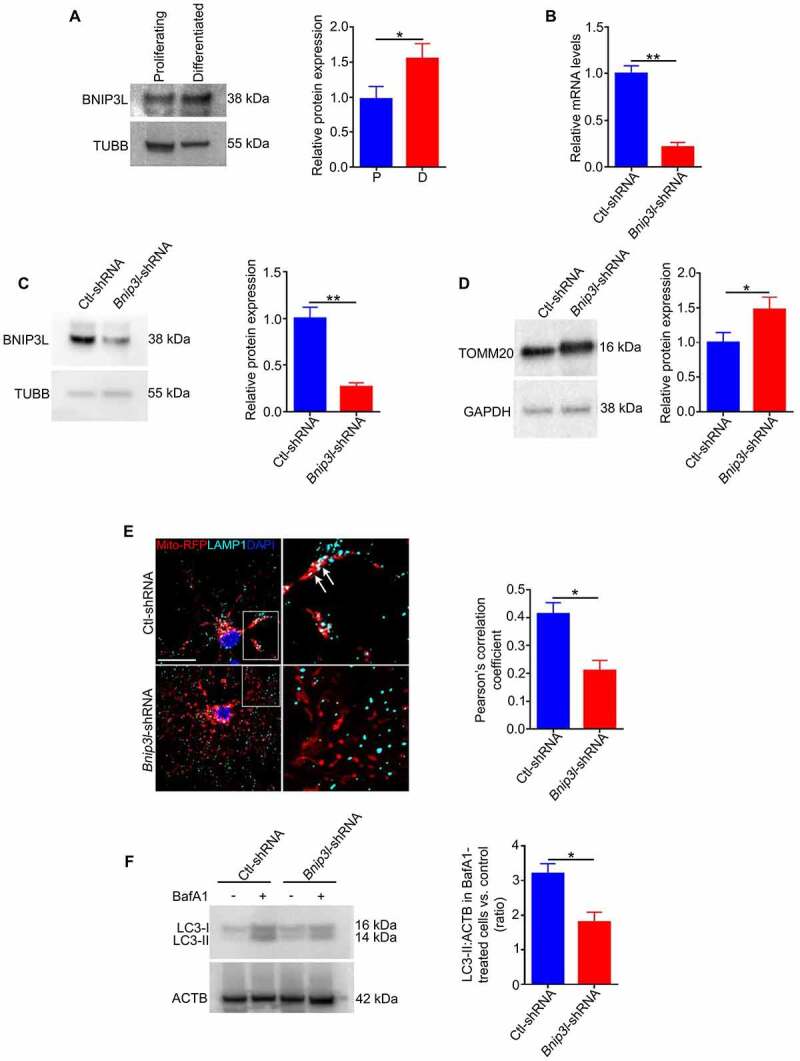
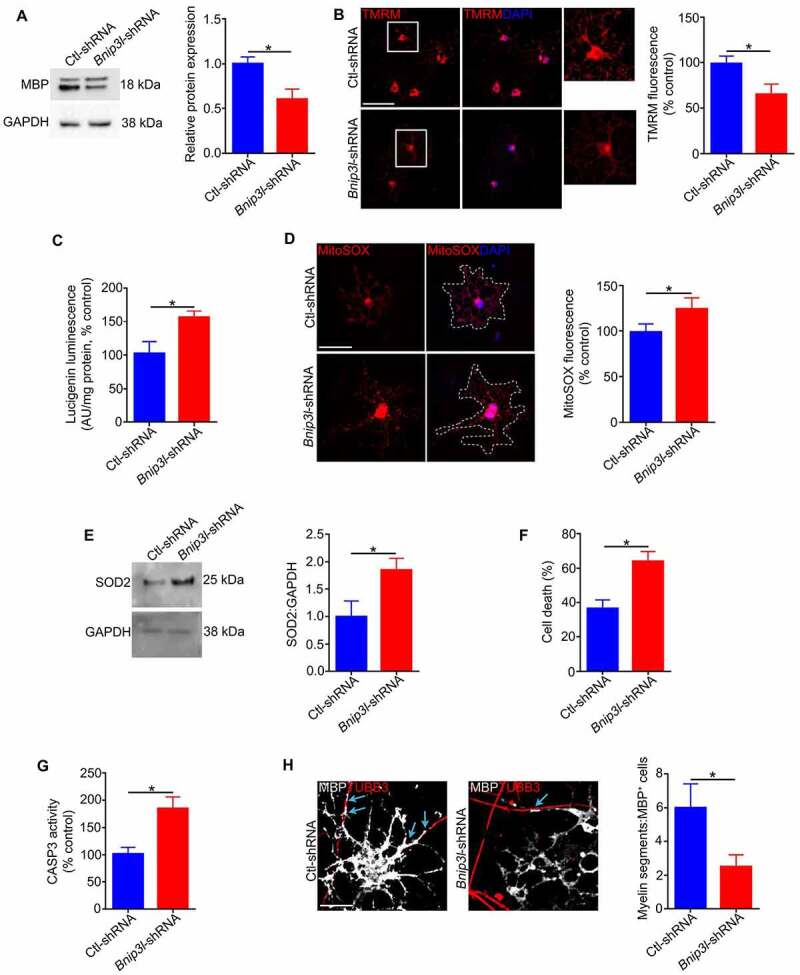
Retinal ganglion cell axons are heavily myelinated (98%) and myelin damage in the optic nerve (ON) severely affects vision. Understanding the molecular mechanism of oligodendrocyte progenitor cell (OPC) differentiation into mature oligodendrocytes will be essential for developing new therapeutic approaches for ON demyelinating diseases. To this end, we developed a new method for isolation and culture of ON-derived oligodendrocyte lineage cells and used it to study OPC differentiation. A critical aspect of cellular differentiation is macroautophagy/autophagy, a catabolic process that allows for cell remodeling by degradation of excess or damaged cellular molecules and organelles. Knockdown of ATG9A and BECN1 (pro-autophagic proteins involved in the early stages of autophagosome formation) led to a significant reduction in proliferation and survival of OPCs. We also found that autophagy flux (a measure of autophagic degradation activity) is significantly increased during progression of oligodendrocyte differentiation. Additionally, we demonstrate a significant change in mitochondrial dynamics during oligodendrocyte differentiation, which is associated with a significant increase in programmed mitophagy (selective autophagic clearance of mitochondria). This process is mediated by the mitophagy receptor BNIP3L (BCL2/adenovirus E1B interacting protein 3-like). BNIP3L-mediated mitophagy plays a crucial role in the regulation of mitochondrial network formation, mitochondrial function and the viability of newly differentiated oligodendrocytes. Our studies provide novel evidence that proper mitochondrial dynamics is required for establishment of functional mitochondria in mature oligodendrocytes. These findings are significant because targeting BNIP3L-mediated programmed mitophagy may provide a novel therapeutic approach for stimulating myelin repair in ON demyelinating diseases.Abbreviations: A2B5: a surface antigen of oligodendrocytes precursor cells, A2B5 clone 105; ACTB: actin, beta; APC: an antibody to label mature oligodendrocytes, anti-adenomatous polyposis coli clone CC1; ATG5: autophagy related 5; ATG7: autophagy related 7; ATG9A: autophagy related 9A; AU: arbitrary units; BafA1: bafilomycin A1; BCL2: B cell leukemia/lymphoma 2; BECN1: beclin 1, autophagy related; BNIP3: BCL2/adenovirus E1B interacting protein 3; BNIP3L/NIX: BCL2/adenovirus E1B interacting protein 3-like; CASP3: caspase 3; CNP: 2',3'-cyclic nucleotide 3'-phosphodiesterase; Ctl: control; COX8: cytochrome c oxidase subunit; CSPG4/NG2: chondroitin sulfate proteoglycan 4; DAPI: 4'6-diamino-2-phenylindole; DNM1L: dynamin 1-like; EGFP: enhanced green fluorescent protein; FACS: fluorescence-activated cell sorting; FIS1: fission, mitochondrial 1; FUNDC1: FUN14 domain containing 1; GAPDH: glyceraldehyde-3-phosphate dehydrogenase; GFAP: glial fibrillary growth factor; GFP: green fluorescent protein; HsESC: human embryonic stem cell; IEM: immunoelectron microscopy; LAMP1: lysosomal-associated membrane protein 1; LC3B: microtubule-associated protein 1 light chain 3; MBP: myelin basic protein; MFN2: mitofusin 2; Mito-Keima: mitochondria-targeted monomeric keima-red; Mito-GFP: mitochondria-green fluorescent protein; Mito-RFP: mitochondria-red fluorescent protein; MitoSOX: red mitochondrial superoxide probe; MKI67: antigen identified by monoclonal antibody Ki 67; MMP: mitochondrial membrane potential; O4: oligodendrocyte marker O4; OLIG2: oligodendrocyte transcription factor 2; ON: optic nerve; OPA1: OPA1, mitochondrial dynamin like GTPase; OPC: oligodendrocyte progenitor cell; PDL: poly-D-lysine; PINK1: PTEN induced putative kinase 1; PRKN/Parkin: parkin RBR E3 ubiquitin protein ligase; RFP: red fluorescent protein; RGC: retinal ganglion cell; ROS: reactive oxygen species; RT-PCR: real time polymerase chain reaction; SEM: standard error of the mean; SOD2: superoxide dismutase 2, mitochondrial; SQSTM1/p62: sequestosome 1; TEM: transmission electron microscopy; TMRM: tetramethylrhodamine methyl ester; TOMM20: translocase of outer mitochondrial membrane 20; TUBB: tubulin, beta; TUBB3: tubulin, beta 3 class III.

Keywords: ATG9A; autophagy; autophagy flux; co-culture; demyelinating diseases; glial cells; mitochondrial dynamics; myelin; oligodendrocyte lineage cells; retinal ganglion cell axons.


Conflict of interest statement

The authors have nothing to disclose.

Figures

Figure 1.
Figure 1.
A novel method for isolation of oligodendrocyte lineage cells from ON. (A) Schematic showing the steps for isolation and culture of oligodendrocyte lineage cells. (B) Slow shaking ON-derived dissociated cells for a week led to separation of two cell types (left panel): spheroids and attached cells. When the spheroids are dissociated and cultured on PDL coated plates without shaking (right panel), the morphology of individual cells is very different from the adherent cells seen in the left panel. Scale bar: 70 μm. (C) Specific markers are expressed in different oligodendrocyte lineage cell types (DIV, days in vitro). (D) Flow cytometry analysis revealed the relative proportion of different cell populations; OPCs (A2B5 positive, O4 negative), pre-oligodendrocytes (A2B5, O4 positive), immature oligodendrocytes (O4 positive, A2B5 negative), and unstained cells from freshly prepared ON dissociated cells, and from primary or secondary spheroids obtained from expanding cells in culture. (E) Primary spheroids were fixed and immunostained against CSPG4; approximately 50% of cells were CSPG4 positive. (F) Immunostaining of secondary spheroids showed that the majority of cells were OLIG2 and O4 positive. Scale bar: 20 μm. (G) OPCs (A2B5-positive, O4-negative cells) were differentiated for 8 days in co-culture with HsESC-derived RGCs, immunostained for MBP and TUBB3 (neuronal marker) and examined by confocal microscopy. Myelin segments formed between neurons and differentiated OLs, as indicated by colocalization. Scale bar: 5 μm
Figure 2.
Figure 2.
Active autophagy flux in OPCs. (A) OPCs were transduced by GFP-LC3B construct and treated with the lysosomal inhibitor, bafilomycin A1 (BafA1, 50 nM) during the final 2 hours in culture. Confocal imaging showed an increase of GFP-LC3B puncta in the BafA1-treated cells, indicating active autophagy flux. Scale bar: 10 μm. (B) Ctl and Atg9a-shRNA treated cells were transduced by RFP-GFP-LC3B construct. Yellow puncta correspond to autophagosomal structures since both GFP and RFP fluoresce at cytoplasmic pH. Red puncta represent autolysosomes because GFP is quenched by the acidity of lysosomes. Merged confocal images demonstrated many red puncta in Ctl-shRNA treated cells. In contrast, most puncta were yellow in Atg9a-shRNA treated cells, indicating blockage of autophagic flux. The numbers of autophagosomes and autolysosomes were quantified from 30 images per group for each experiment. Scale bar: 10 μm. (C) Proliferation rates of Ctl and Atg9a-shRNA treated cells were measured by counting the total number of cells after 72 h in culture and dividing by the initial number of cells. The cell proliferation is reduced and cell death is increased in Atg9a-shRNA treated cells relative to control. (D) Dead cell stain kit was used to measure the level of cell death by flow cytometry. Cell death was markedly increased in the Atg9a-shRNA treated cells. (E) CASP3 activity is significantly increased in Atg9a-shRNA cells. Treatment of Atg9a-shRNA cells with the selective CASP3 inhibitor (CI, Ac-DEVD-CHO) attenuated cell death and rescued the proliferation rate to control levels. Data are mean ± SEM. *p < 0.05; **p < 0.01
Figure 3.
Figure 3.
The activation of autophagy during oligodendrocyte differentiation. (A) Western blotting of proteins extracted from proliferating (undifferentiated) cells and differentiated cells (oligodendrocytes) showed that levels of ATG5, ATG7 and MBP were significantly increased and SQSTM1 expression was greatly reduced in differentiated cells relative to proliferating cells. (B) Undifferentiated and differentiated cells were cultured in the presence or absence of the lysosomal inhibitor bafilomycin A1 (BafA1). The cells were then lysed and protein lysates analyzed for LC3 by western blotting. A significant increase in the accumulation of the autophagosome-positive LC3-II isoform was observed in differentiated cells relative to undifferentiated (proliferating) cells after BafA1 treatment, indicating an increase in autophagy flux during differentiation. (C) Immunoblotting showed that expression of LAMP1 was increased in differentiated cells relative to undifferentiated cells. Values are mean ± SEM. *p < 0.05; **p < 0.01
Figure 4.
Figure 4.
Mitochondrial remodeling during OPC differentiation. (A) Representative electron microscopy images showing mitochondria (arrows) in undifferentiated precursor cells (OPCs and pre-oligodendrocytes) and differentiated oligodendrocytes from the ON. The undifferentiated cells from ON tissue of 5- and 10-day-old rat pups were identified by immunogold labeling using antibodies against A2B5 (marker of OPCs and oligodendrocytes) and O4 (marker of pre and immature oligodendrocytes at this age), while differentiated cells were identified using immunogold labeled antibodies against APC (an antibody to label mature oligodendrocytes) on the ONs of 21-day-old rat pups. In OPCs, mitochondrial morphology is more tubular while in differentiated cells the mitochondria are more fragmented. Scale bar: 800 nm. (B) Immunostaining of oligodendrocyte lineage cells against TOMM20 and MBP showed that as the expression of MBP is increased, the number of puncta from mitochondria (arrows) is also significantly increased. Scale bar: 10 μm
Figure 5.
Figure 5.
Changes in expression of proteins that regulate mitochondrial dynamics during differentiation of oligodendrocytes. (A) Undifferentiated cells (pre- and immature oligodendrocytes) were grown in differentiating media for 6 days. Immunoblotting showed a marked increase in MBP expression at the terminal stage of cell differentiation that is associated with a significant reduction in expression of mitochondrial fusion proteins (OPA1 and MFN2) and SQSTM1. However, the expression of mitochondrial fission protein (FIS1) is significantly increased. (B) Real-time PCR analysis showed that the mRNA expression of Dnm1l is significantly reduced in Dnm1l-shRNA treated cells relative to control. (C, D) Confocal microscopy and immunoblotting revealed a significant decrease in the staining pattern and protein expression of DNM1L in Dnm1l-shRNA treated cells compared to Ctl-shRNA. Scale bar: 10 μm. a.u., arbitrary units. (E) Undifferentiated cells treated with Dnm1l-shRNA or Ctl-shRNA were grown in differentiation medium for 6 days. Immunoblotting showed that expression of Dnm1l-shRNA in undifferentiated cells led to a significant reduction in MBP expression in differentiated cells relative to control. Data are mean ± SEM. *p < 0.05; **p < 0.01
Figure 6.
Figure 6.
Mitophagy is increased during OPC differentiation. (A) Oligodendrocyte lineage cells were transduced by Adenovirus-COX8-EGFP-mCherry and observed under a confocal microscope. The number of acidic (red-only) mitochondria is significantly increased as differentiation progressed. (mean ± SEM; n = 30 cells from three different experiments). Scale bar: 10 μm. (B) mt-Keima fluorescent protein was expressed in OPCs by lentiviral-mediated delivery and the cells were allowed to differentiate for 6 days. The mt-Keima signal was significantly increased in differentiated cells relative to OPCs (n = 40 cells from three different experiments). Scale bar: 10 μm. (C) OPCs and differentiated cells were transduced with Mito-GFP and then fixed and stained with anti-LAMP1. The Pearson’s correlation co-efficient analysis showed that colocalization greatly increased in differentiated cells. Arrows demonstrate colocalized mitochondria and LAMP1 in zoomed images (n = 20 cells from three different experiments). Scale bar: 10 μm. Data are mean ± SEM. *p < 0.05; **p < 0.01; ***p < 0.001
Figure 7.
Figure 7.
ATG9A is essential for autophagy and mitophagy during differentiation of oligodendrocytes (A) Real-time PCR analysis showed that expression of ATG9A mRNA is significantly reduced in Atg9a-shRNA treated cells relative to control. (B) Confocal microscopy and (C) immunoblotting revealed a significant decrease in immune-staining and protein expression of ATG9A in Atg9a-shRNA treated cells compared to control cells. Scale bar: 10 μm. (D) Undifferentiated cells treated with Atg9a-shRNA or Ctl-shRNA were allowed to grow in differentiation medium for 6 days with and without BafA1 during the last three hours of culture. The cells were then lysed and protein lysates were analyzed for LC3 by immunoblotting. A significant reduction in the accumulation of the LC3-II-positive autophagosomes was observed in Atg9a-shRNA treated cells relative to Ctl-ShRNA treated cells after BafA1 treatment. (E, F) During the last two days of culture, some cells were transduced with either COX8-EGFP-mCherry or mt-Keima fluorescent reporters. In (E), the number of acidic (red-only) mitochondria was significantly reduced in the Atg9a-shRNA cells relative to control. In (F), the mt-Keima signal was significantly reduced in the Atg9a-shRNA cells relative to control. Scale bar: 20 μm. Data are mean ± SEM. *p < 0.05; **p < 0.01
Figure 8.
Figure 8.
Autophagy impairment leads to increased susceptibility to cell death in newly formed differentiated cells. Undifferentiated cells infected with Atg9a-shRNA or Ctl-shRNA were grown in differentiation medium for 6 days. (A) Cell death and (B) CASP3 activity were increased in the Atg9a-shRNA treated cells relative to control. To measure cell death, the cells were stained with YO-PRO-1 and Hoechst followed by quantification of cell death with ImageJ software. In addition, treatment of Atg9a-shRNA cells with CASP3 inhibitor (CI, Ac-DEVD-CHO) led to a reduction in levels of cell death to the levels similar to those of Ctl-shRNA cells. (C) Representative immunoblot and (D) confocal images showing decreased MBP in Atg9a-shRNA treated cells, that was partially rescued by the CASP3 inhibitor. Scale bar: 100 μm. Values are mean ± SEM. *p < 0.05; **p < 0.01; ***p < 0.001
Figure 9.
Figure 9.
BNIP3L regulates mitophagy during differentiation of oligodendrocytes. (A) Immunoblotting of protein extracts from cultured undifferentiated cells and cells differentiated for 6 days showed that expression of BNIP3L was significantly increased in differentiated cells relative to undifferentiated cells. (B) Real-time PCR analysis showed that expression of Bnip3l mRNA is significantly reduced in Bnip3l-shRNA cells relative to control. (C) Expression of BNIP3L in undifferentiated cells was significantly reduced after treatment with Bnip3l-shRNA. (D) Immunoblotting showed that expression of Bnip3l-shRNA in undifferentiated cells led to a significant increase in TOMM20 in differentiated Bnip3l-shRNA oligodendrocytes relative to Ctl-shRNA. (E, F) Undifferentiated cells were treated with Bnip3l-shRNA or Ctl-shRNA and allowed to grow in differentiation medium for 6 days. (E) Then, these cells were transduced with Mito-RFP, fixed and immunostained with LAMP1. The fluorescent signal in the fully differentiated cells was visualized using confocal microscopy. An analysis of Pearson’s colocalization coefficient showed a significant reduction in colocalization of mitochondria and lysosomes in Bnip3l-shRNA cells (arrows) relative to Ctl-shRNA. Scale bar: 20 μm. Data are mean ± SEM; n = 25 cells from three different experiments. (F) On the sixth day, the Bnip3l-shRNA or Ctl-shRNA differentiating cells were cultured in differentiation medium with or without BafA1 during the last three hours of culture. Then, cells were then lysed and protein lysates were analyzed for LC3 by immunoblotting. A significant reduction in the accumulation of the LC3-II-positive autophagosomes was observed in Bnip3l-shRNA treated cells relative to Ctl-ShRNA after BafA1 treatment. Scale bar: 10 μm. Values are mean ± SEM. *p < 0.05
Figure 10.
Figure 10.
BNIP3L is required for mitochondrial function and survival of newly differentiated oligodendrocytes. Undifferentiated cells were infected with Bnip3l-shRNA or Ctl-shRNA and cultured in differentiation medium for 6 days. (A) Immunoblotting analysis showed a decrease in expression of MBP in Bnip3l-shRNA treated cells relative to those treated with control shRNA. (B) Representative confocal microscope images and quantitative analysis of TMRM fluorescence indicated a significant reduction in MMP in Bnip3l-shRNA cells relative to control. Scale bar: 50 μm. (C) Quantitative analysis of superoxide release showed that the level of superoxide is enhanced in Bnip3l-shRNA infected cells relative to control. (D) Representative images and quantification of MitoSOX fluorescence showed that the level of mitochondrial ROS is increased in Bnip3l-shRNA cells compared to control. Scale bar: 20 μm. (E) Immunoblotting of proteins extracted from differentiated cells showed elevated SOD2 expression in Bnip3l-shRNA infected cells relative to control. (F) Quantification of cell death (%) showed a significant reduction in the viability of Bnip3l-shRNA infected cells relative to control. (G) The level of CASP3 activity is increased in the Bnip3l-shRNA cells relative to control. (H) OPCs treated with Bnip3l or Ctl-shRNA were co-cultured with HsESC-dervied RGCs for 8 days in differentiation medium, then immunostained for MBP and TUBB3. Cells treated with Bnip3l-shRNA had fewer myelin segments (arrows) compared to Ctl-shRNA-treated cells. Scale bar: 10 μm. Values are mean ± SEM. *p < 0.05

References

    1. Yazdankhah M, Shang P, Ghosh S, et al. Role of glia in optic nerve. Prog Retin Eye Res. 2020. Aug 6:100886. PubMed PMID: 32771538; eng. DOI: 10.1016/j.preteyeres.2020.100886. - DOI - PMC - PubMed
    1. Simons M, Nave KA.. Oligodendrocytes: myelination and axonal support. Cold Spring Harbor Perspect Biol. 2015. Jun 22;8(1):a020479. . PubMed PMID: 26101081; PubMed Central PMCID: PMCPMC4691794. eng. - PMC - PubMed
    1. Reiszadeh-Jahromi S, Sepand MR, Ramezani-Sefidar S, et al. Sepantronium bromide (ym155), a small molecule survivin inhibitor, promotes apoptosis by induction of oxidative stress, worsens the behavioral deficits and develops an early model of toxic demyelination: in vivo and in-silico study. Neurochem Res. 2019. Nov;44(11):2482–2498. PubMed PMID: 31489534; eng. - PubMed
    1. Dooley MC, Foroozan R. Optic neuritis. J Ophthalmic Vis Res. 2010. Jul;5(3):182–187. PubMed PMID: 22737354; PubMed Central PMCID: PMCPMC3379920. eng - PMC - PubMed
    1. Williamson JM, Lyons DA. Myelin dynamics throughout life: an ever-changing landscape? Front Cell Neurosci. 2018;12:424. .PubMed PMID: 30510502; PubMed Central PMCID: PMCPMC6252314. eng - PMC - PubMed

Publication types

MeSH terms