. 2021 Jan 6:10:e58371.
doi: 10.7554/eLife.58371.

Bacterial symbiont subpopulations have different roles in a deep-sea symbiosis

Affiliations

Bacterial symbiont subpopulations have different roles in a deep-sea symbiosis

Tjorven Hinzke et al. Elife. .

Abstract

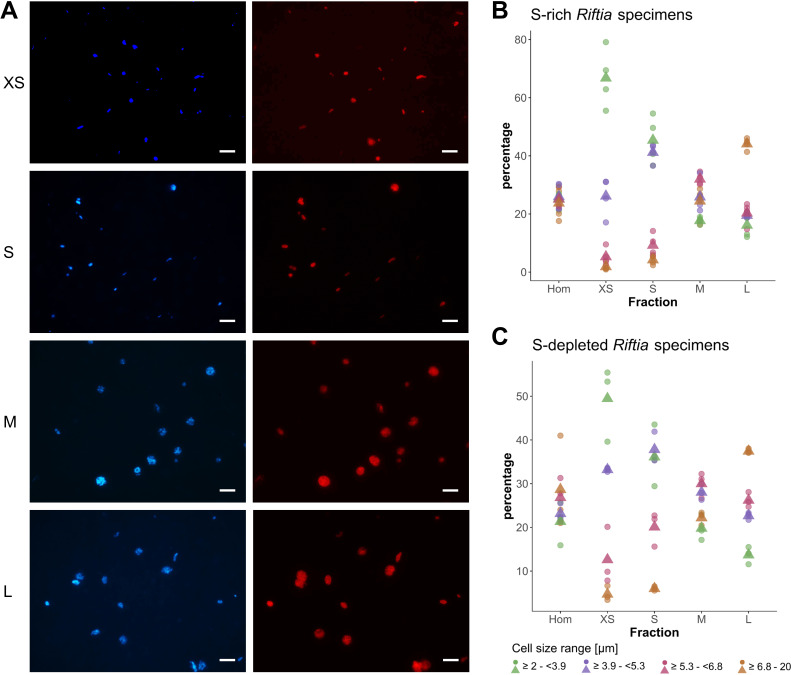
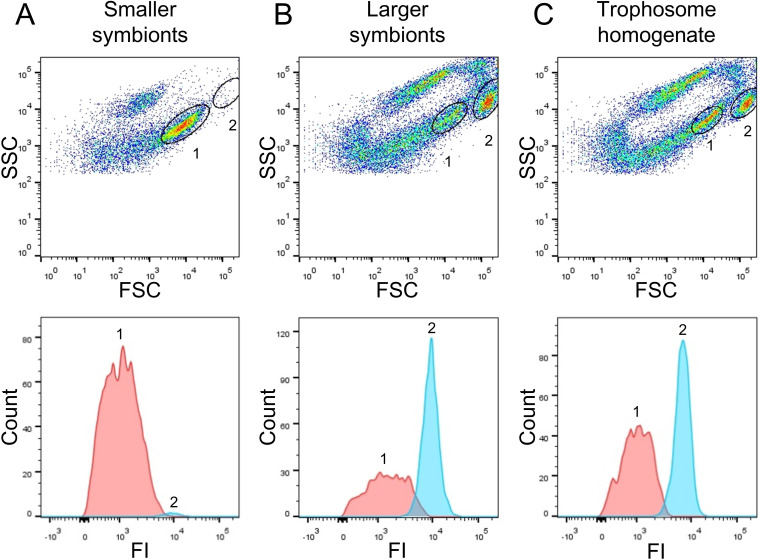
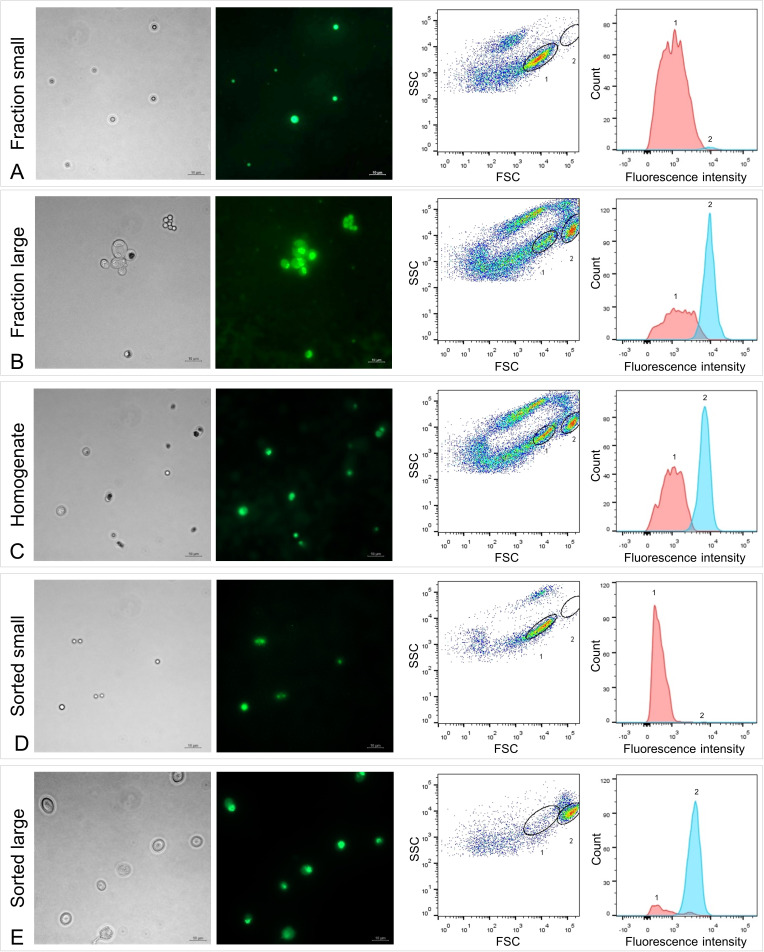
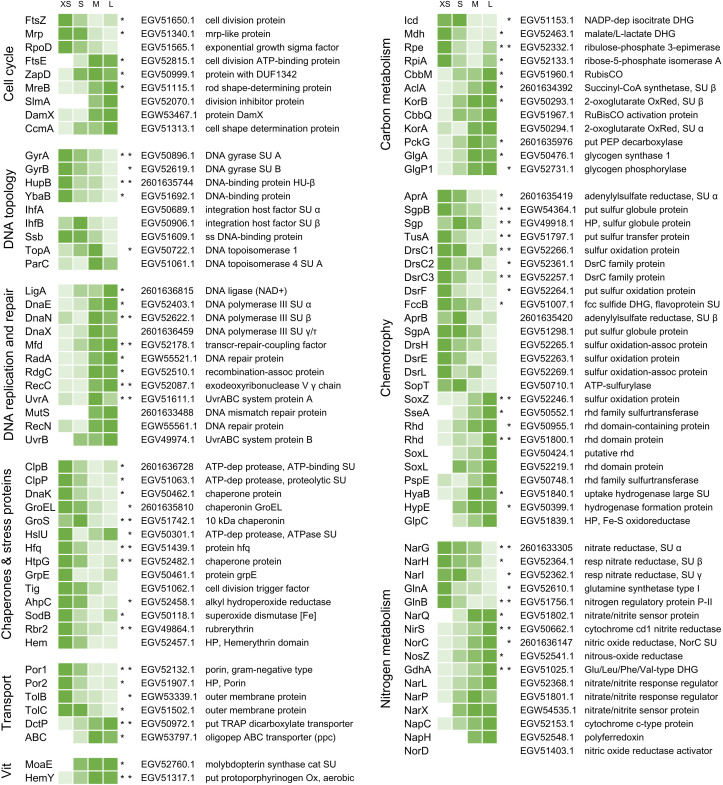
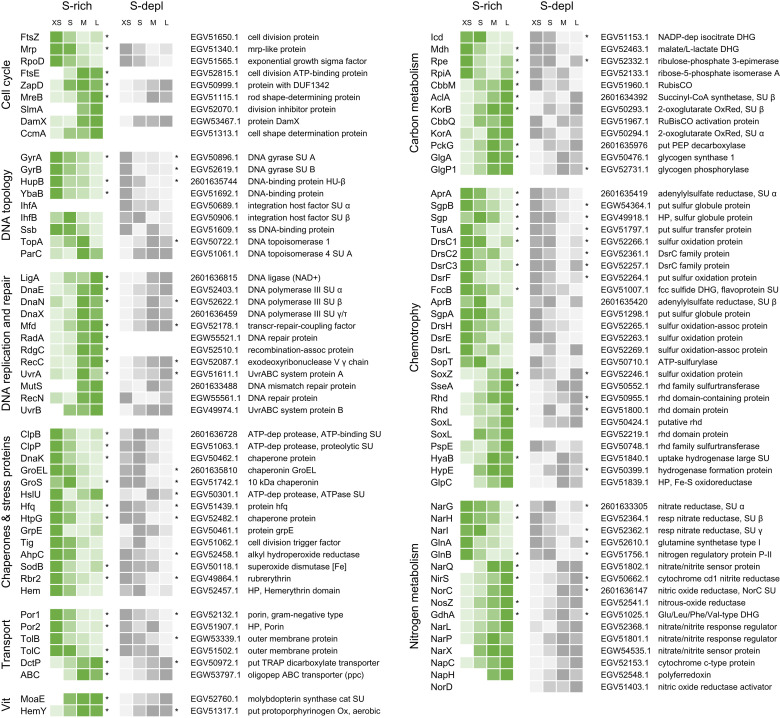
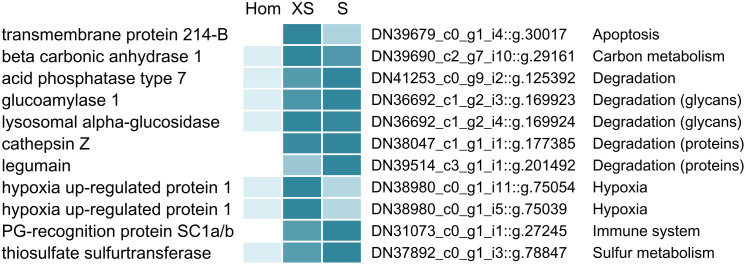
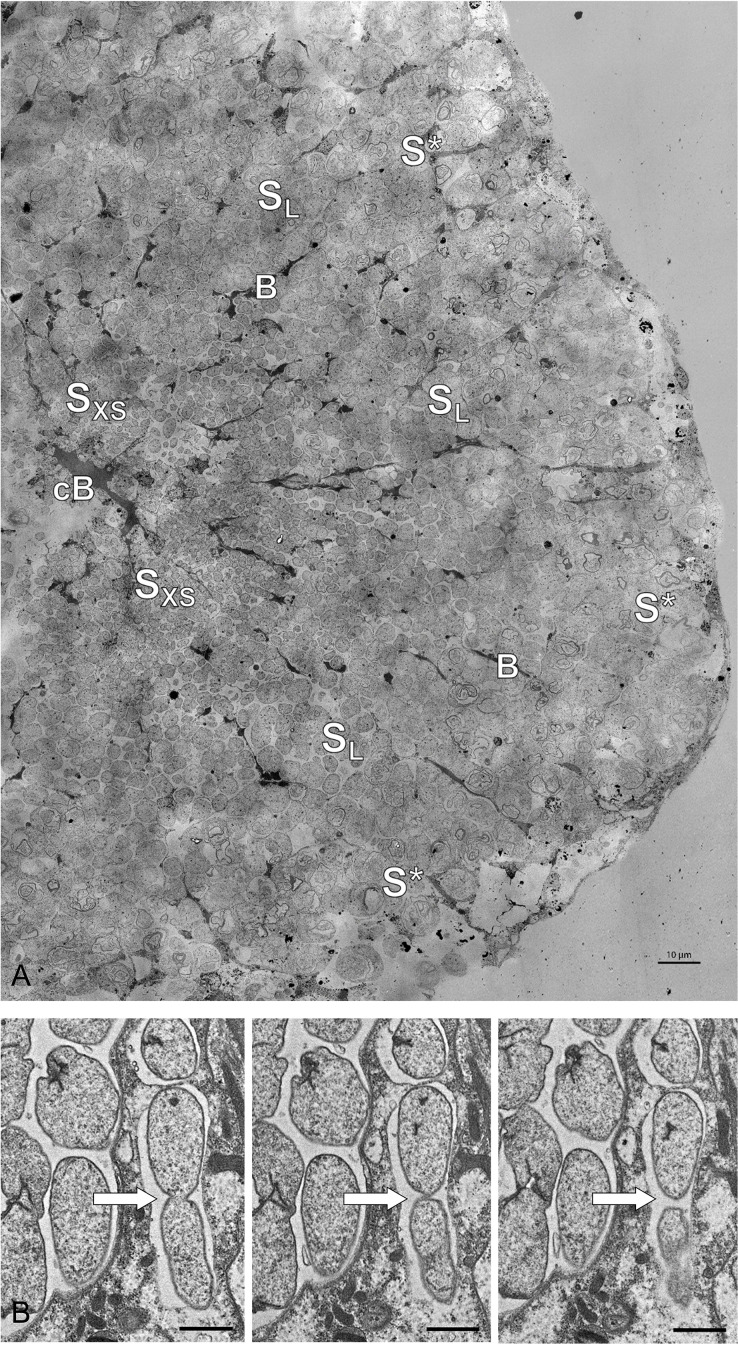
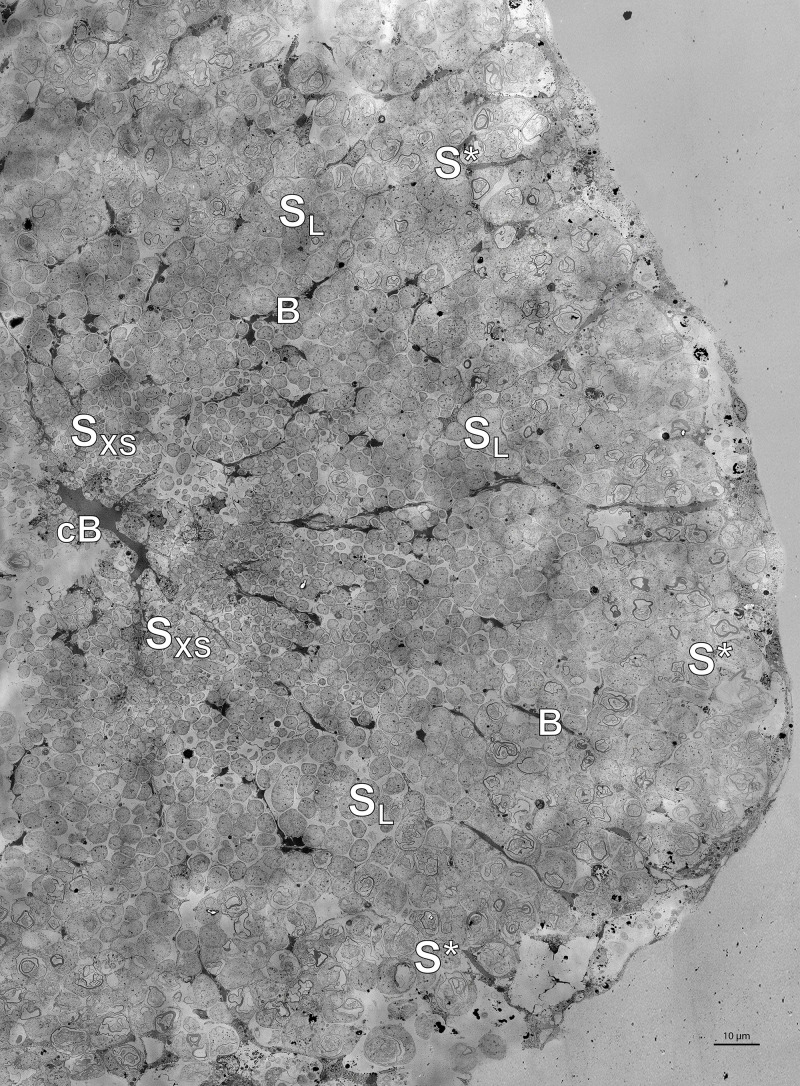
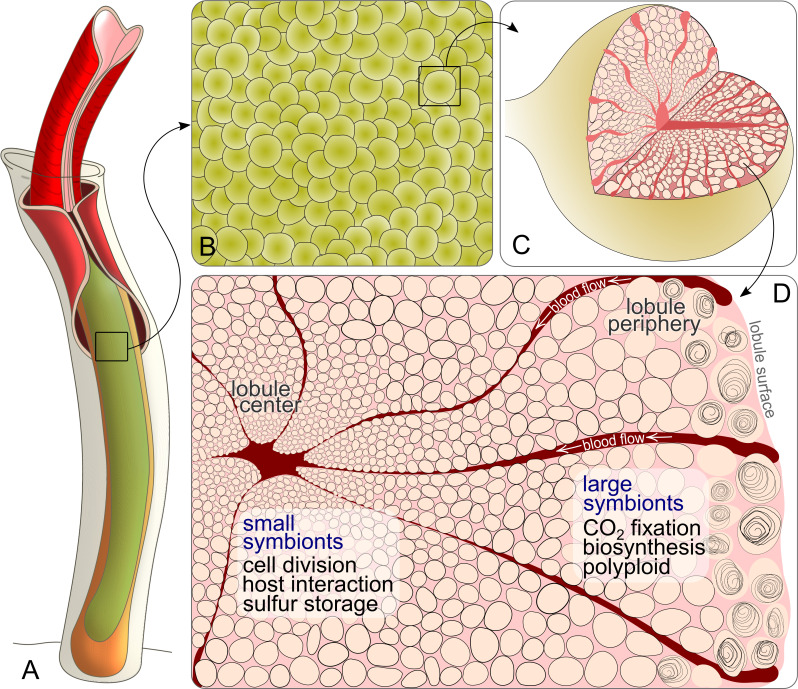
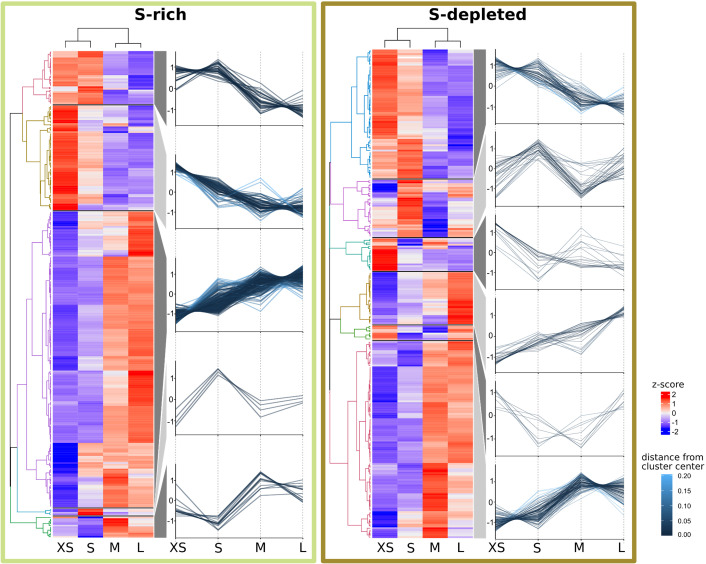
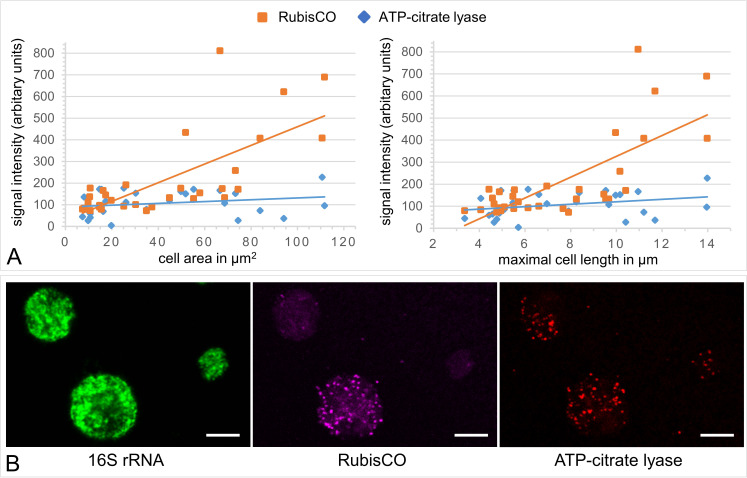
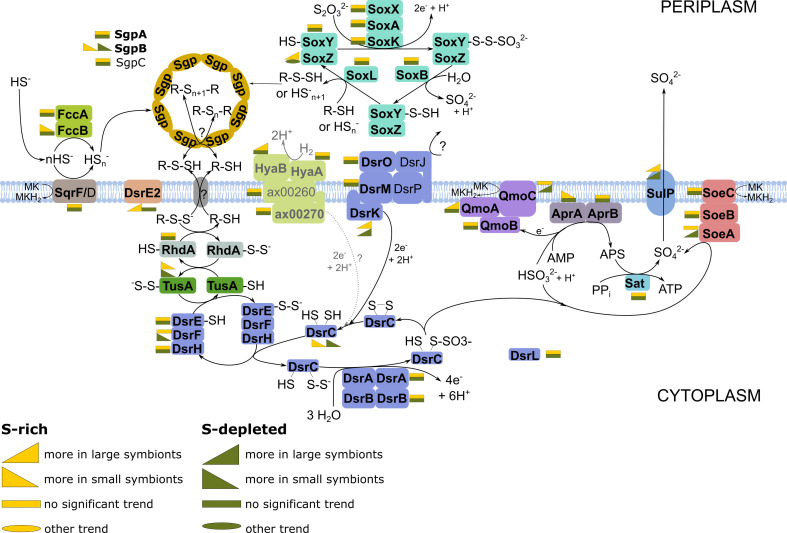
The hydrothermal vent tubeworm Riftia pachyptila hosts a single 16S rRNA phylotype of intracellular sulfur-oxidizing symbionts, which vary considerably in cell morphology and exhibit a remarkable degree of physiological diversity and redundancy, even in the same host. To elucidate whether multiple metabolic routes are employed in the same cells or rather in distinct symbiont subpopulations, we enriched symbionts according to cell size by density gradient centrifugation. Metaproteomic analysis, microscopy, and flow cytometry strongly suggest that Riftia symbiont cells of different sizes represent metabolically dissimilar stages of a physiological differentiation process: While small symbionts actively divide and may establish cellular symbiont-host interaction, large symbionts apparently do not divide, but still replicate DNA, leading to DNA endoreduplication. Moreover, in large symbionts, carbon fixation and biomass production seem to be metabolic priorities. We propose that this division of labor between smaller and larger symbionts benefits the productivity of the symbiosis as a whole.

Keywords: Riftia pachyptila; cell differentiation; cell heterogeneity; host-microbe interaction; infectious disease; microbiology; sulfur-oxidizing symbiont; symbiosis.


Conflict of interest statement

TH, MK, MM, RS, CH, JP, PH, HF, SS, FB, UV, DB, TS, SM No competing interests declared

Figures

Figure 1.
Figure 1.. CARD-FISH images of Riftia symbiont cells after density gradient centrifugation.
(A) Catalyzed reporter deposition-fluorescence in situ hybridization (CARD-FISH) images of Riftia symbiont cells after density gradient centrifugation of trophosome homogenate. After the enrichment procedure, small bacterial cells had accumulated in the upper, less dense gradient fractions (top), whereas larger symbionts were enriched in the lower, denser fractions (bottom). Left: DAPI staining, right: 16S rRNA signal. For better visibility, brightness and contrast were adjusted in all images. Between 300 and 1300 individual cells were measured per filter (average: 590). (B and C) Symbiont cell size distributions in individual gradient fractions. While all cell size groups were roughly equally abundant in non-enriched trophosome homogenate (Hom), fraction XS had the highest percentage of symbiont cells in the size range 2.0 µm - 3.9 µm, fraction S contained most symbiont cells of 3.9 µm – 5.3 µm, etc. Gradient centrifugation was performed using four biological replicates (n = 4) of sulfur-rich trophosome tissue (B) and three biological replicates (n = 3) of sulfur-depleted trophosome tissue (C). For an overview of which gradient fractions were chosen as fractions XS, S, M, and L in all samples see Supplementary file 1. Dots: individual % values, triangles: average % values. Please note the different scaling of the y axes in B and C.
Figure 2.
Figure 2.. Flow-cytometry-based DNA quantification of Riftia symbionts.
(A) Dot plot of forward scatter (FSC) and side scatter (SSC), and histogram with fluorescence signal counts and fluorescence intensity (FI) per particle of a gradient fraction enriched in smaller symbionts. (B) Gradient fraction enriched in larger symbionts. While cell population 1 was more prominent in (A), population 2 was almost exclusively detected in (B), and both populations were present in non-enriched trophosome homogenate (C), indicating that population 1 corresponds to smaller symbionts, whereas population 2 corresponds to larger symbiont cells. Cells were stained with Syto9 and median fluorescence intensity (MFI) per particle at wave length 530/30 nm was used as a measure of cellular DNA content (see Figure 2—figure supplement 1, Methods, and Supplementary file 6 for more details). This analysis was based on two Riftia specimens with medium sulfur content.
Figure 2—figure supplement 1.
Figure 2—figure supplement 1.. Fluorescence microscopy and fluorescence-activated cell sorting (FACS) of Riftia symbiont cells.
Left: Micrographs (Phase contrast and Syto9 staining), right: Flow cytometry dot plot (FSC: forward scatter, SSC: side scatter) and histogram. To identify symbiont subpopulations of different cell sizes, a set of six individual gradient fractions enriched in large symbiont cells and a set of six gradient fractions enriched in small symbiont cells were examined and compared (note that only one pair of microscopy images and only one of the six dot plot/histogram pairs per sample set are shown). (A) Those fractions that were enriched in small symbiont cells of 2–3 µm in diameter produced dot plots with a highly abundant cell population 1 (encircled in black), which we assumed to be specific for small symbionts. (B) In contrast, gradient fractions enriched in large symbionts of up to 10 µm in diameter produced dot plots in which population 1 was notably less prominent, while a second population (2) was highly abundant. Population 2 was almost completely absent in (A) and therefore presumably specific for large symbionts. (C) Non-enriched trophosome homogenate contained a mixture of cells and particles of different sizes. Both cell populations determined in (A) and (B), presumably indicative of small (1) and large (2) symbionts, were also visible in the homogenate’s dot plot and histogram, which allowed us to measure and compare their respective fluorescence signal intensities. Median fluorescence intensity per particle of population 1 was consistently (throughout all samples) lower than that of population 2, even if cell counts for population 1 were higher than for population 2 (e.g., A, D). The green fluorescent dye Syto9 stains DNA and RNA. After removal of RNA from the samples by RNase treatment we could therefore quantify DNA content in populations 1 and 2 (see Supplementary file 6). (D and E) Sorting of the two populations 1 and 2 from trophosome homogenate and subsequent examination of the resulting sorted cell suspensions by microscopy and flow cytometry confirmed that these two populations are indeed small (D) and large (E) symbiont cells. Trophosome homogenate and gradient fractions used in this analysis originated from two Riftia specimens with medium sulfur content (see Supplementary file 1 for details). Scale bar: 10 µm.
Figure 3.
Figure 3.. Abundance trends of selected Endoriftia proteins of various functions in the four fractions XS to L.
Trends are indicated by color shades from light green (lowest protein abundance across all four fractions) to dark green (highest abundance across all four fractions; note that colors do not allow comparison of protein abundance between proteins). Abundance values in the heat map are based on statistical evaluation of four biological replicates with sulfur-rich trophosomes (for abundance trends of sulfur-depleted samples refer to Figure 3—figure supplement 1 and Appendix section B). Proteins marked with asterisks show statistically significant trends, that is, differences that are consistent across all replicates in S-rich (left asterisk) or S-depleted specimens (right asterisk), or both (two asterisks). White cells indicate that this protein was not detected in this sample or too low abundant to be included in statistical analyses. For an overview of all identified symbiont proteins and their relative abundances and for a summary of protein abundance trends sorted by metabolic category see Supplementary files 2 and 3, respectively. Accession numbers refer to NCBI/JGI entries. SU: subunit, DUF: domain of unknown function, ss: single-stranded, transcr: transcription, assoc: associated, dep: dependent, HP: hypothetical protein, put: putative, oligopep: oligopeptide, ppc: periplasmic component, DHG: dehydrogenase: RubisCO: ribulose-1.5-bisphosphate carboxylase/oxygenase, Ox: oxidase, OxRed: oxidoreductase, PEP: phosphoenolpyruvate, fcc: flavocytochrome c, rhd: rhodanese, resp: respiratory, cat: catalytic, Vit: vitamin and cofactor metabolism.
Figure 3—figure supplement 1.
Figure 3—figure supplement 1.. Abundance trends of selected Endoriftia proteins of various functions in the four fractions XS to L in sulfur-rich (S-rich) and sulfur-depleted (S-depl) Riftia specimens.
Trends are indicated by color shades from light green/light gray (lowest protein abundance across all four fractions) to dark green/dark gray (highest abundance; note that colors do not allow comparison of protein abundance between proteins). Abundance values are based on statistical evaluation of four biological replicates (S-rich) and three biological replicates (S-depl). Proteins marked with asterisks show statistically significant trends, that is, differences that are consistent across all replicates in S-rich or S-depl specimens (or both). White cells indicate that this protein was not detected in this sample or too low abundant to be included in statistical analyses. For an overview of all identified symbiont proteins and their relative abundances and for a summary of protein abundance trends sorted by metabolic category see Supplementary files 2 and 3, respectively. Accession numbers refer to NCBI/JGI entries. SU: subunit, DUF: domain of unknown function, ss: single-stranded, transcr: transcription, assoc: associated, dep: dependent, HP: hypothetical protein, put: putative, oligopep: oligopeptide, ppc: periplasmic component, DHG: dehydrogenase: RubisCO: ribulose-1.5-bisphosphate carboxylase/oxygenase, Ox: oxidase, OxRed: oxidoreductase, PEP: phosphoenolpyruvate, fcc: flavocytochrome c, rhd: rhodanese, resp: respiratory, cat: catalytic, Vit: vitamin and cofactor metabolism.
Figure 4.
Figure 4.. Selected Riftia host proteins with significantly higher relative abundance in the symbiont-enriched fractions XS and S compared to the non-enriched trophosome tissue homogenate (Hom).
Relative abundance trends are indicated by color shades from light blue (lowest protein abundance across the three sample types) to dark blue (highest abundance), based on mean values from four biological replicates with sulfur-rich trophosome. (Note that colors do not allow comparison of protein abundance between proteins). Accession numbers refer to the combined host and symbiont database used for protein identification in this study (see Materials and methods). For a complete list of host proteins with significantly higher abundance in fractions XS and S (compared to Hom) see Supplementary file 4. This comparison includes only the symbiont-enriched fractions XS and S, but not fractions M and L, because these latter fractions were more likely to be contaminated by non-symbiosis-specific host proteins from host tissue fragments pelleted during centrifugation. PG: peptidoglycan.
Figure 5.
Figure 5.. Electron microscopy of Riftia trophosome tissue.
(A) Electron micrograph of a cross-section through a Riftia trophosome lobule. Surrounding an efferent central blood vessel (cB), small symbiont cells (SXS) are visible in bacteriocytes (i.e. symbiont-containing host cells) in the central lobule zone. Symbiont cell size increases toward the periphery of the lobule (SL: large symbiont cells). In the outermost bacteriocytes, symbiont cells are digested by host enzymes (S*). Bacteriocytes are interspersed with smaller blood vessels (B), which facilitate blood flow from the lobule periphery to the lobule center (Felbeck and Turner, 1995). The image was assembled from 50 individual transmission electron micrographs of a trophosome section from a Riftia specimen with sulfur-depleted trophosome. The full resolution image is available as Figure 5—figure supplement 1. Contrast and brightness were adapted. (B) Cell division in small Riftia symbionts in the trophosome lobule center of a Riftia specimen with sulfur-rich trophosome. All micrographs show the same dividing Endoriftia cell in three subsequent tissue sections, revealing that both daughter cells are still connected, but are about to be separated (arrow). Scale bar: 1 µm. Despite thorough screening, we did not observe cell division in large Endoriftia cells in any of the TEM sections. This corroborates the idea that small and large symbiont subpopulations are developmental stages of the same Endoriftia strain.
Figure 5—figure supplement 1.
Figure 5—figure supplement 1.. High-resolution TEM image of the trophosome lobule section shown in Figure 5.
Figure 6.
Figure 6.. Schematic drawing of Riftia symbiont cells inside the trophosome.
(A) An adult tubeworm reaches 2 m in body length. Its symbiont-containing organ, the trophosome (green), fills most of the body cavity (coelomic cavity), and is immersed in coelomic (non-vascular) blood (not shown). (B) Close-up of the lobular trophosome tissue. (C) Single lobule (200–500 µm in diameter) with interior blood vessels (blood-filled spaces) and symbiont cells visible. (D) Cross-section through a trophosome lobule (similar to that in Figure 5A) with small symbiont cells located in the center around an efferent blood vessel. Symbiont cell size increases toward the lobule periphery, where the largest symbionts are digested by the host (curls). Blood flow from lobule periphery to lobule center may cause gradients in nutrient availability. Based on the results of this study, the most striking characteristics of small and large symbionts, which determine their respective roles in the symbiosis, are indicated. Note that this is a simplified illustration, in which the various kinds of host cells (including their membranes, nuclei and organelles), as well as blood vessels or gonads that line the surface of the trophosome were omitted for clarity’s sake. (Illustrations based on drawings, TEM images and descriptions by van der Land and Nørrevang, 1977; Felbeck and Turner, 1995; Bright and Sorgo, 2003).
Appendix 1—figure 1.
Appendix 1—figure 1.. Abundance trends of 465 Riftia symbiont proteins with significant abundance differences between the four analyzed gradient fractions XS (enriched in very small symbiont cells) to L (containing the highest percentage of large symbiont cells) in S-rich and S-depleted Riftia trophosomes.
Heat maps show relative protein abundances (z-scores of edgeR-RLE-corrected spectral count values; see Methods for details) and line graphs indicate trends in the observed differences.
Appendix 1—figure 2.
Appendix 1—figure 2.. Protein stable carbon isotope values (δ13C values) of Riftia gradient fractions enriched in symbionts of different cell size (XS – L) relative to fraction XS of S-rich trophosome as baseline.
Light squares: S-rich symbionts (average values, n = 4), dark triangles: S-depleted symbionts (n = 3). Error bars indicate standard errors of the mean.
Appendix 1—figure 3.
Appendix 1—figure 3.. A gradient fraction enriched in large symbionts (but also containing small symbiont cells) was fixed as for CARD-FISH analysis and incubated with fluorescently labeled RNA probes against the Endoriftia 16S rRNA and the mRNAs of Calvin cycle key enzyme RubisCO and rTCA cycle key enzyme ATP-citrate lyase (subunit AclB) before examination by confocal laser scanning microscopy (CLSM, see Materials and methods).
(A) Background-corrected mean signal intensities per pixel calculated from a total of 33 cells (in eight images on a filter from one biological replicate, n = 1) plotted against cell area (left) and Feret’s diameter of the cell (right). Straight lines indicate the linear between mean pixel intensities and cell size. Average RubisCO mRNA signal intensity increased notably with cell size (orange lines), while AclB signal intensity increased only very slightly (blue lines). (B) CLSM image of Endoriftia cells (the same cells are visible with different fluorophores in the three panels). Supporting the quantitation in (A) and in line with our proteomic results, the RubisCO signal is markedly more intense in large symbiont cells than in small cells, while the AclB signal is very weak and signal intensity differences between large and small cells seem to be minor. Scale bar = 5 µm. Image brightness and contrast were manually adjusted. Hybridizations of several filters from one biological replicate (n = 1) without probes but with fluorophore-carrying hairpins, and without probes or hairpins were used as negative controls and produced no fluorescence signals (images not shown).
Appendix 1—figure 4.
Appendix 1—figure 4.. Energy-generating oxidation of reduced sulfur compounds in Endoriftia.
Proteins in bold were detected in this study. (Figure adapted from Grein et al., 2010; Markert et al., 2011; Rodriguez et al., 2011; Stewart et al., 2011; Dahl et al., 2013; Stockdreher et al., 2014; Weissgerber et al., 2014). As the role of hydrogen as electron donor in the Riftia symbioses was recently questioned (Mitchell et al., 2019), the associated reactions are labeled in gray and with a question mark.
Author response image 1.
Author response image 1.. Blast results of HCR-FISH probes and in silico analysis of their hybridization behaviour.
Four RubisCO-specific probes and five AclB probes were searched against the NCBI whole-genome shotgun (WGS) sequences NZ_AFOC00000000.1 and NZ_AFZB00000000.1, containing the complete genomes of the Riftia pachyptila symbiont and the Tevnia jerochonana symbiont, respectively (both symbionts belong to the same 16S rRNA phylotype; Gardebrecht et al ., 2012). At low stringency settings (BLASTn optimized for “somewhat similar sequences”, seed length: 7, expectation threshold: 1), most probe sequences (queries) had matches (subjects) not only in their respective target genes, but also produced off-target matches of lower % identity (%Id) and with higher numbers of gaps (g) and mismatches (m) in the alignment. All subject sequences were subjected to in silico analyses using the online tool mathFISH at simulated hybridization conditions matching those in our experiments (25% formamide, 45°C, 2 nM probe concentration). As a result, 100% hybridization efficiency was predicted for probe binding to the respective target sequences, whereas binding to off-target matches was calculated with 0% hybridization efficiency. ql: query length; qu start: start of alignment in query; qu end: end of alignment in query; contig numbers beginning with “TevJSym” refer to the the Tevnia symbiont genome assembly, contig numbers beginning with “Rifp1Sym” refer to the Riftia symbiont genome assembly; CDS: complete coding sequence from start to end; product: protein encoded by coding sequence; HybEff CDS: hybridization efficiency of the probe/target pair (probe = query sequence; target = complete CDS of subject).

Similar articles

Cited by

References

    1. Ali BM, Amit R, Braslavsky I, Oppenheim AB, Gileadi O, Stavans J. Compaction of single DNA molecules induced by binding of integration host factor (IHF) PNAS. 2001;98:10658–10663. doi: 10.1073/pnas.181029198. - DOI - PMC - PubMed
    1. Angert ER. DNA replication and genomic architecture of very large bacteria. Annual Review of Microbiology. 2012;66:197–212. doi: 10.1146/annurev-micro-090110-102827. - DOI - PubMed
    1. Ankrah NYD, Wilkes RA, Zhang FQ, Zhu D, Kaweesi T, Aristilde L, Douglas AE. Syntrophic splitting of central carbon metabolism in host cells bearing functionally different symbiotic bacteria. The ISME Journal. 2020;14:1982–1993. doi: 10.1038/s41396-020-0661-z. - DOI - PMC - PubMed
    1. Barabote RD, Johnson OL, Zetina E, San Francisco SK, Fralick JA, San Francisco MJ. Erwinia chrysanthemi tolC is involved in resistance to antimicrobial plant chemicals and is essential for phytopathogenesis. Journal of Bacteriology. 2003;185:5772–5778. doi: 10.1128/JB.185.19.5772-5778.2003. - DOI - PMC - PubMed
    1. Beam CE, Saveson CJ, Lovett ST. Role for radA/sms in recombination intermediate processing in Escherichia coli. Journal of Bacteriology. 2002;184:6836–6844. doi: 10.1128/JB.184.24.6836-6844.2002. - DOI - PMC - PubMed

Publication types

LinkOut - more resources