Observational Study
. 2021 Jun 15;203(12):1556-1565.
doi: 10.1164/rccm.202007-2686OC.

Antigen-Specific T-Cell Activation Distinguishes between Recent and Remote Tuberculosis Infection

Collaborators, Affiliations
Observational Study

Antigen-Specific T-Cell Activation Distinguishes between Recent and Remote Tuberculosis Infection

Cheleka A M Mpande et al. Am J Respir Crit Care Med. .

Abstract

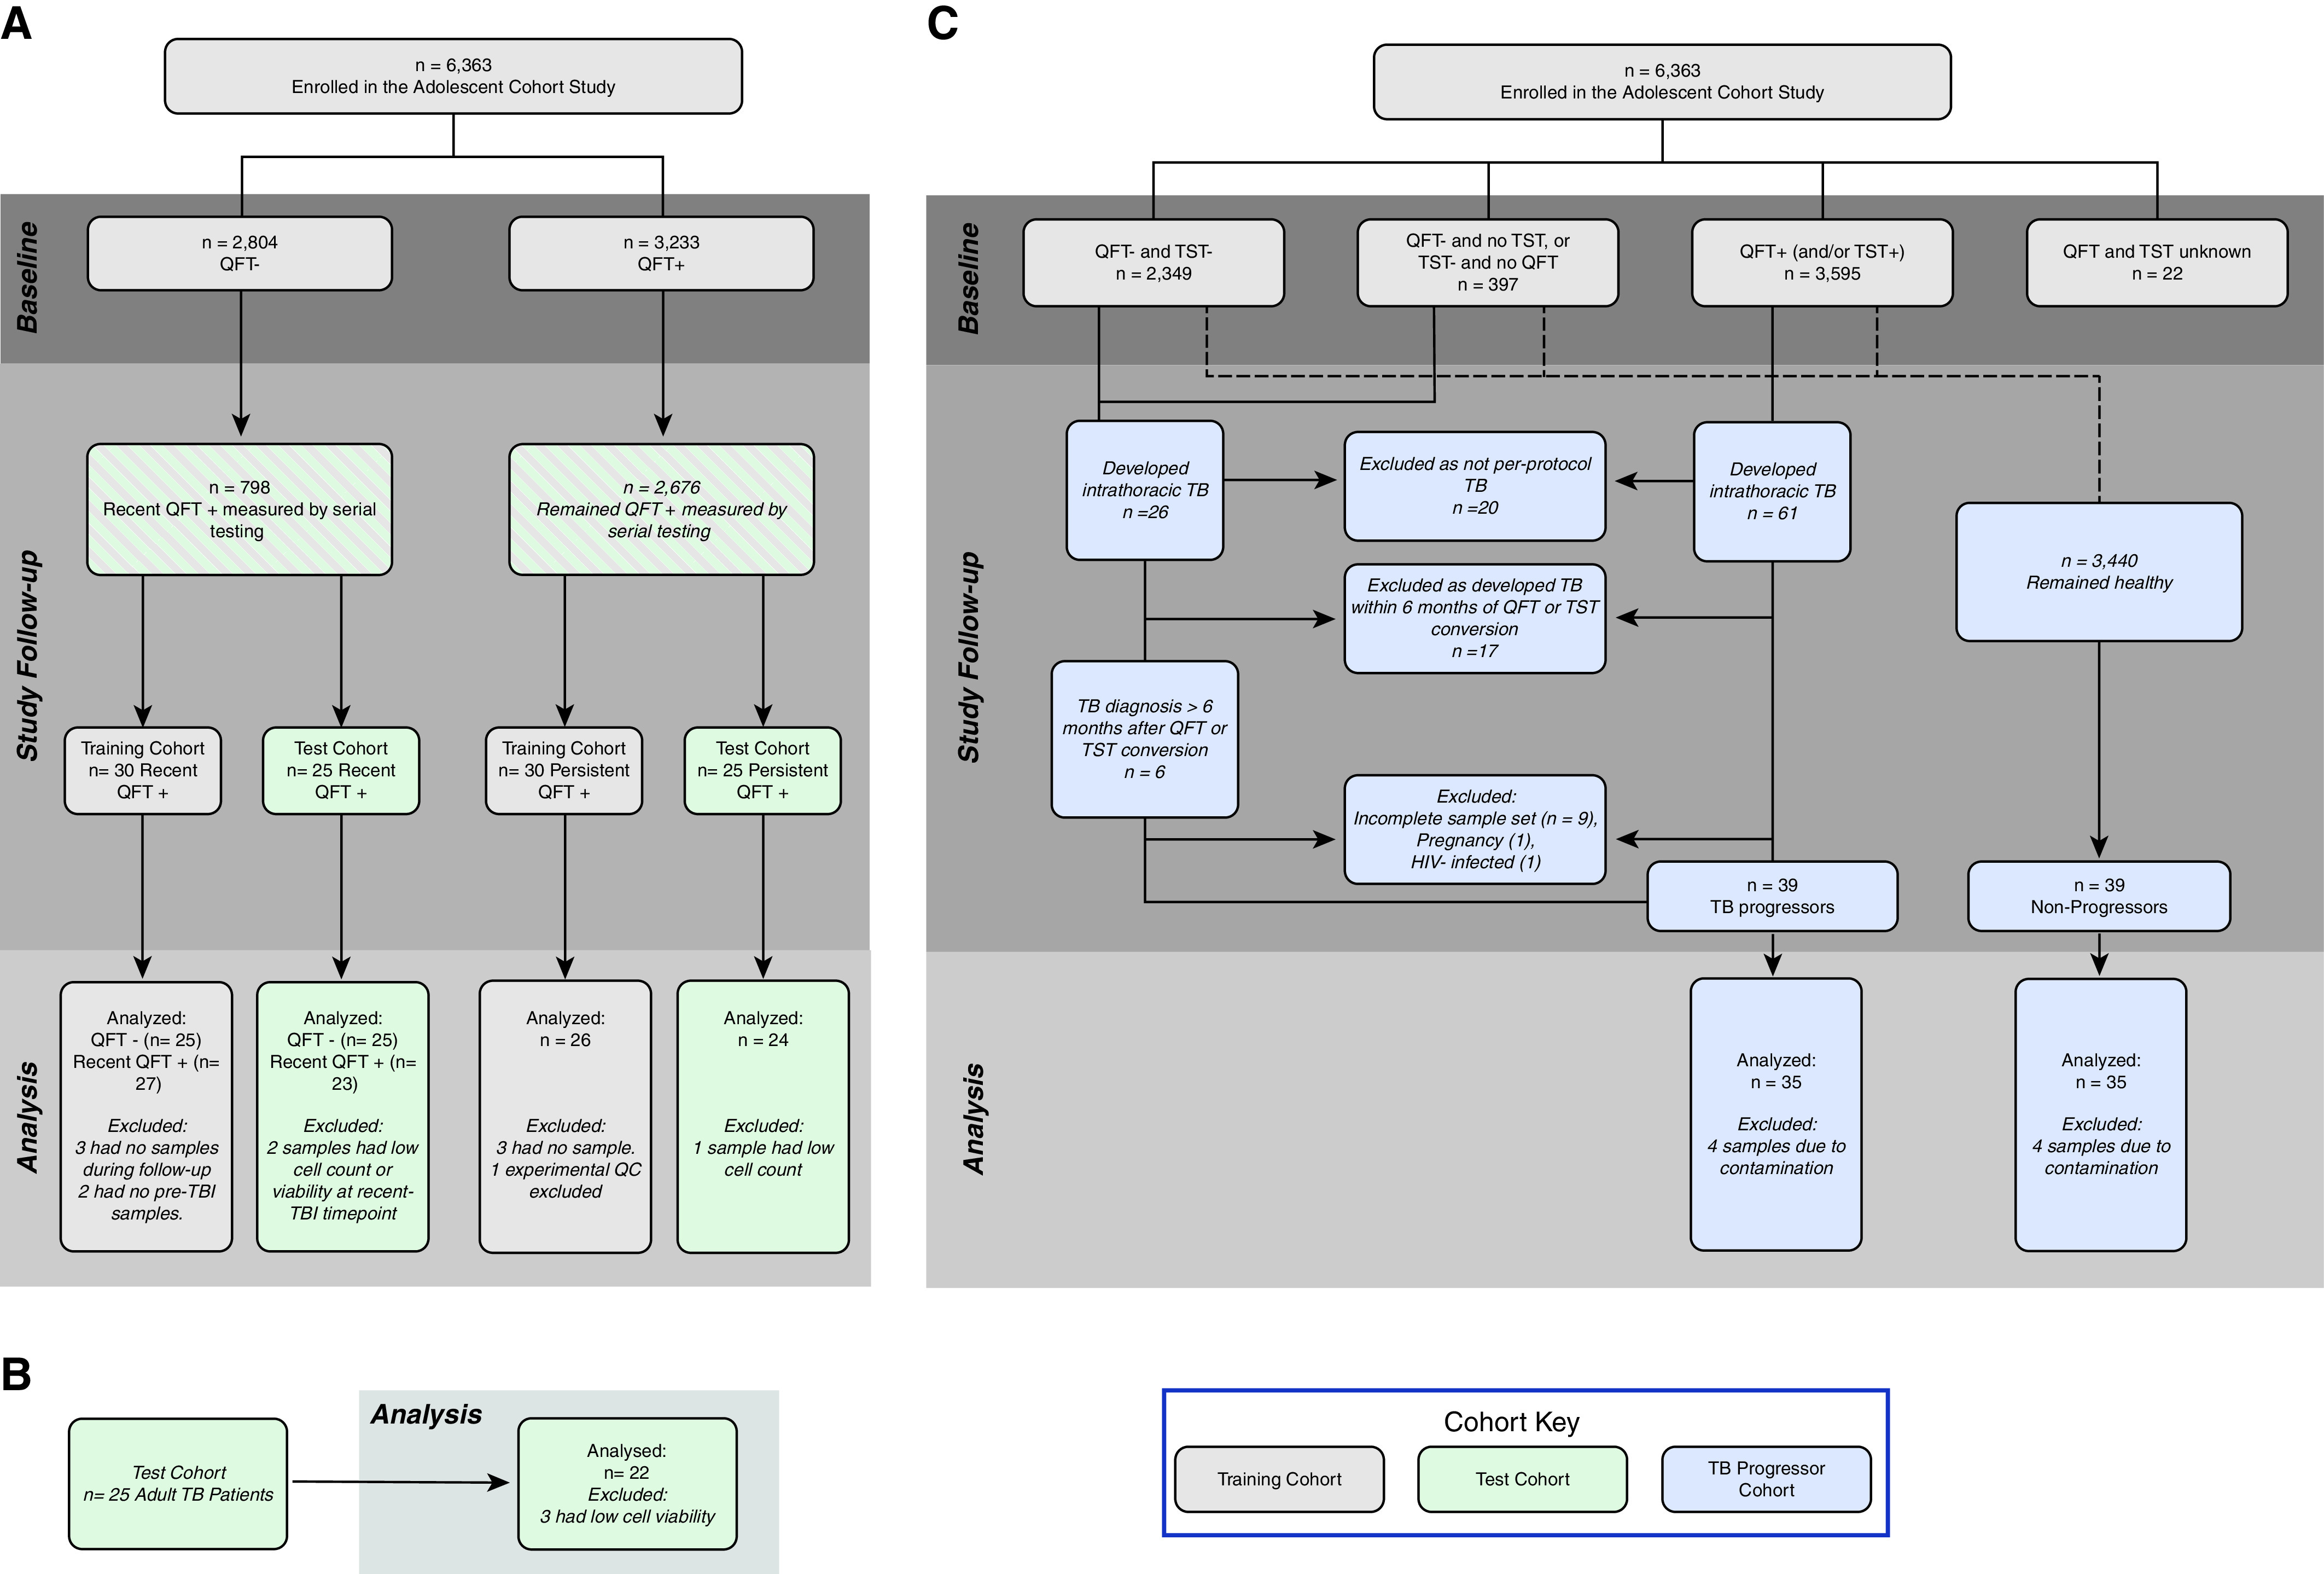
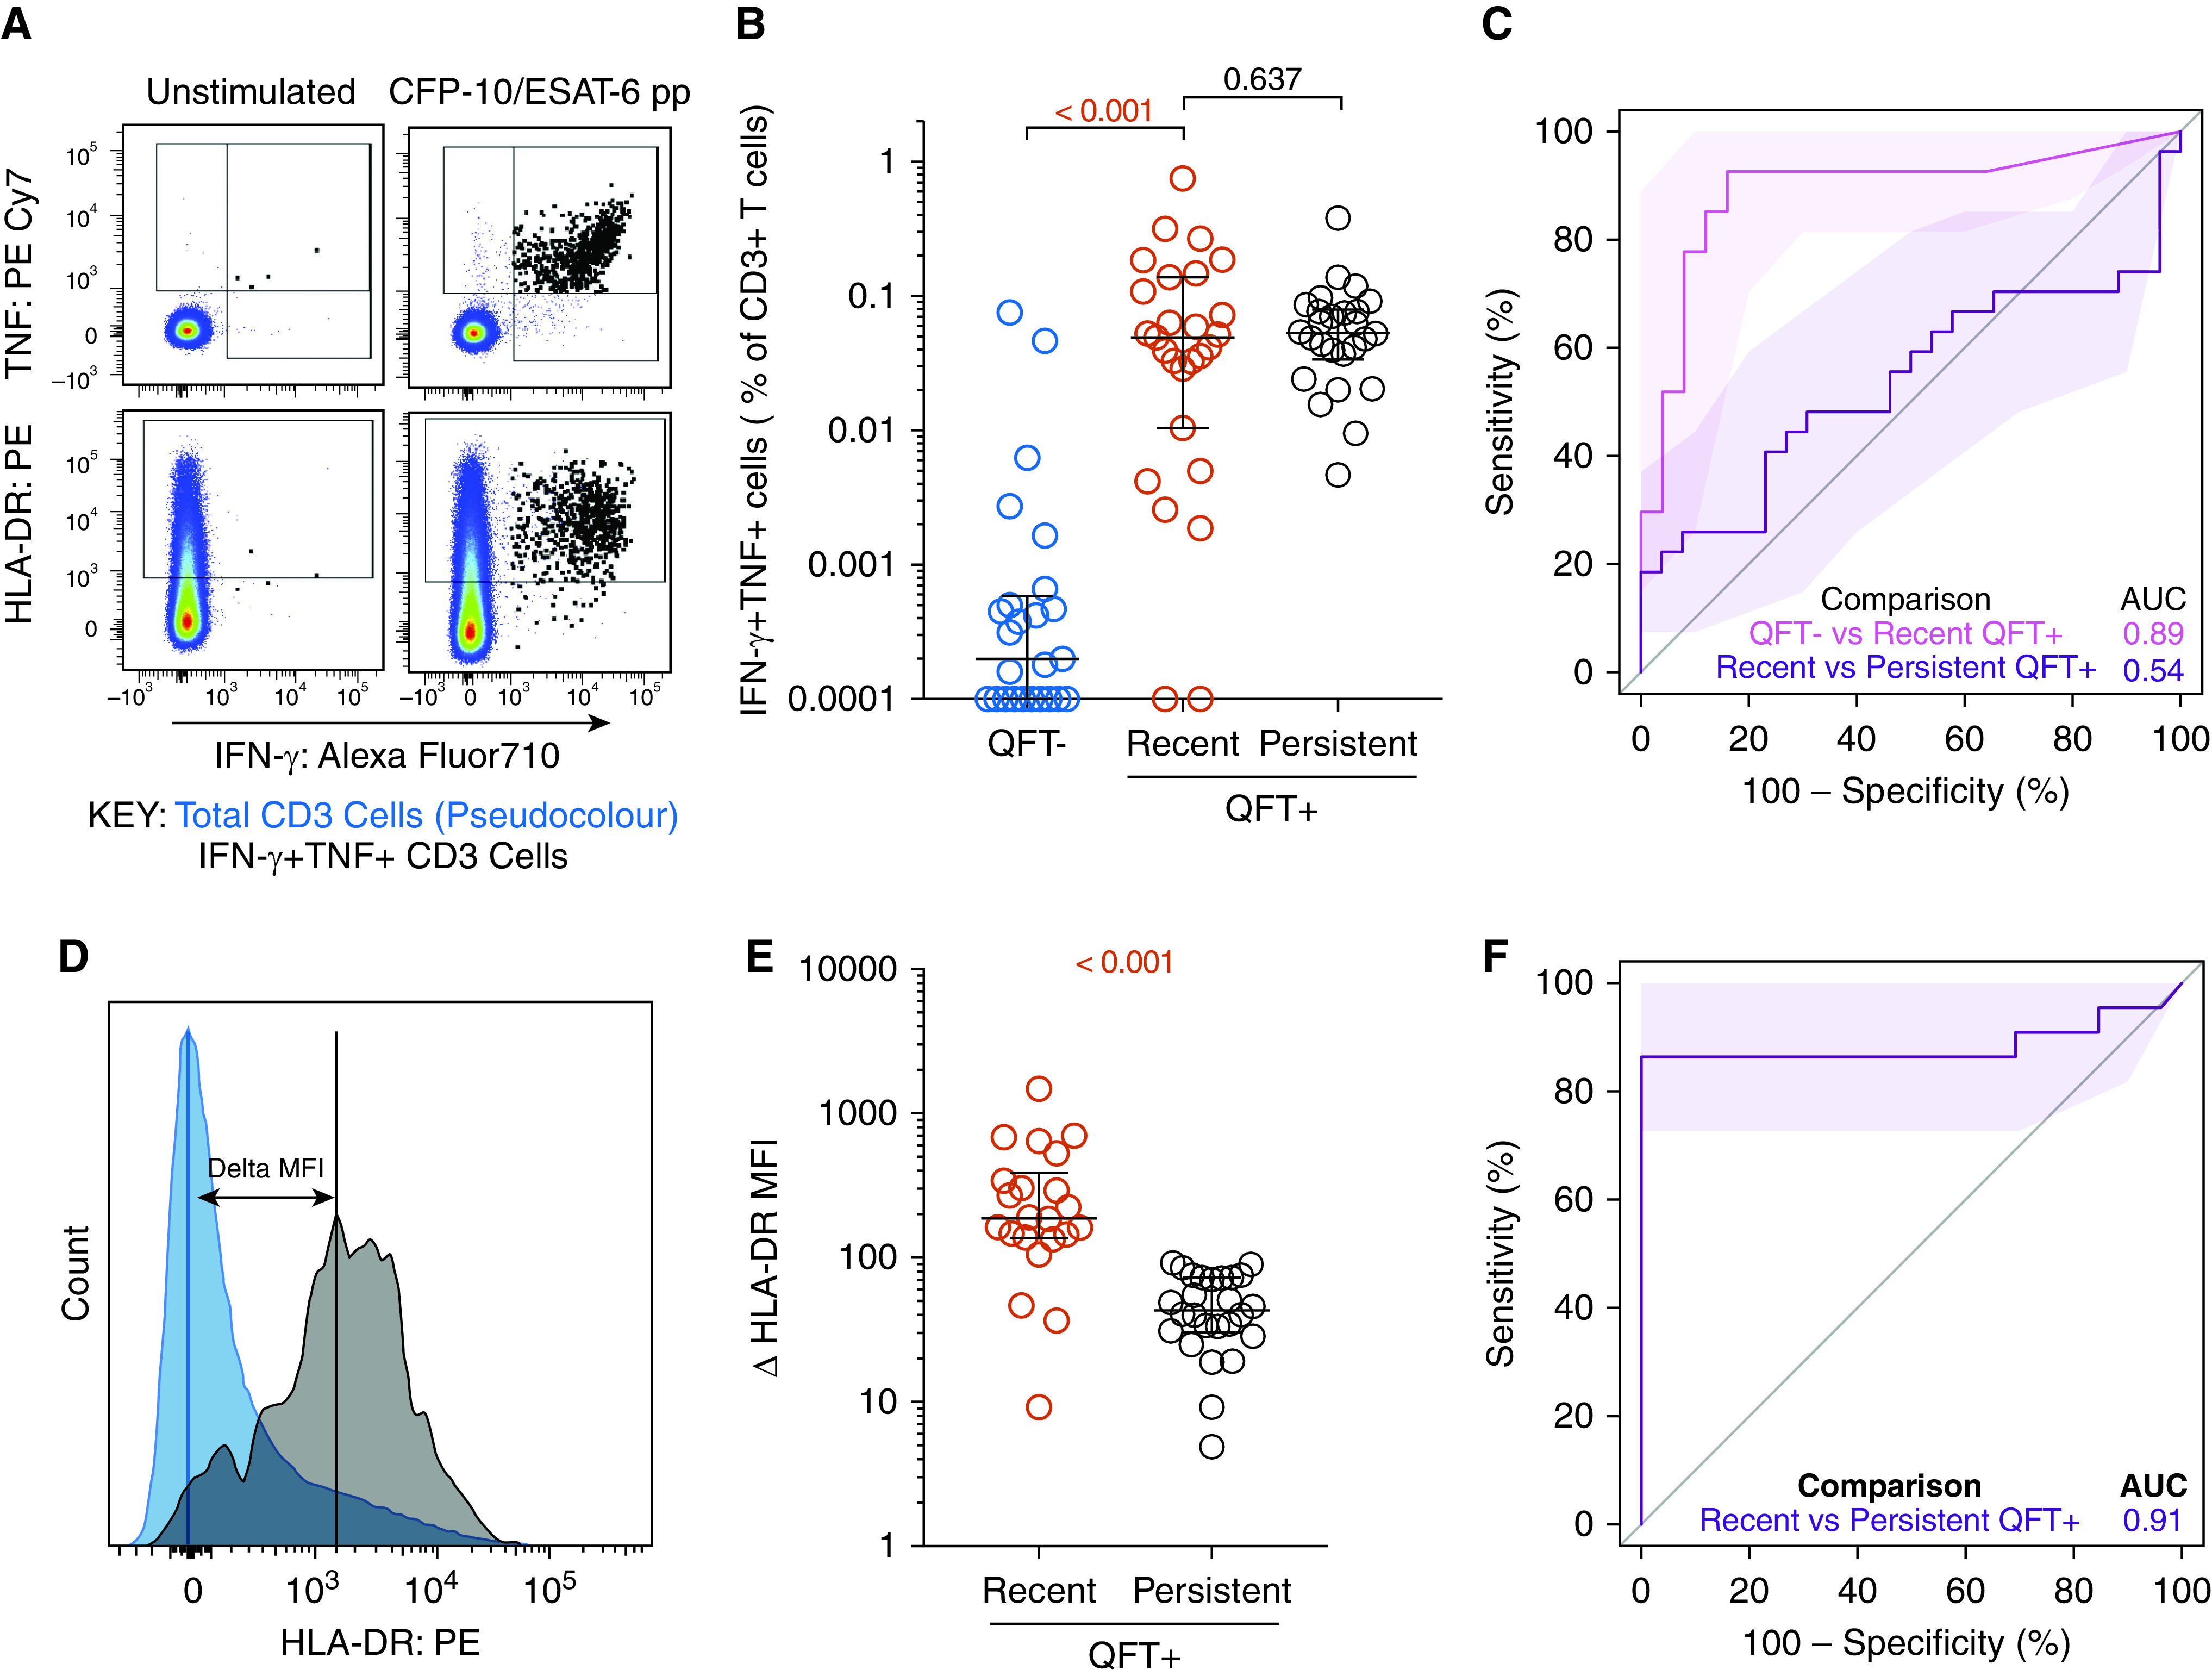
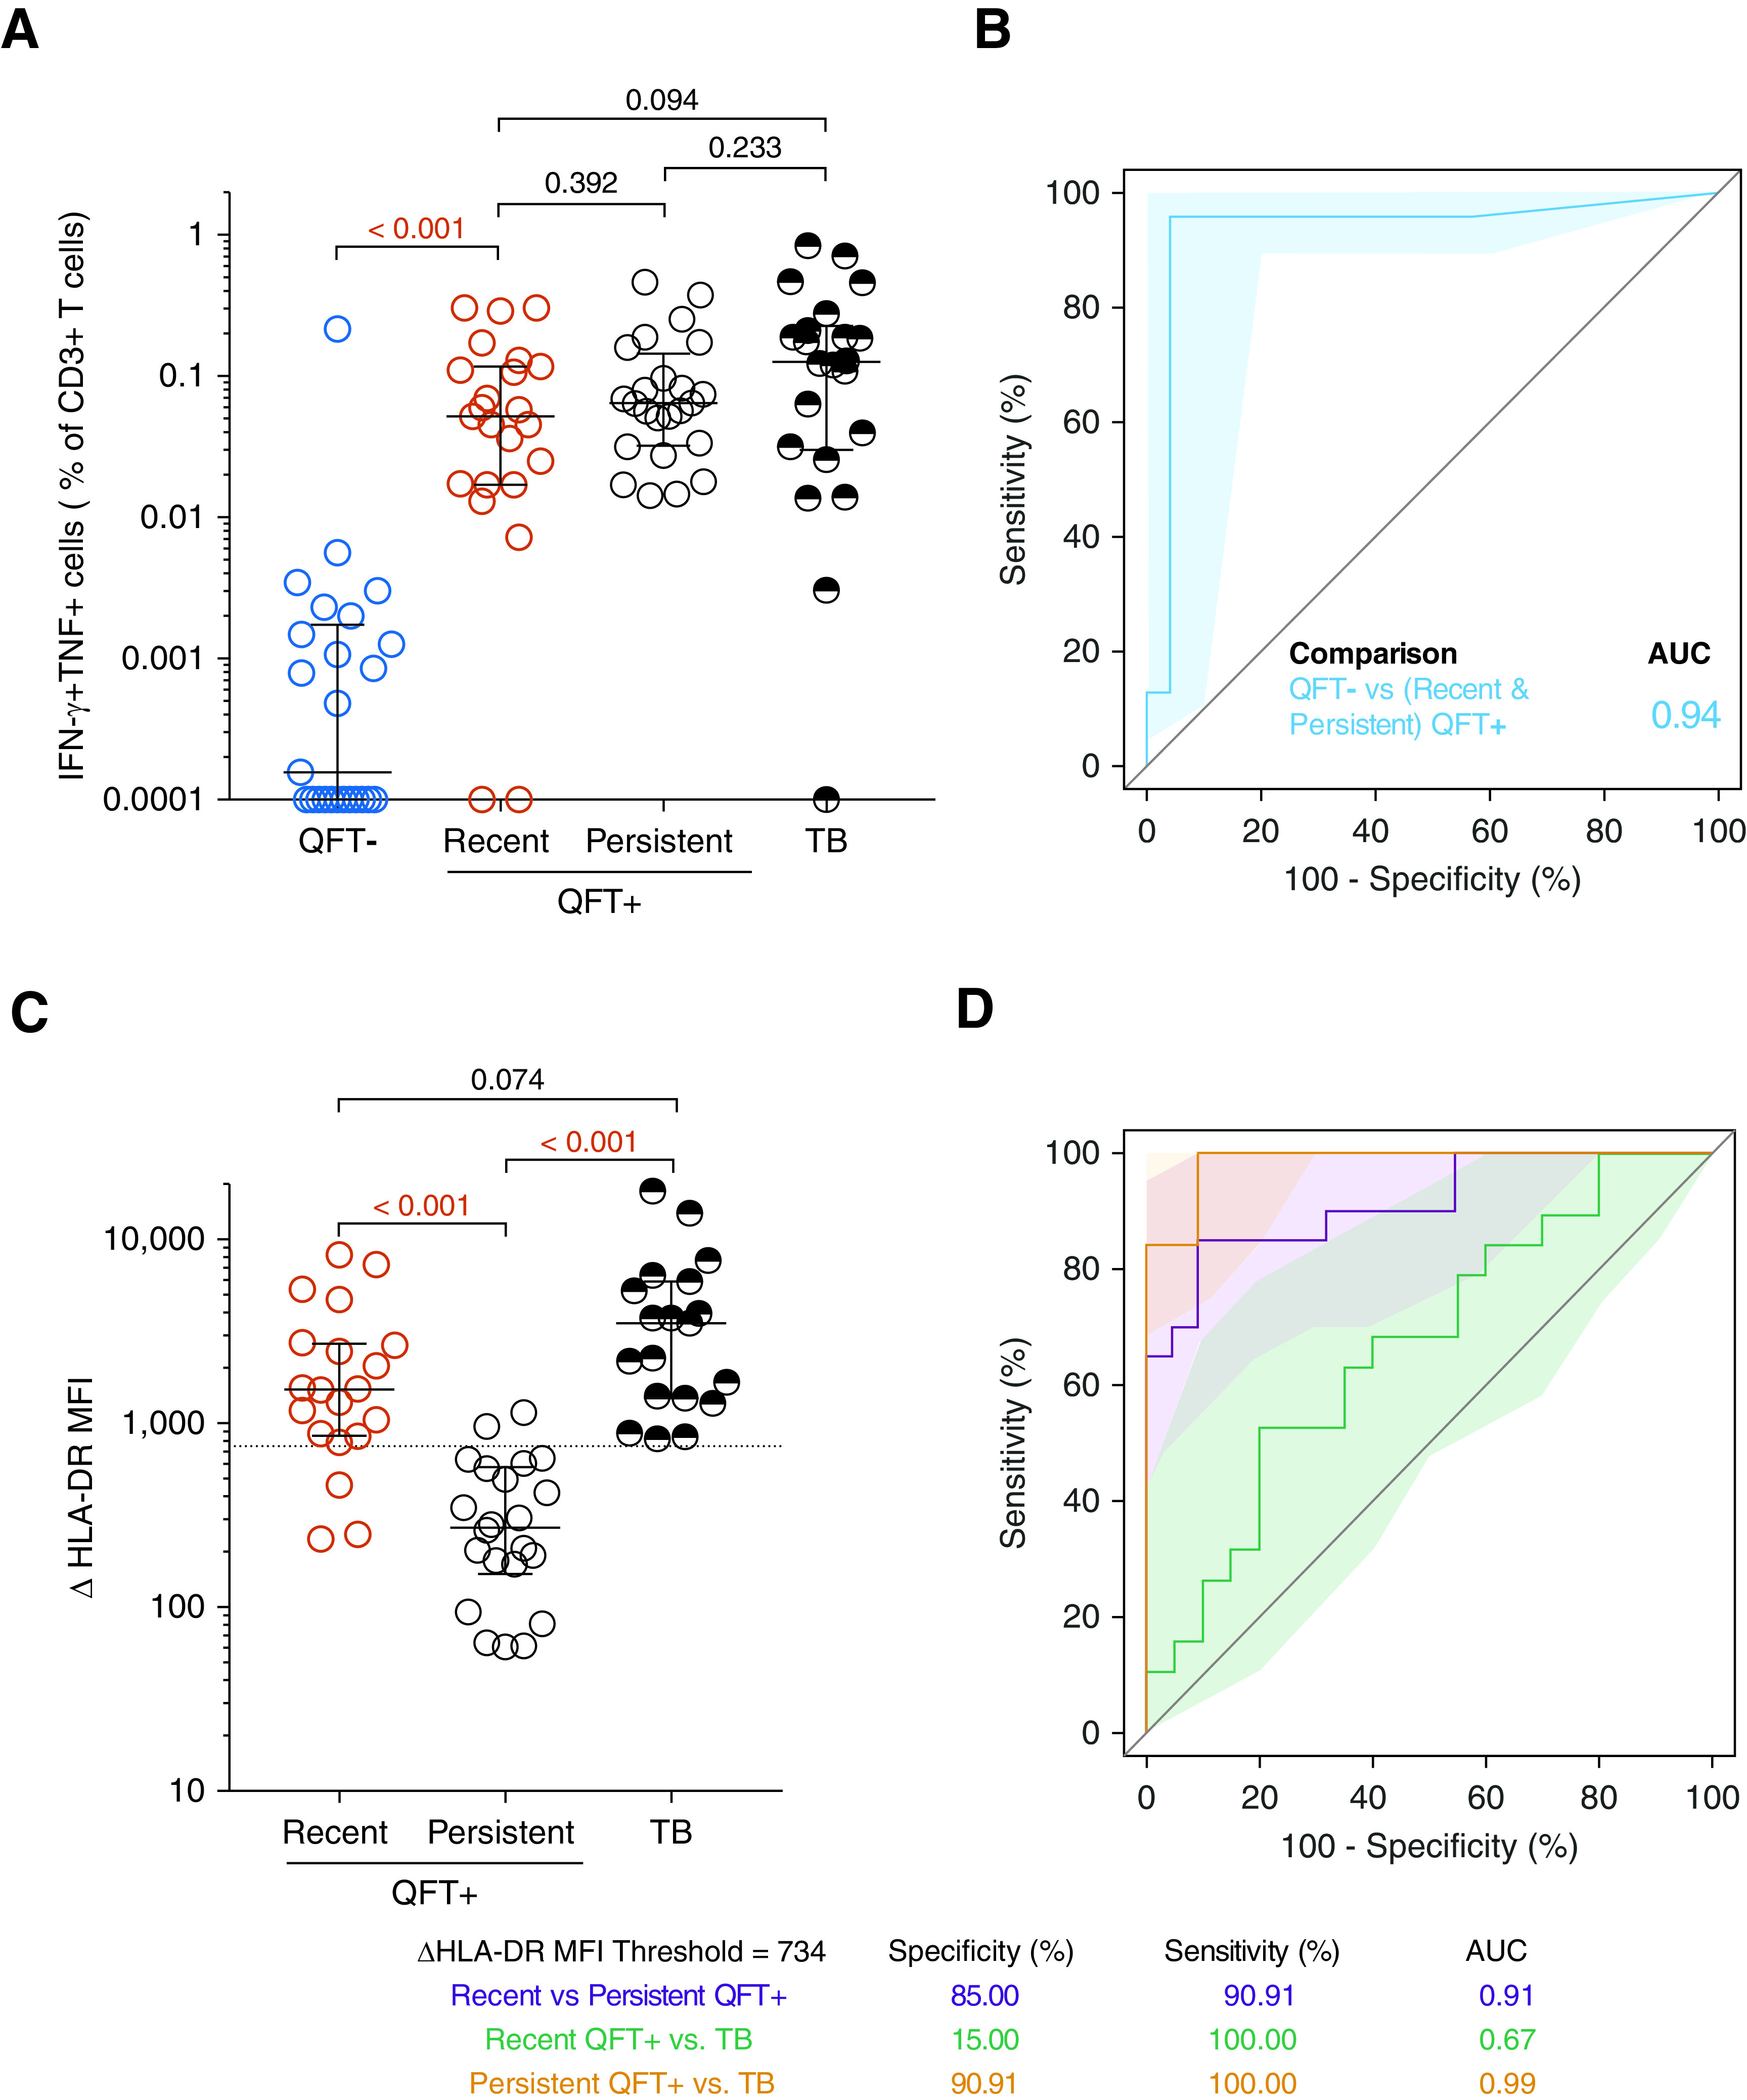
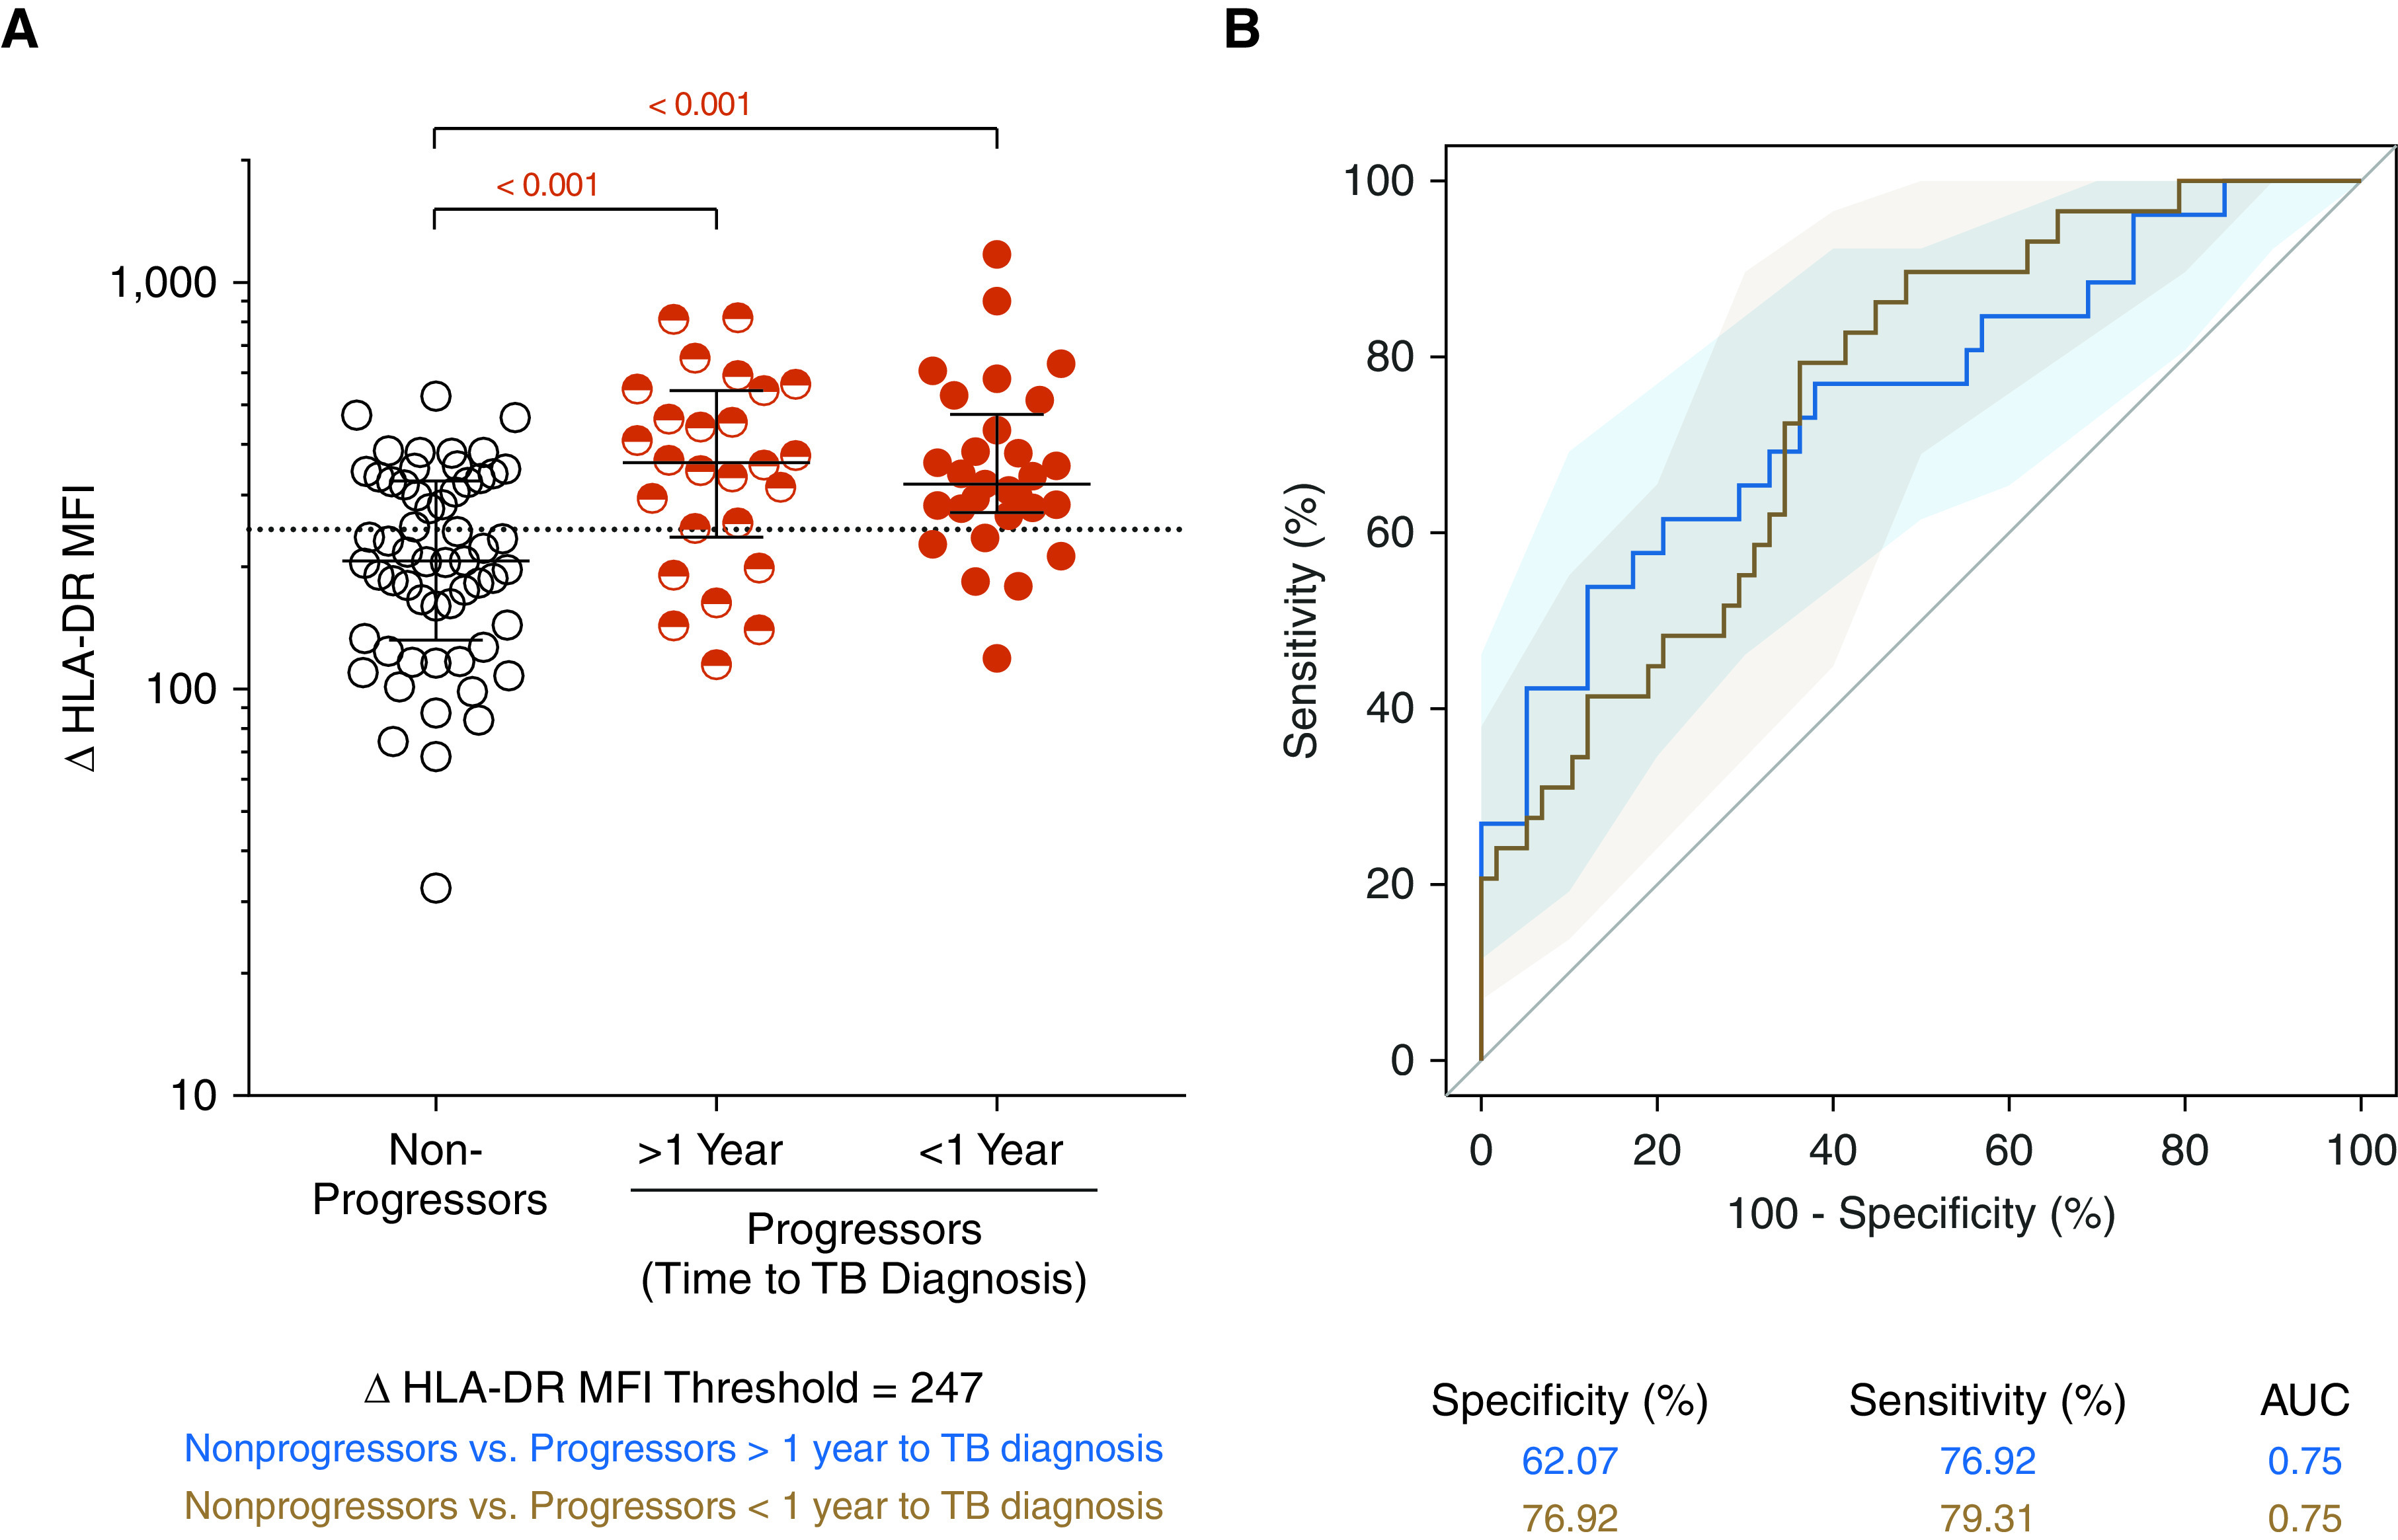
Rationale: Current diagnostic tests fail to identify individuals at higher risk of progression to tuberculosis disease, such as those with recent Mycobacterium tuberculosis infection, who should be prioritized for targeted preventive treatment. Objectives: To define a blood-based biomarker, measured with a simple flow cytometry assay, that can stratify different stages of tuberculosis infection to infer risk of disease. Methods: South African adolescents were serially tested with QuantiFERON-TB Gold to define recent (QuantiFERON-TB conversion <6 mo) and persistent (QuantiFERON-TB+ for >1 yr) infection. We defined the ΔHLA-DR median fluorescence intensity biomarker as the difference in HLA-DR expression between IFN-γ+ TNF+Mycobacterium tuberculosis-specific T cells and total CD3+ T cells. Biomarker performance was assessed by blinded prediction in untouched test cohorts with recent versus persistent infection or tuberculosis disease and by unblinded analysis of asymptomatic adolescents with tuberculosis infection who remained healthy (nonprogressors) or who progressed to microbiologically confirmed disease (progressors). Measurements and Main Results: In the test cohorts, frequencies of Mycobacterium tuberculosis-specific T cells differentiated between QuantiFERON-TB- (n = 25) and QuantiFERON-TB+ (n = 47) individuals (area under the receiver operating characteristic curve, 0.94; 95% confidence interval, 0.87-1.00). ΔHLA-DR significantly discriminated between recent (n = 20) and persistent (n = 22) QuantiFERON-TB+ (0.91; 0.83-1.00); persistent QuantiFERON-TB+ and newly diagnosed tuberculosis (n = 19; 0.99; 0.96-1.00); and tuberculosis progressors (n = 22) and nonprogressors (n = 34; 0.75; 0.63-0.87). However, ΔHLA-DR median fluorescent intensity could not discriminate between recent QuantiFERON-TB+ and tuberculosis (0.67; 0.50-0.84). Conclusions: The ΔHLA-DR biomarker can identify individuals with recent QuantiFERON-TB conversion and those with disease progression, allowing targeted provision of preventive treatment to those at highest risk of tuberculosis. Further validation studies of this novel immune biomarker in various settings and populations at risk are warranted.

Keywords: QuantiFERON-TB Gold; biomarker; recent tuberculosis infection; tuberculosis infection; tuberculosis risk.


Figures

Figure 1.
Figure 1.
Study design. Adolescent participants were selected on the basis of peripheral blood mononuclear cell sample availability from a larger epidemiological study, the Adolescent Cohort Study (10). (A) Inclusions and exclusions for recent and remote QFT+ individuals in the training and test cohorts. (B) Adults with tuberculosis diagnosis sampled cross-sectionally (40). (C) Reasons for inclusion and exclusion of participants in progressor and nonprogressor cohorts. QC = quality control; QFT = QuantiFERON-TB Gold; TB = tuberculosis; TBI = tuberculosis infection; TST = tuberculin skin test.
Figure 2.
Figure 2.
Recent QuantiFERON-TB Gold (QFT)+ conversion is associated with higher T-cell activation than persistent QFT+ results. (A) Representative flow cytometry plots depicting IFN-γ, TNF, and HLA-DR expression in CD3+ T cells. IFN-γ+ TNF+ and total CD3+ T cells are depicted by black and pseudocolor dots, respectively. (B) Frequencies of background subtracted CFP-10/ESAT-6–specific IFN-γ+ TNF+ CD3+ T cells detected before (QFT−; blue; n = 25) and after (recent QFT+; red; n = 27) infection, and in persistent QFT+ (black; n = 26) individuals in the training cohort. (C) Area under the receiver operating characteristic curve (AUROC) showing performance of CFP-10/ESAT-6–specific IFN-γ+ TNF+ CD3+ T cells to discriminate between QFT− and recent QFT+ individuals and between recent and persistent QFT+ individuals. (D) Representative flow cytometry histogram overlay of HLA-DR expression levels by IFN-γ+ TNF+ CD3+ T cells (black) and total CD3+ T cells (blue) and how ΔHLA-DR median fluorescent intensity (MFI) is calculated. (E) ΔHLA-DR MFI in recent (n = 22) and persistent (n = 26) QFT+ responders in the training cohort. (F) Performance of ΔHLA-DR MFI to discriminate between recent and persistent QFT+ individuals. P values were calculated using the Wilcoxon signed-rank test for paired (QFT− vs. recent QFT+) or Mann-Whitney U test for unpaired (recent vs. persistent QFT+) comparisons. Where appropriate, we corrected for multiple comparison as described in the Methods. P values highlighted in red are considered significant. Shaded areas in AUROC plots depict 95% confidence intervals. Values <0.0001 were set to 0.0001 to allow display on a logarithmic scale. AUC = area under the curve; pp = peptide pool.
Figure 3.
Figure 3.
T-cell activation biomarker can distinguish between recent and persistent QuantiFERON-TB Gold (QFT)+ individuals as well as between persistent QFT+ individuals and individuals with tuberculosis (TB). (A) Frequencies of background subtracted CFP-10/ESAT-6–specific IFN-γ+ TNF+ CD3+ T cells detected before (QFT−; blue; n = 25) and after (recent QFT+; red; n = 23) QFT conversion, during persistent QFT+ (black open symbols, n = 24), and in patients with TB (black half-filled symbols; n = 22) in the test cohort. (B) Area under the receiver operating characteristic curve (AUROC) analysis illustrating the performance of CFP-10/ESAT-6–specific IFN-γ+ TNF+ CD3+ T cells to distinguish between samples taken before (QFT−) and after QFT conversion (recent or persistent QFT+ combined). (C) ΔHLA-DR median fluorescent intensity (MFI) in responders with recent QFT+ conversion (n = 20), persistent QFT+ results (n = 22), or TB (n = 19). (D) AUROC analysis depicting the performance of ΔHLA-DR MFI to discriminate between recent and persistent QFT+, between recent QFT+ and TB and between persistent QFT+ and TB. P values were calculated using the Wilcoxon signed-rank test for paired (QFT− vs. recent QFT+) or the Mann-Whitney U test for unpaired (all other) comparisons. Where appropriate, we corrected for multiple comparisons as described in the Methods. P values highlighted in red are considered significant. Shaded areas in AUROC plots depict 95% confidence intervals. Values <0.0001 were set to 0.0001 to allow display on a logarithmic scale. AUC = area under the curve.
Figure 4.
Figure 4.
Mycobacteria-specific T cells in tuberculosis (TB) progressors are more activated than those in nonprogressors. (A) ΔHLA-DR median fluorescent intensity (MFI) on Mycobacterium tuberculosis lysate–responsive T cells coexpressing IFNG and TNF mRNA transcripts in nonprogressors (n = 58 longitudinal data points from 34 participants) and progressors (in samples collected >1 yr before TB diagnosis [>1 yr, n = 26 longitudinal data points from 19 participants] or in samples collected within 1 yr of tuberculosis diagnosis [<1 yr, n = 29 longitudinal data points from 22 participants]). P values were computed by Mann-Whitney U test and were corrected for two comparisons as described in the Methods. (B) Area under the receiver operating characteristic curve depicting the performance of ΔHLA-DR MFI to discriminate between nonprogressors and progressors in samples collected >1 year before TB or within 1 year of TB diagnosis. AUC = area under the curve.

Comment in

References

    1. World Health Organization 2020https://www.who.int/tb/publications/global_report/en/.
    1. World Health Organization 2020https://www.who.int/publications-detail/who-consolidated-guidelines-on-t....
    1. Erkens CGM, Slump E, Verhagen M, Schimmel H, Cobelens F, van den Hof S. Risk of developing tuberculosis disease among persons diagnosed with latent tuberculosis infection in the Netherlands. Eur Respir J. 2016;48:1420–1428. - PubMed
    1. Reichler MR, Khan A, Sterling TR, Zhao H, Chen B, Yuan Y, et al. Tuberculosis Epidemiologic Studies Consortium Task Order 2 Team. Risk factors for tuberculosis and effect of preventive therapy among close contacts of persons with infectious tuberculosis. Clin Infect Dis. 2020;70:1562–1572. - PMC - PubMed
    1. Cohen A, Mathiasen VD, Schön T, Wejse C. The global prevalence of latent tuberculosis: a systematic review and meta-analysis. Eur Respir J. 2019;54:1900655. - PubMed

Publication types

Substances