. 2021 Jan 6;17(1):e1007623.
doi: 10.1371/journal.pcbi.1007623. eCollection 2021 Jan.

Improving probabilistic infectious disease forecasting through coherence

Affiliations

Improving probabilistic infectious disease forecasting through coherence

Graham Casey Gibson et al. PLoS Comput Biol. .

Abstract

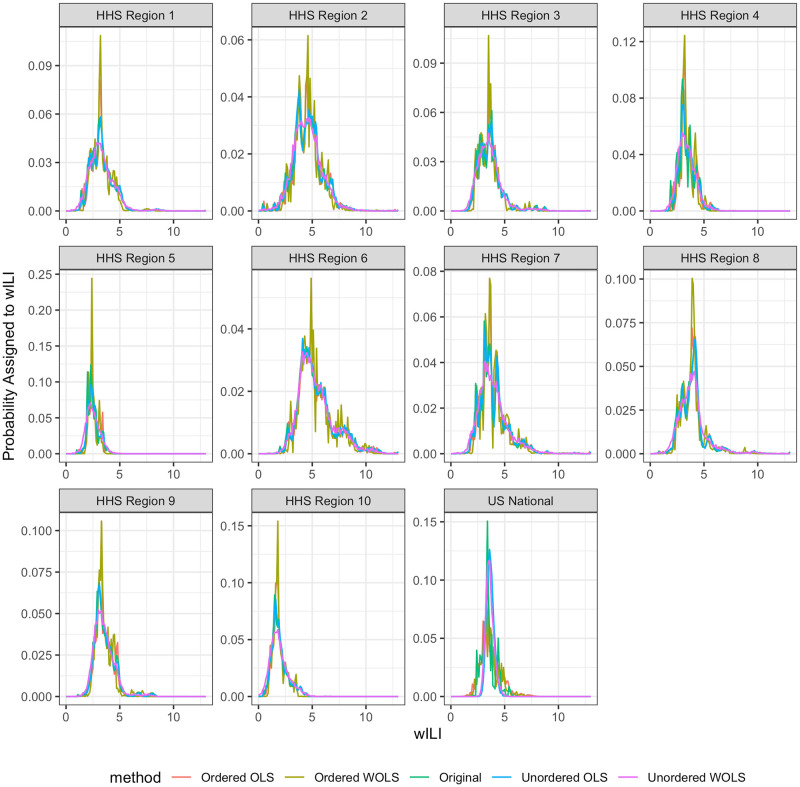
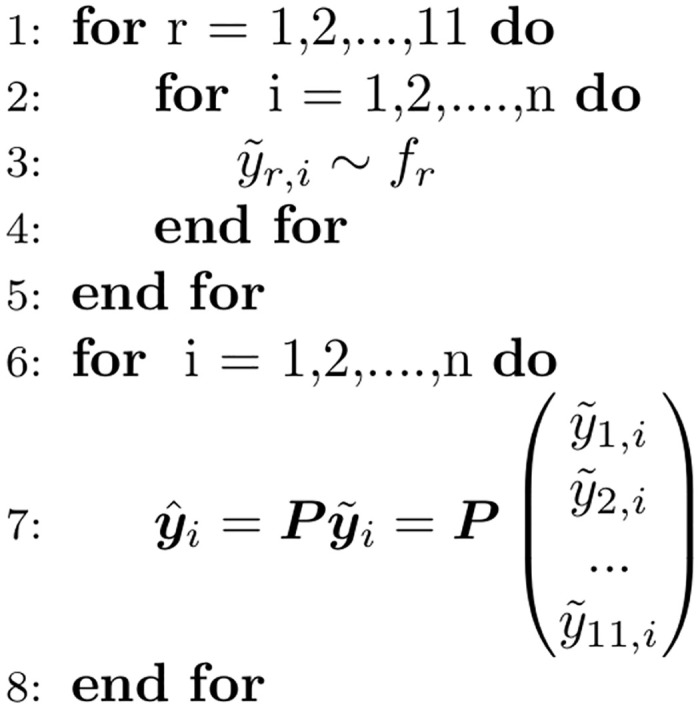
With an estimated $10.4 billion in medical costs and 31.4 million outpatient visits each year, influenza poses a serious burden of disease in the United States. To provide insights and advance warning into the spread of influenza, the U.S. Centers for Disease Control and Prevention (CDC) runs a challenge for forecasting weighted influenza-like illness (wILI) at the national and regional level. Many models produce independent forecasts for each geographical unit, ignoring the constraint that the national wILI is a weighted sum of regional wILI, where the weights correspond to the population size of the region. We propose a novel algorithm that transforms a set of independent forecast distributions to obey this constraint, which we refer to as probabilistically coherent. Enforcing probabilistic coherence led to an increase in forecast skill for 79% of the models we tested over multiple flu seasons, highlighting the importance of respecting the forecasting system's geographical hierarchy.


Conflict of interest statement

The authors have declared that no competing interests exist.

Figures

Fig 1
Fig 1. Data example for the three test seasons under consideration (2016/2017, 2017/2018, 2018/2019) season for all 10 Health and Human Services (HHS) regions and the national level.
At any given epiweek, the national wILI (black) is a weighted sum of regional wILI, where the weights correspond to the population size of the region. We can see that wILI is highly seasonal and varies heavily by region. Region population sizes (in millions) are given next to the region in the legend.
Fig 2
Fig 2. Mock example of independent forecasts (red) and projected forecasts (blue) for three regions, National, HHS1 and HHS2.
Both the blue and the red point represent a triple of ILI forecast values for each region. Independent forecasts are projected onto the space satisfying the constraint of regional level forecasts summing to national level. The blue plane represents the set of points that satisfy the coherence constraint, namely that the weighted combination of region-level forecasts equals the National level forecast. Different projection matrices are able to map the red point to the blue point at different locations on the blue plane.
Fig 3
Fig 3. Graphical example of how mean squared error (MSE) can decrease while skill gets worse for two region example.
A: Purple histograms represent the 10,000 realizations of y˜, while green histograms are the corresponding y^s. The purple and green points illustrate a particular example of the projection matrix forecasting process. The solid vertical lines denote the true value for each region. B: Top panel shows distribution of MSE for y˜ minus corresponding MSE for y^. MSE for y˜ is greater than the MSE for y^ for all realizations. B: Bottom panel shows single-bin skill score for y˜ minus skill score for y^. The incoherent y˜ forecasts are better or equal to the skill for the coherent forecasts for all iterations, with an average improvement greater than 0. This shows the the MSE of the coherent forecasts has decreased (since the difference between the original and projected is positive) and the forecast skill has decreased (since the difference between the original and projected is again positive). Since a decrease in MSE means an improvement and a decrease in forecast skill means a lack of improvement, we see that coherence can have opposite effects on the two scores.
Fig 4
Fig 4. Real data example of model predictive densities for the 1 week ahead target on epiweek 201901 for the 2018/2019 season across all 11 regions.
The y-axis represents the probability density for a given wILI bin value on the x-axis. Notice how the regional samples do not change much under the coherence constraint, but the national forecasts noticeably change. We can also see variable levels of density “smoothing” produced by each method, with the greatest amount of smoothing under the Unordered weighted ordinary least squares (WOLS) method. This smoothing of forecast density also lowers the magnitude of the peak density across all HHS regions, but increases the magnitude of the peak in the nation. However, the overall location of the forecast density remains consistent across all projection methods.
Fig 5
Fig 5. Unordered OLS sampling from probabilistically coherent joint distribution given a collection of marginal distributions.
Note that the corresponding weighted ordinary least squares (WOLS) method is obtained by replacing P with Pw.
Fig 6
Fig 6. Ordered OLS sampling from probabilistically coherent joint distribution given a collection of marginal distributions.
Note that the corresponding WOLS method is obtained by replacing P with PV.
Fig 7
Fig 7. Best performing method under single-bin (left) and mutli-bin (right) in terms of forecast skill averaged over all targets (1-4 week ahead), regions (HHS1-10 & National) and broken down by model-season combination.
The y-axis represents a unique season model combination which has been made anonymous to protect participant teams identity.
Fig 8
Fig 8. Difference between single-bin forecast skill of projection method and forecast skill of independent forecasts averaged over all regions and epiweeks broken down by target (left), season (right), and region (bottom).
Each point represents a single model-season combination. Box-whisker forecasts and represent the inter-quartile range as well as the maximum and minimum in forecast skill difference between projected method and independent forecasts. The improvements in single-bin forecast skill are consistent across season and target for the unordered WOLS. However, the improvements are only consistent across the HHS regions, not the national region.
Fig 9
Fig 9. Average variance of forecasts, averaged over season, epiweek, target, and model.
Notice that the unordered WOLS increases the variance across HHS regions, which is reflected in the improvements under single-bin scoring. However, the variance of the unordered WOLS decreases at the national level, which is also the only region without significant benefit under single-bin scoring. The optimal model under multi-bin scoring (ordered OLS) retains the same variance of the original forecast distribution for the HHS regions, but slightly increases the variance slightly for the nation. This demonstrates the effect of the scoring has on projection method choice.

References

    1. Lafond KE, Nair H, Rasooly MH, Valente F, Booy R, Rahman M, et al. Global role and burden of influenza in pediatric respiratory hospitalizations, 1982–2012: a systematic analysis. PLoS medicine. 2016;13(3):e1001977 10.1371/journal.pmed.1001977 - DOI - PMC - PubMed
    1. Reed C, Chaves SS, Kirley PD, Emerson R, Aragon D, Hancock EB, et al. Estimating influenza disease burden from population-based surveillance data in the United States. PLOS one. 2015;10(3):e0118369 10.1371/journal.pone.0118369 - DOI - PMC - PubMed
    1. McGowan CJ, Biggerstaff M, Johansson M, Apfeldorf KM, Ben-Nun M, Brooks L, et al. Collaborative efforts to forecast seasonal influenza in the United States, 2015–2016. Scientific reports. 2019;9(1):683 10.1038/s41598-018-36361-9 - DOI - PMC - PubMed
    1. McGowan CJ, Bifferstaff M, Johansson M, Apfeldorf KM, Ben-Nun M, Brooks L, et al. Results from the second year of a collaborative effort to forecast influenza seasons in the United States. Epidemics. 2018;24:26–33. 10.1016/j.epidem.2018.02.003 - DOI - PMC - PubMed
    1. Thompson M, Shay D, Zhou H, Bridges C, Cheng P, Burns E, et al. Estimates of deaths associated with seasonal influenza-United States, 1976-2007. Morbidity and Mortality Weekly Report. 2010;59(33):1057–1062. - PubMed

Publication types