

Assessment of two DNA extraction kits for profiling poultry respiratory microbiota from multiple sample types
- PMID: 33406075
- PMCID: PMC7787465
- DOI: 10.1371/journal.pone.0241732
Assessment of two DNA extraction kits for profiling poultry respiratory microbiota from multiple sample types
Abstract
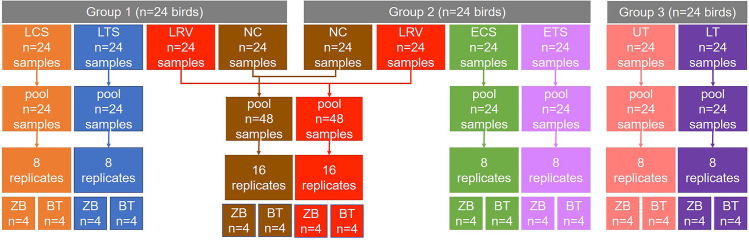
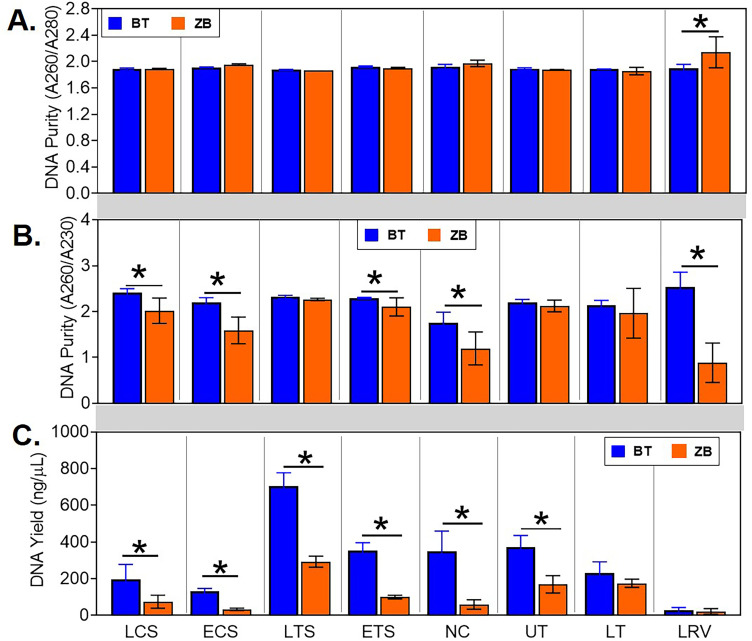
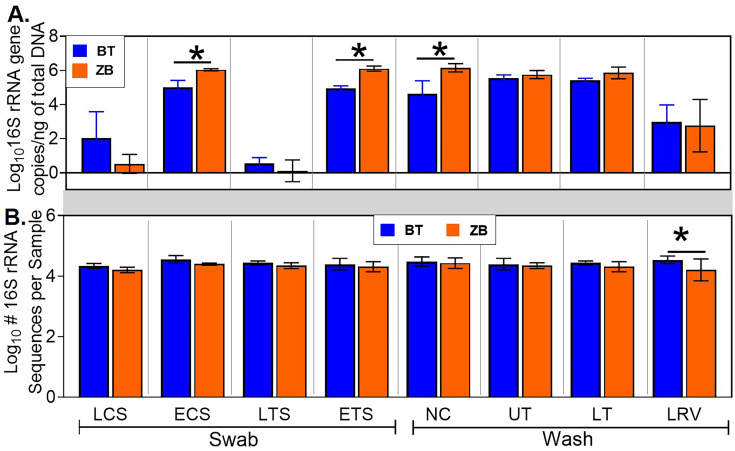
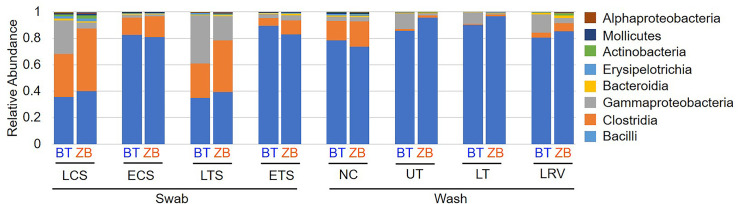
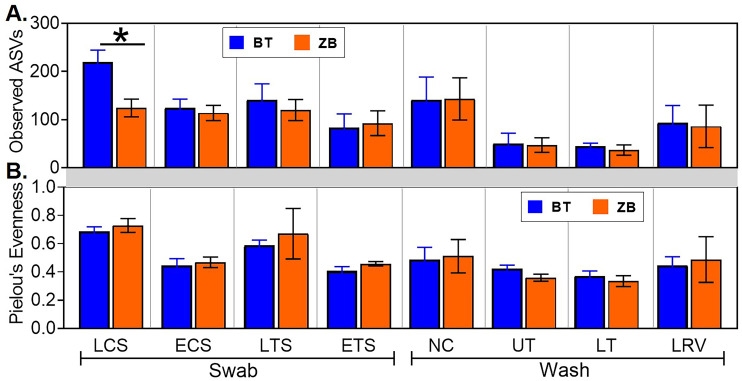
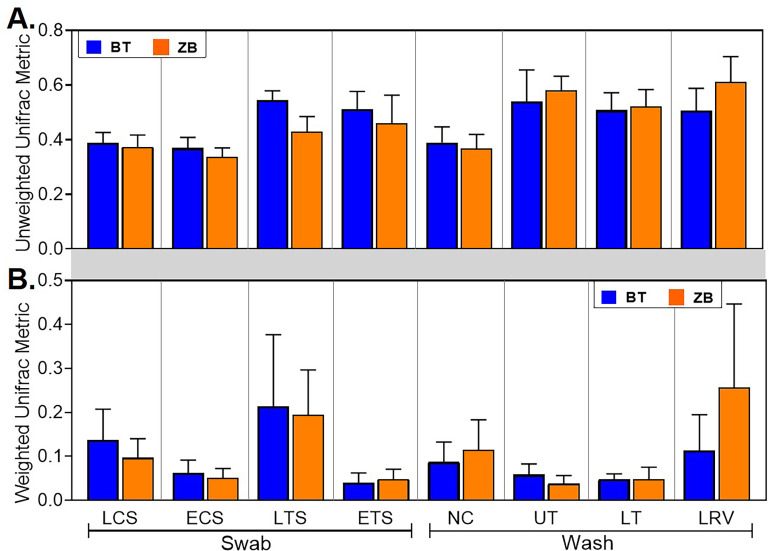
Characterization of poultry microbiota is becoming increasingly important due to the growing need for microbiome-based interventions to improve poultry health and production performance. However, the lack of standardized protocols for sampling, sample processing, DNA extraction, sequencing, and bioinformatic analysis can hinder data comparison between studies. Here, we investigated how the DNA extraction process affects microbial community compositions and diversity metrics in different chicken respiratory sample types including choanal and tracheal swabs, nasal cavity and tracheal washes, and lower respiratory lavage. We did a side-by-side comparison of the performances of Qiagen DNeasy blood and tissue (BT) and ZymoBIOMICS DNA Miniprep (ZB) kits. In general, samples extracted with the BT kit yielded higher concentrations of total DNA while those extracted with the ZB kit contained higher numbers of bacterial 16S rRNA gene copies per unit volume. Therefore, the samples were normalized to equal amounts of 16S rRNA gene copies prior to sequencing. For each sample type, all predominant bacterial taxa detected in samples extracted with one kit were present in replicate samples extracted with the other kit and did not show significant differences at the class level. However, a few differentially abundant shared taxa were observed at family and genus levels. Furthermore, between-kit differences in alpha and beta diversity metrics at the amplicon sequence variant level were statistically indistinguishable. Therefore, both kits perform similarly in terms of 16S rRNA gene-based poultry microbiome analysis for the sample types analyzed in this study.
Conflict of interest statement
NO authors have competing interests.
Figures
Similar articles
-
Exploring the complexities of poultry respiratory microbiota: colonization, composition, and impact on health.Anim Microbiome. 2024 May 6;6(1):25. doi: 10.1186/s42523-024-00308-5. Anim Microbiome. 2024. PMID: 38711114 Free PMC article. Review.
-
Exploring animal food microbiomes and resistomes via 16S rRNA gene amplicon sequencing and shotgun metagenomics.Appl Environ Microbiol. 2025 Feb 19;91(2):e0223024. doi: 10.1128/aem.02230-24. Epub 2025 Jan 22. Appl Environ Microbiol. 2025. PMID: 39840975 Free PMC article.
-
Evaluation of Methods for the Extraction of Microbial DNA From Vaginal Swabs Used for Microbiome Studies.Front Cell Infect Microbiol. 2019 Jun 6;9:197. doi: 10.3389/fcimb.2019.00197. eCollection 2019. Front Cell Infect Microbiol. 2019. PMID: 31245304 Free PMC article.
-
Comparative analysis of commercially available kits for optimal DNA extraction from bovine fecal samples.Arch Microbiol. 2024 Jun 20;206(7):314. doi: 10.1007/s00203-024-04047-8. Arch Microbiol. 2024. PMID: 38900289
-
Choice of DNA extraction method affects detection of bacterial taxa from retail chicken breast.BMC Microbiol. 2022 Sep 30;22(1):230. doi: 10.1186/s12866-022-02650-7. BMC Microbiol. 2022. PMID: 36180850 Free PMC article.
Cited by
-
Bacterial communities along parrot digestive and respiratory tracts: the effects of sample type, species and time.Int Microbiol. 2024 Feb;27(1):127-142. doi: 10.1007/s10123-023-00372-y. Epub 2023 May 24. Int Microbiol. 2024. PMID: 37222909 Free PMC article.
-
Exploring the complexities of poultry respiratory microbiota: colonization, composition, and impact on health.Anim Microbiome. 2024 May 6;6(1):25. doi: 10.1186/s42523-024-00308-5. Anim Microbiome. 2024. PMID: 38711114 Free PMC article. Review.
-
Development of an efficient antimicrobial susceptibility testing method with species identification by Nanopore sequencing of 16S rRNA amplicons.PLoS One. 2022 Feb 3;17(2):e0262912. doi: 10.1371/journal.pone.0262912. eCollection 2022. PLoS One. 2022. PMID: 35113894 Free PMC article.
-
Rational Use of Danofloxacin for Treatment of Mycoplasma gallisepticum in Chickens Based on the Clinical Breakpoint and Lung Microbiota Shift.Antibiotics (Basel). 2022 Mar 17;11(3):403. doi: 10.3390/antibiotics11030403. Antibiotics (Basel). 2022. PMID: 35326865 Free PMC article.
-
Influenza A virus infection in turkeys induces respiratory and enteric bacterial dysbiosis correlating with cytokine gene expression.PeerJ. 2021 Jul 22;9:e11806. doi: 10.7717/peerj.11806. eCollection 2021. PeerJ. 2021. PMID: 34327060 Free PMC article.
References
-
- Johnson TJ, Youmans BP, Noll S, Cardona C, Evans NP, Karnezos TP, et al. A Consistent and Predictable Commercial Broiler Chicken Bacterial Microbiota in Antibiotic-Free Production Displays Strong Correlations with Performance. Appl Environ Microbiol. 2018;84 10.1128/AEM.00362-18 - DOI - PMC - PubMed
-
- Torok VA, Hughes RJ, Mikkelsen LL, Perez-Maldonado R, Balding K, MacAlpine R, et al. Identification and Characterization of Potential Performance-Related Gut Microbiotas in Broiler Chickens across Various Feeding Trials. Appl Environ Microbiol. 2011;77: 5868–5878. 10.1128/AEM.00165-11 - DOI - PMC - PubMed
Publication types
MeSH terms
Substances
LinkOut - more resources
Full Text Sources
Other Literature Sources
