. 2021 Jan 5;33(1):78-93.e7.
doi: 10.1016/j.cmet.2020.12.011.

Acetyl-CoA Synthetase 2: A Critical Linkage in Obesity-Induced Tumorigenesis in Myeloma

Affiliations

Acetyl-CoA Synthetase 2: A Critical Linkage in Obesity-Induced Tumorigenesis in Myeloma

Zongwei Li et al. Cell Metab. .

Abstract

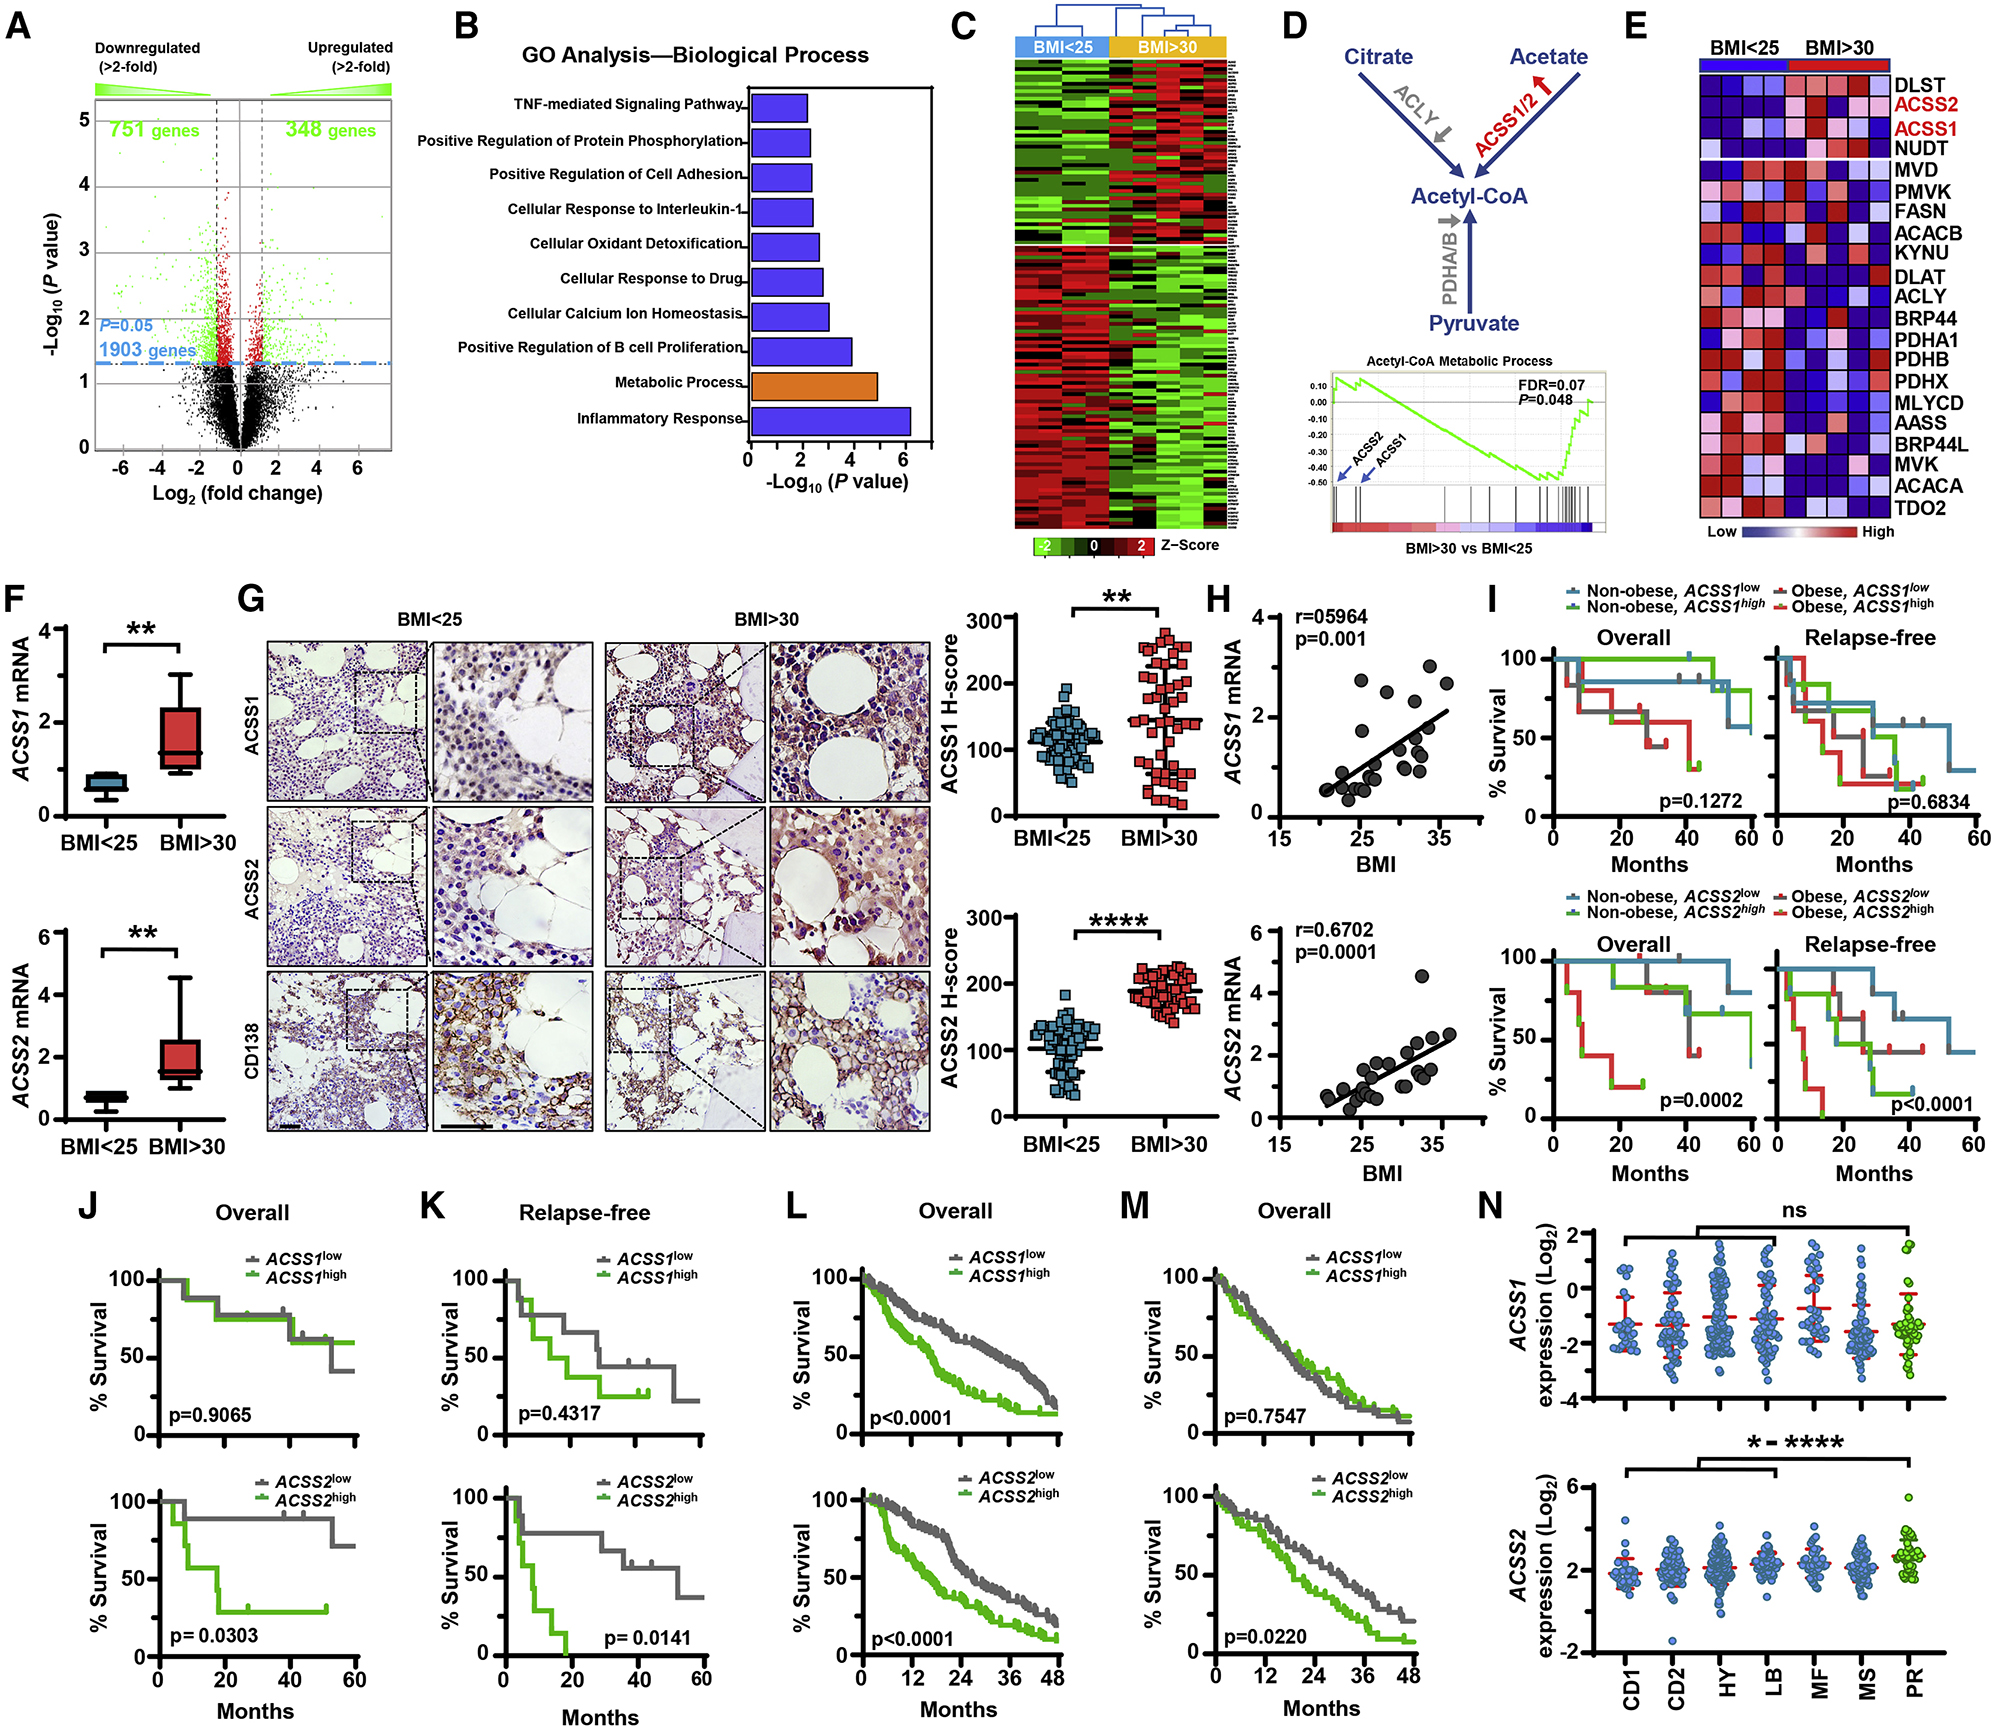
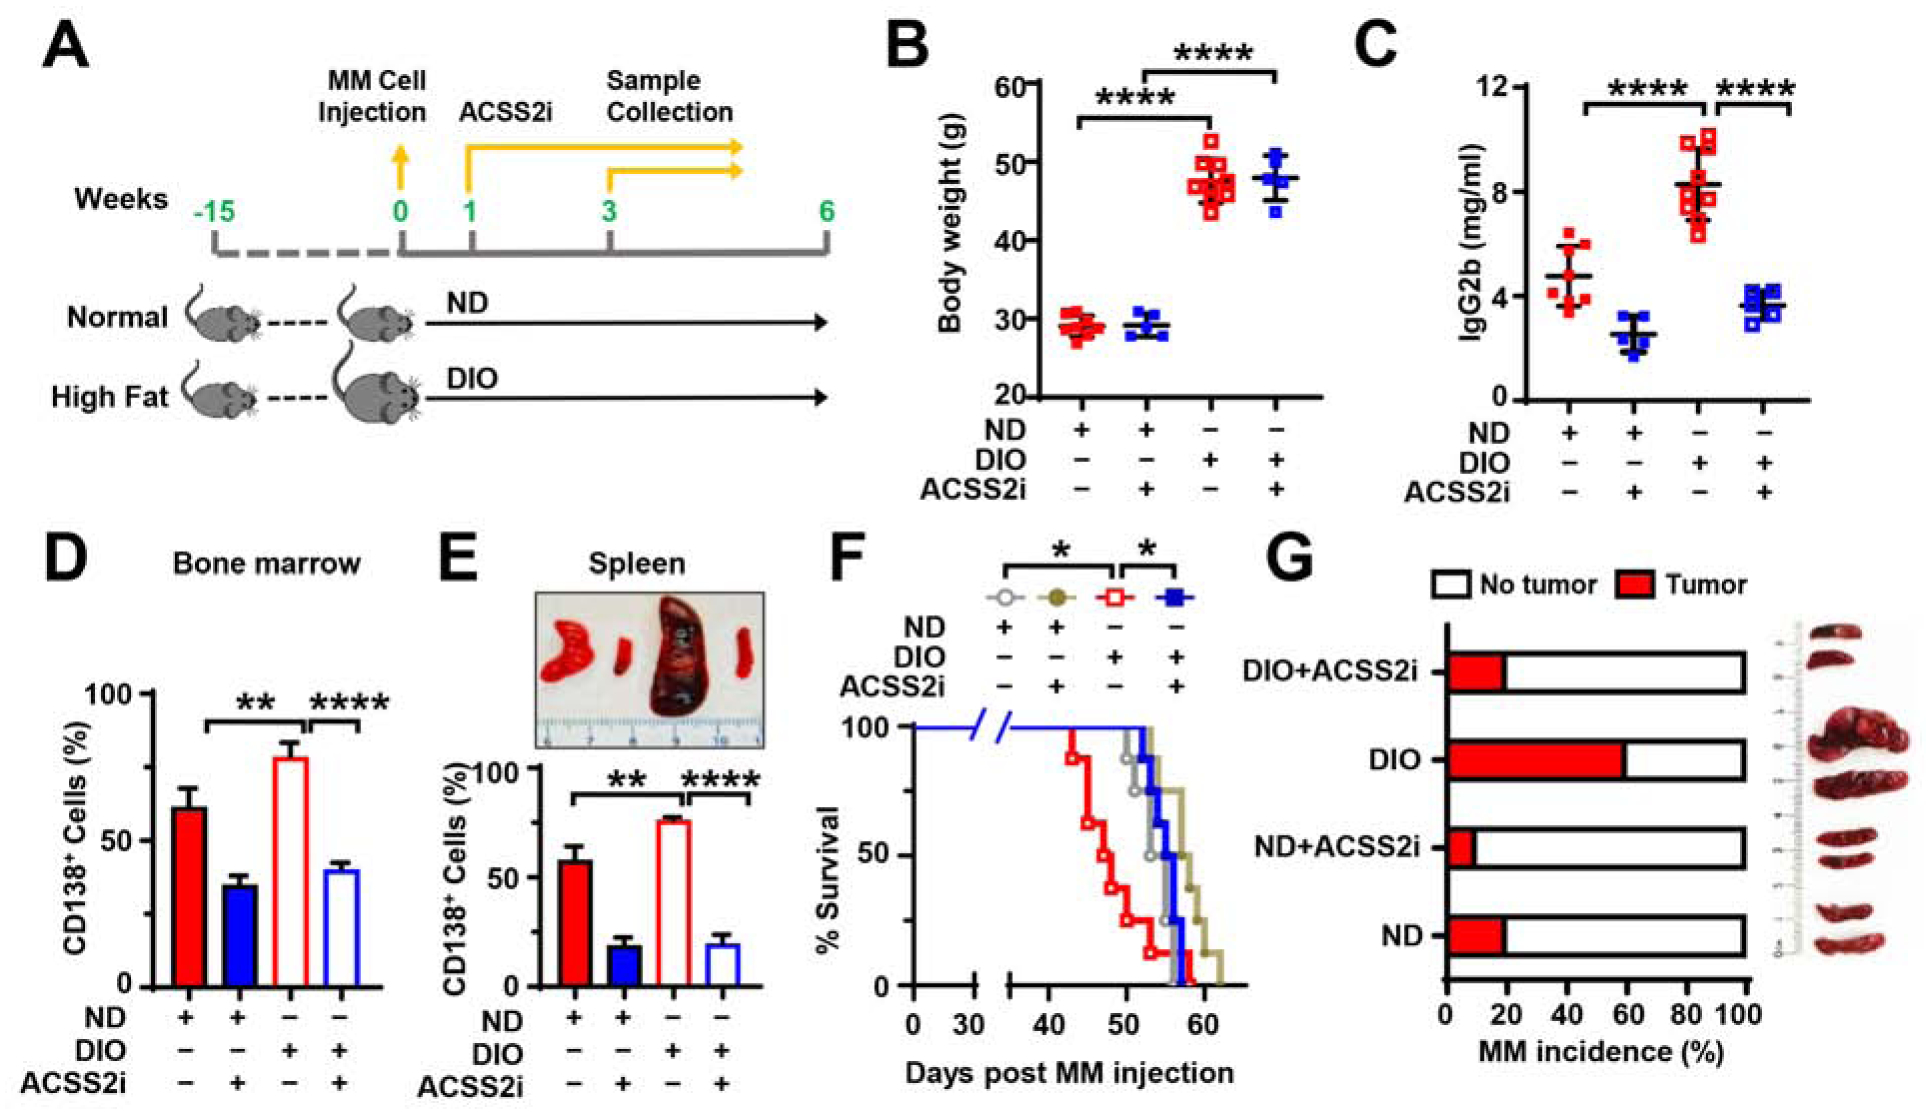
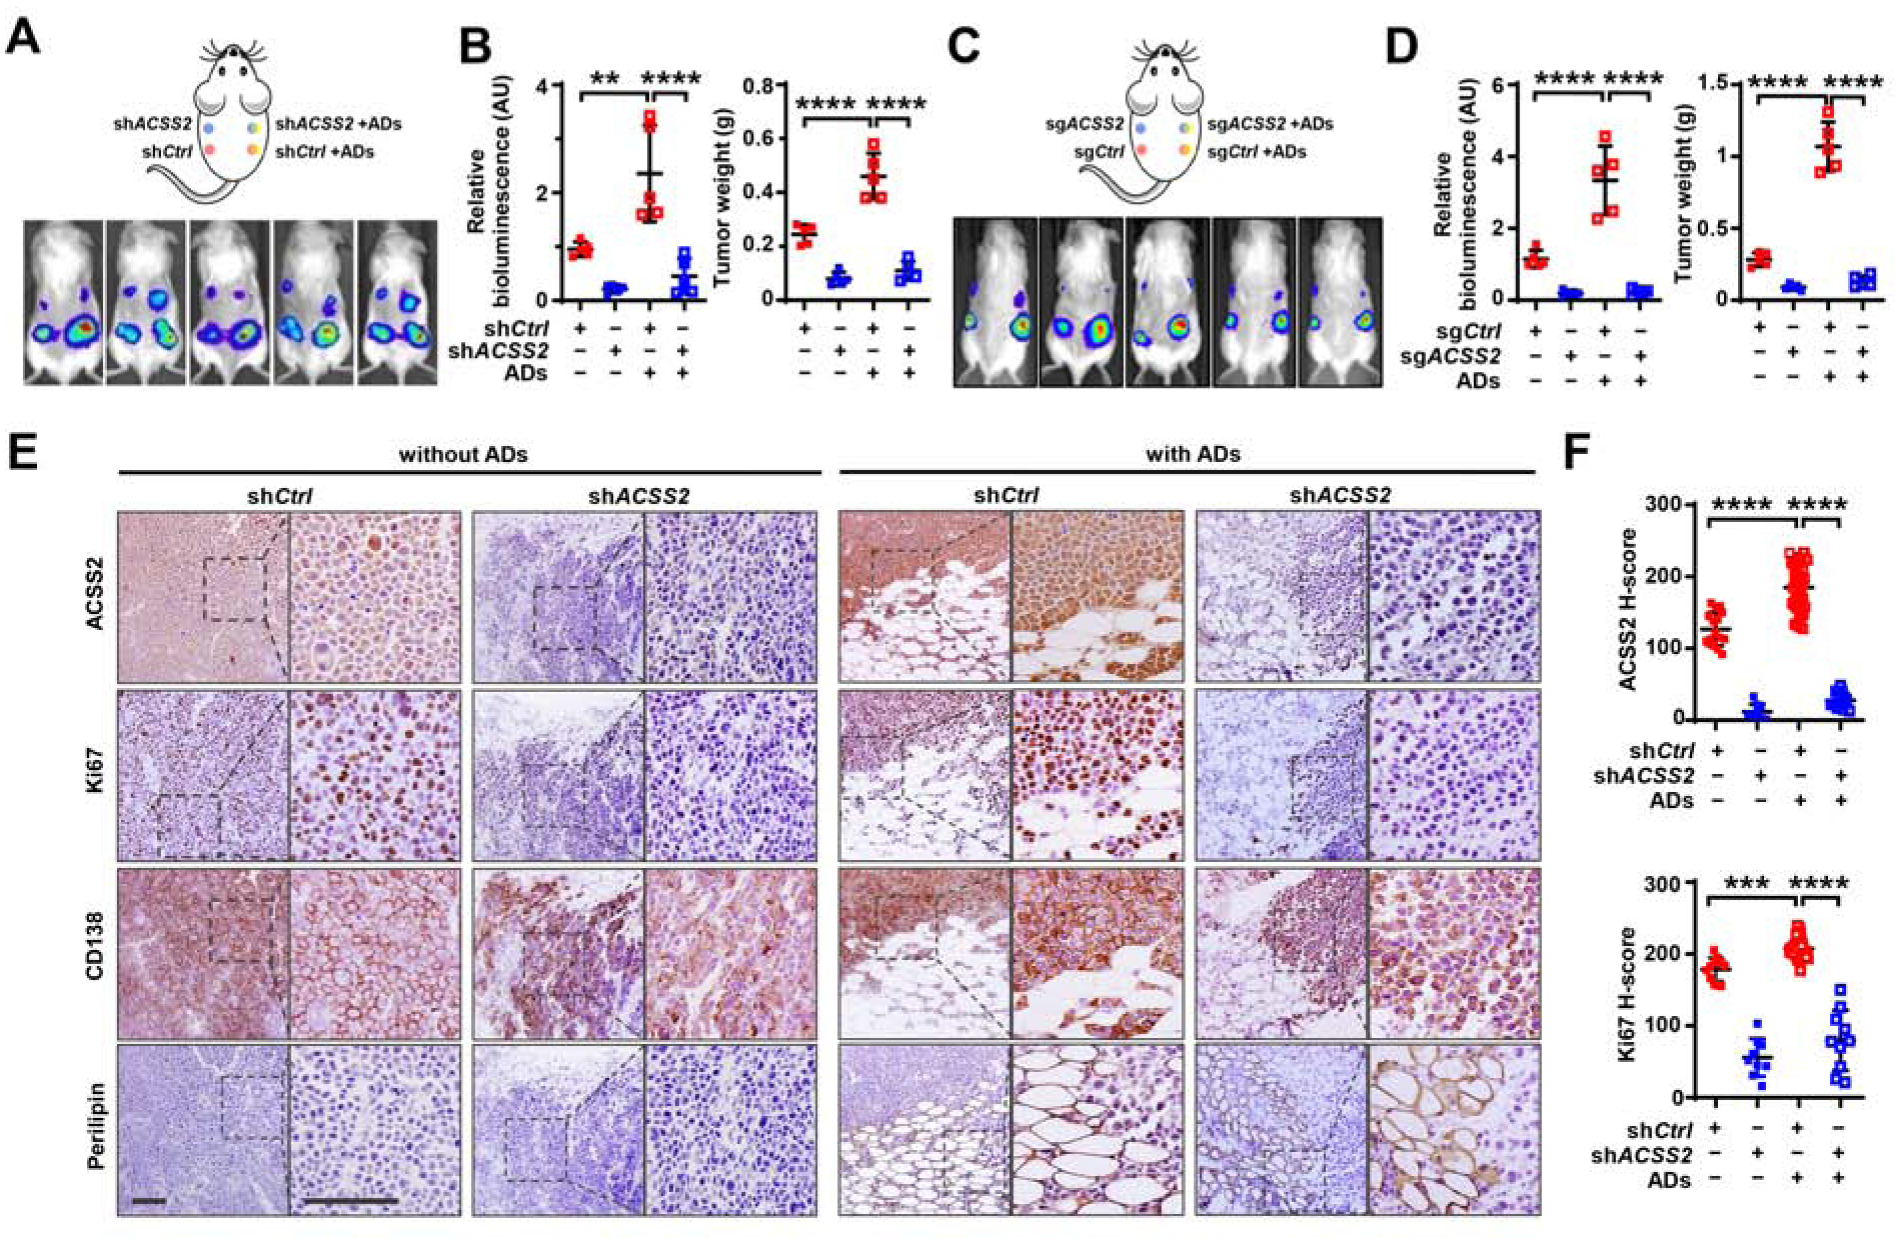
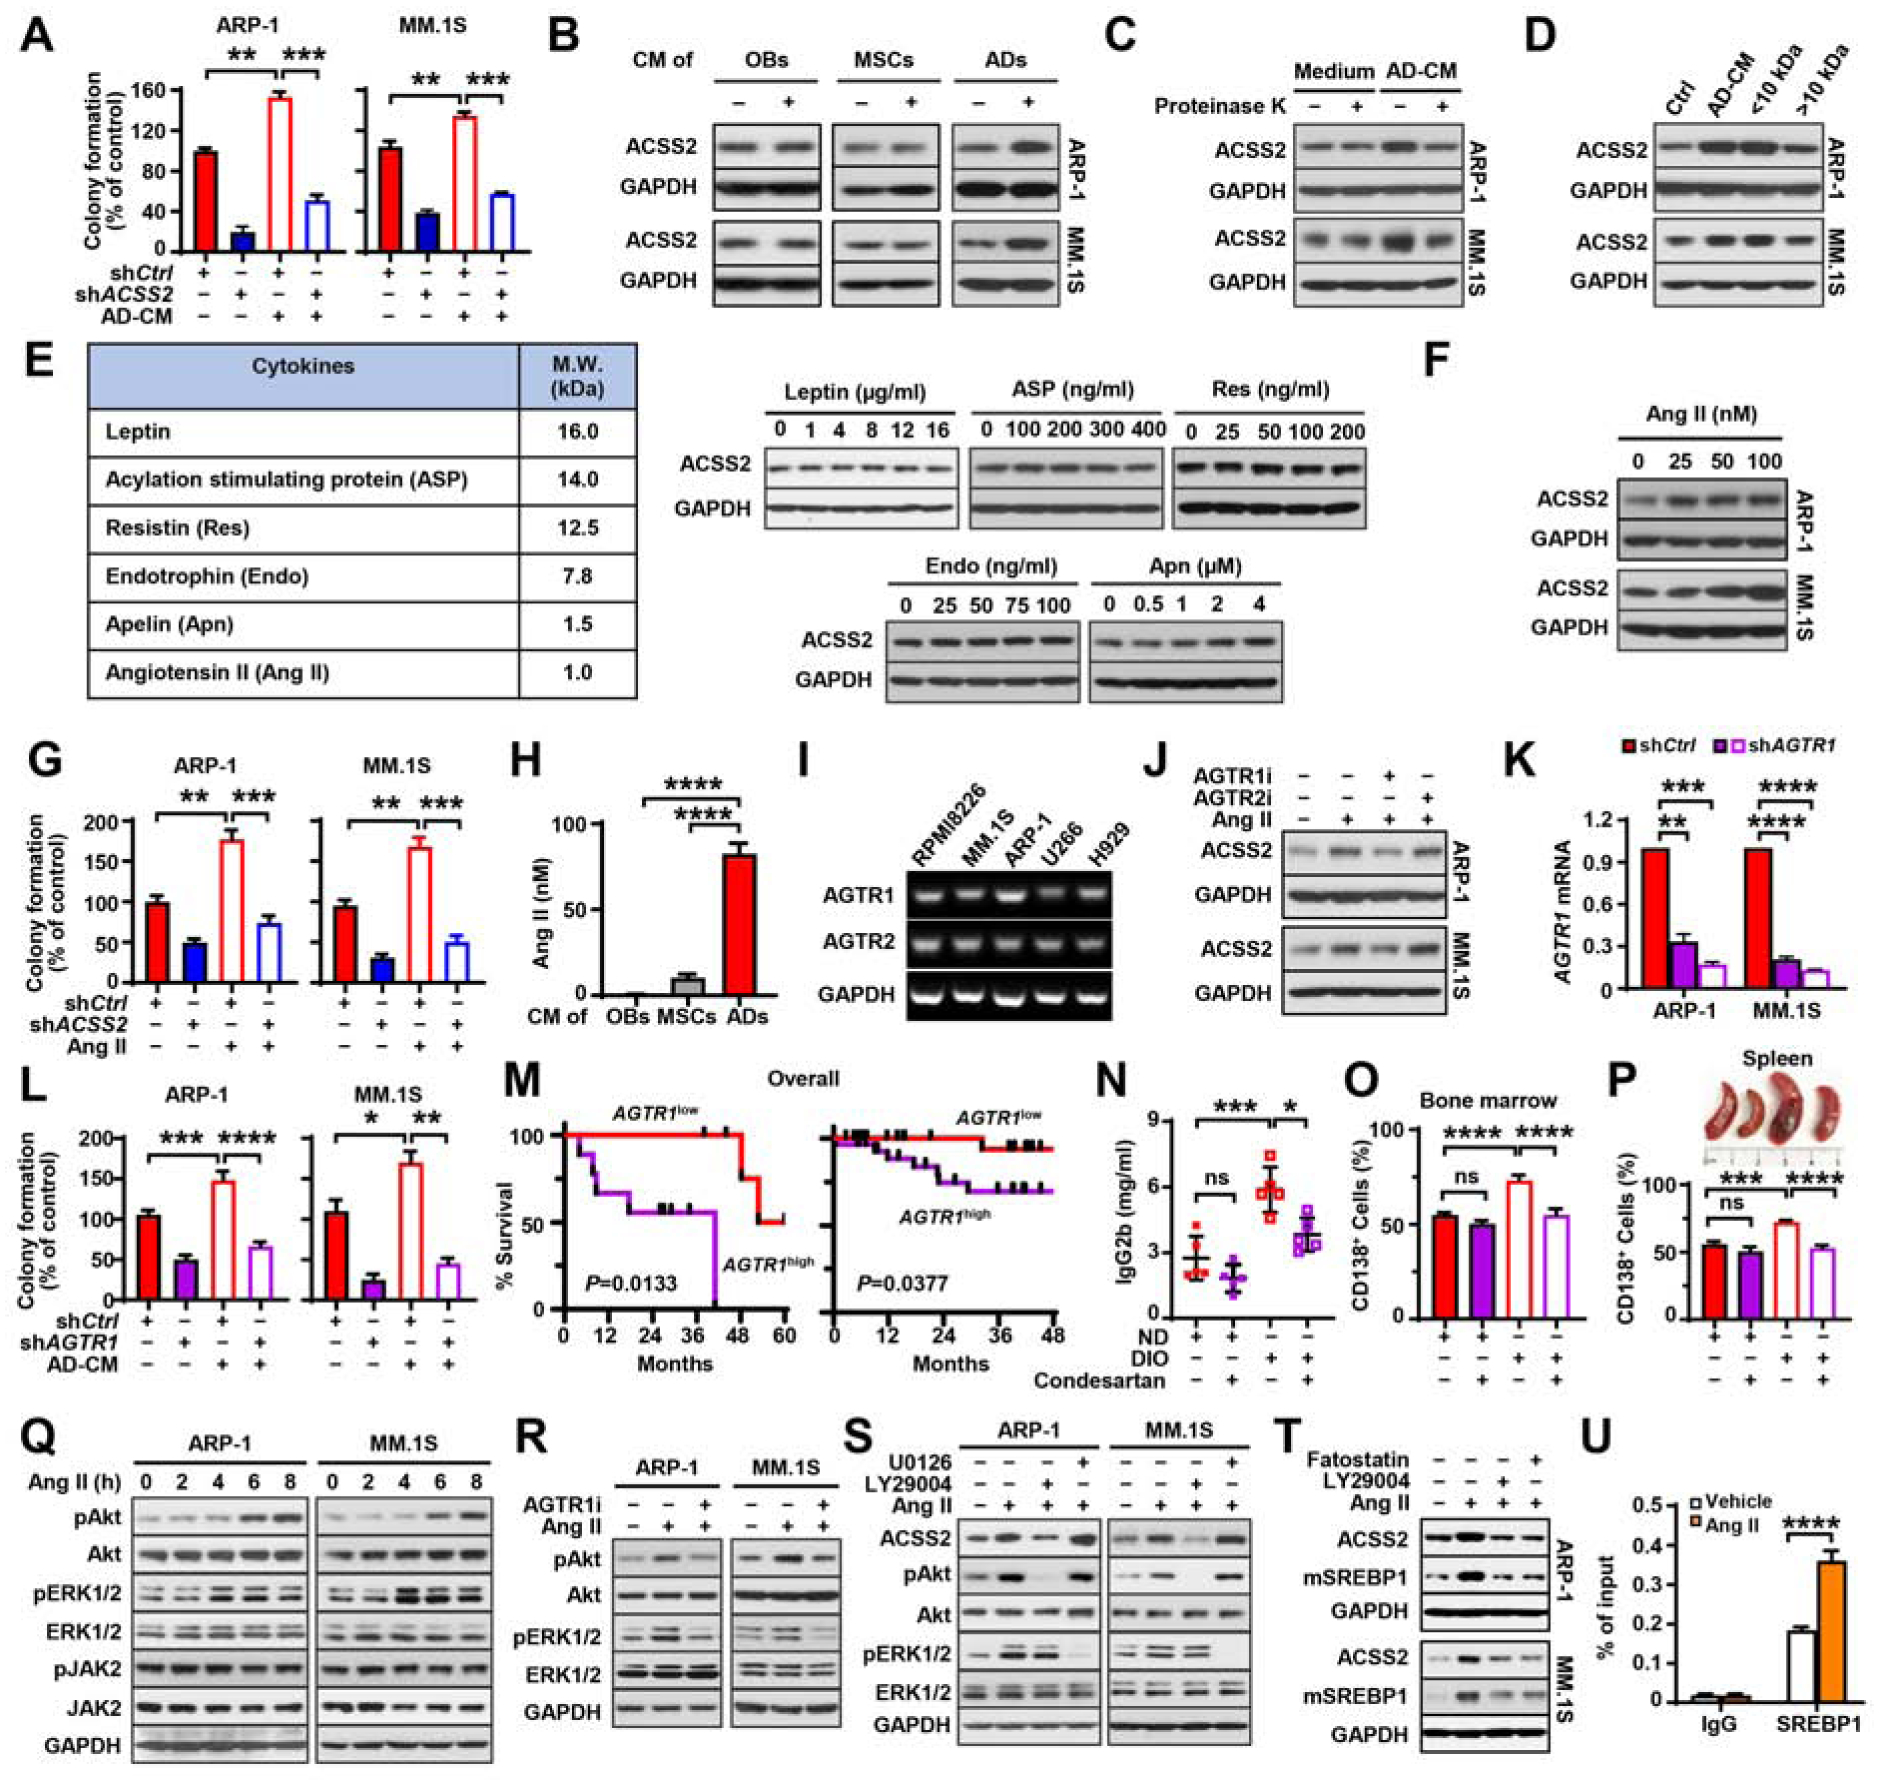
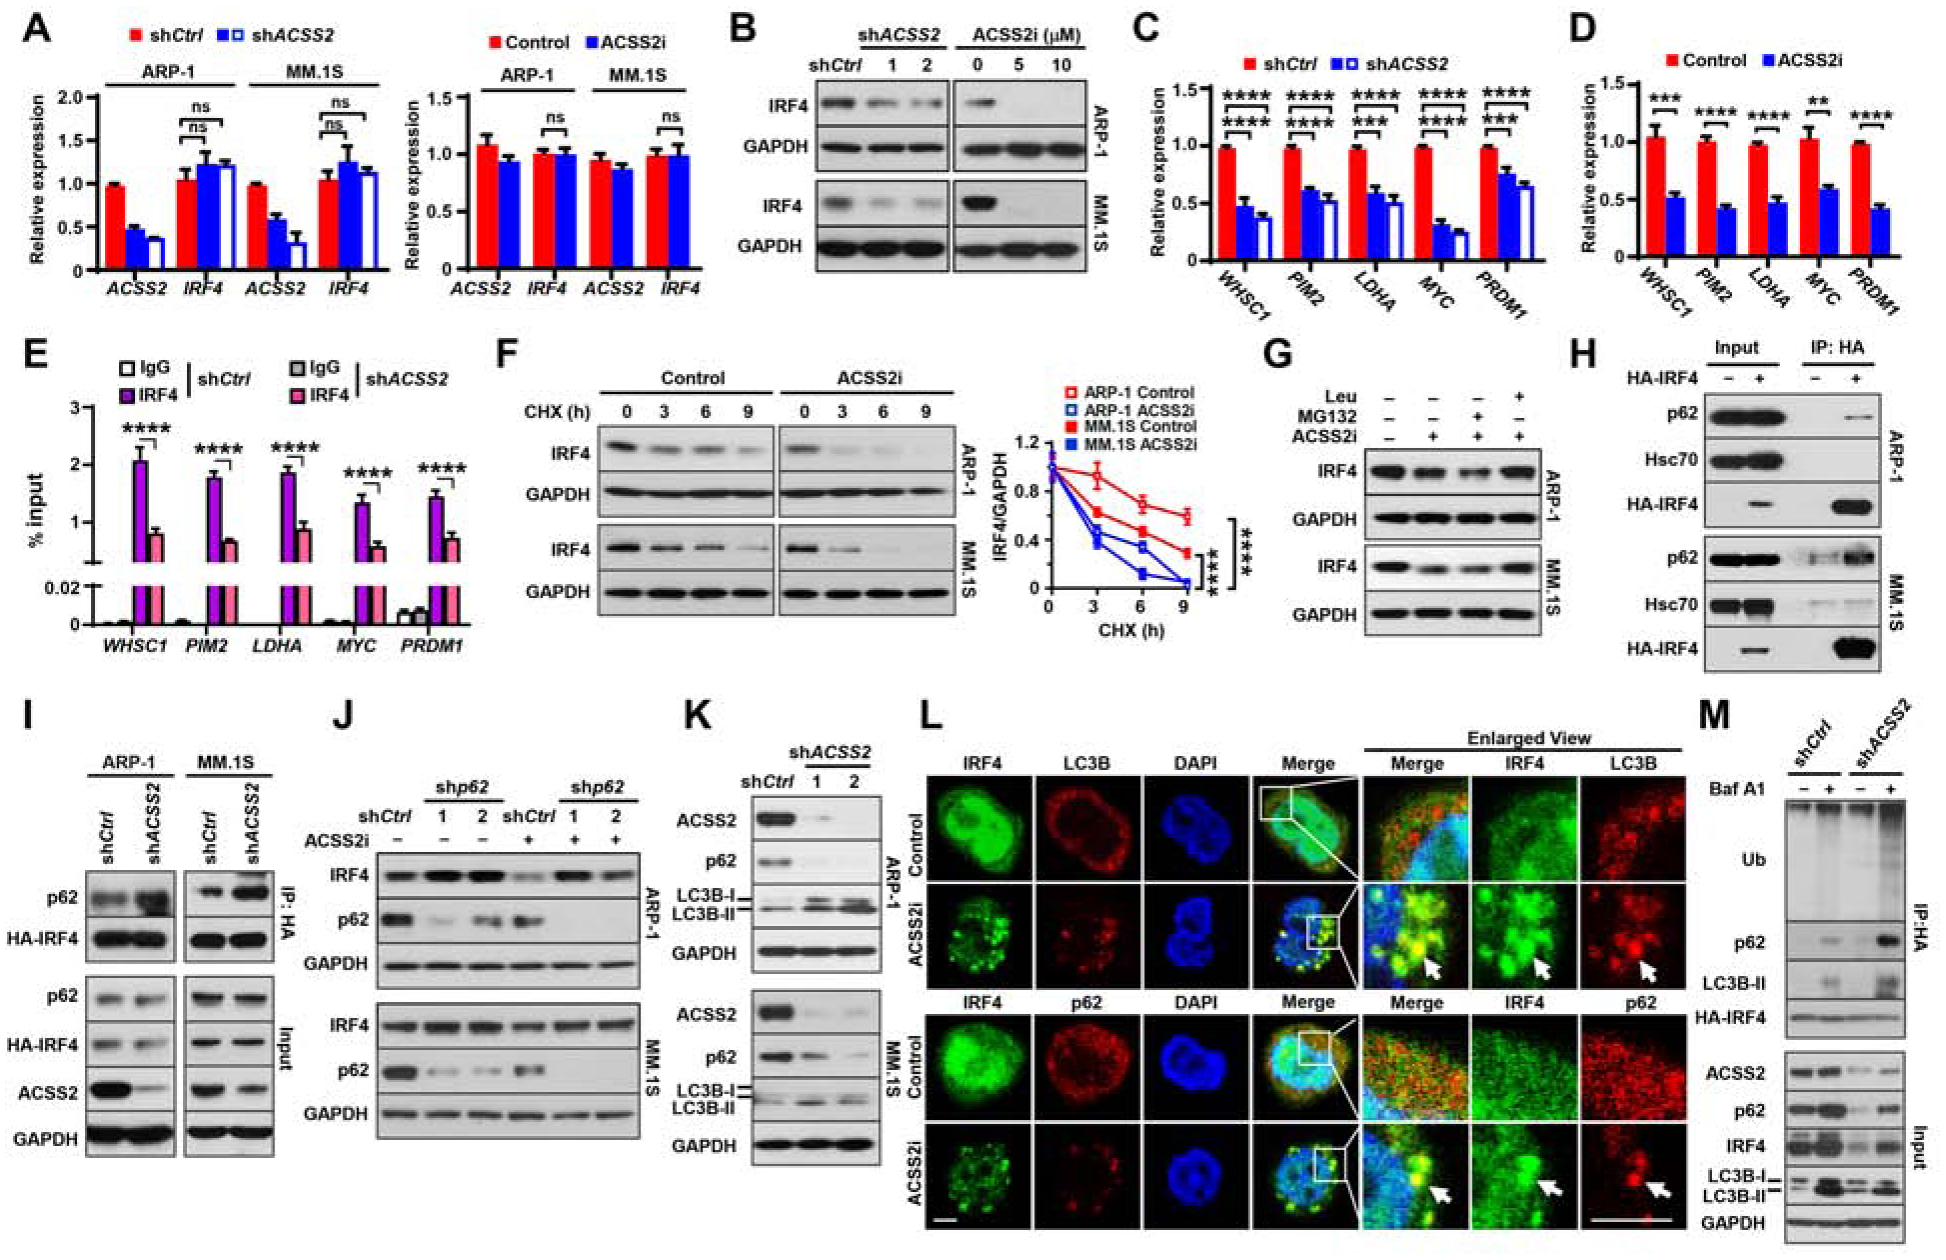
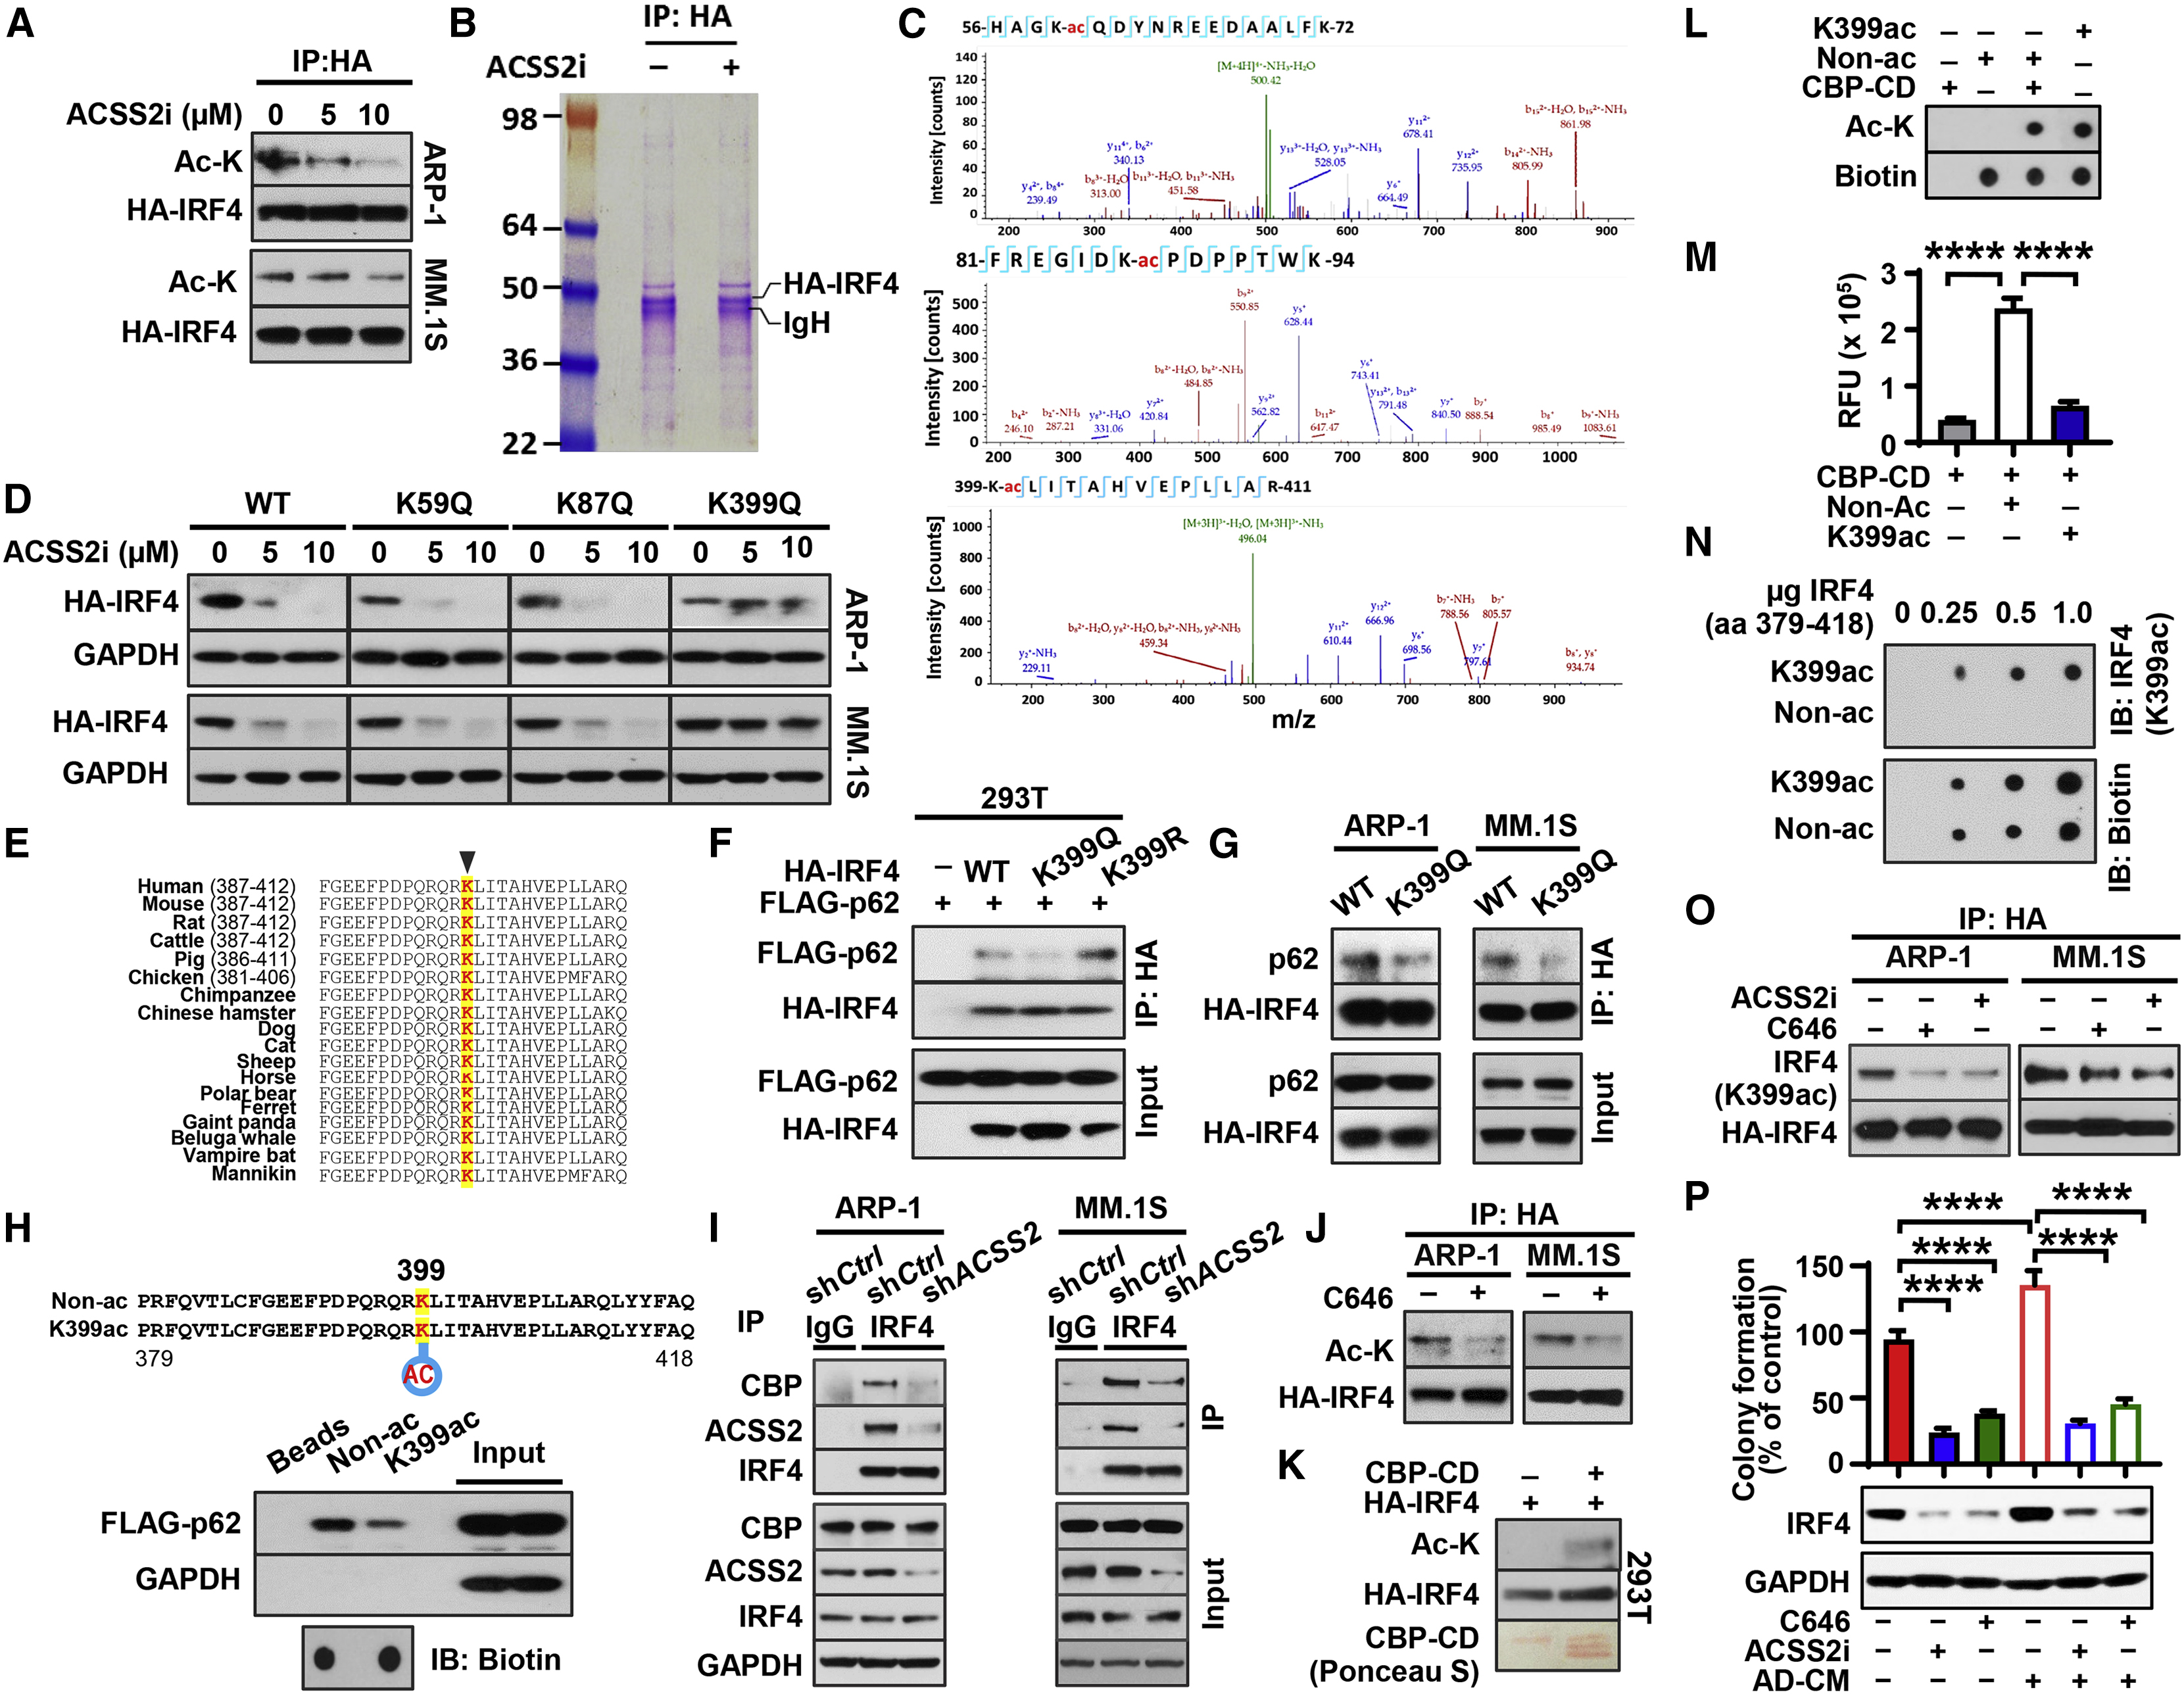
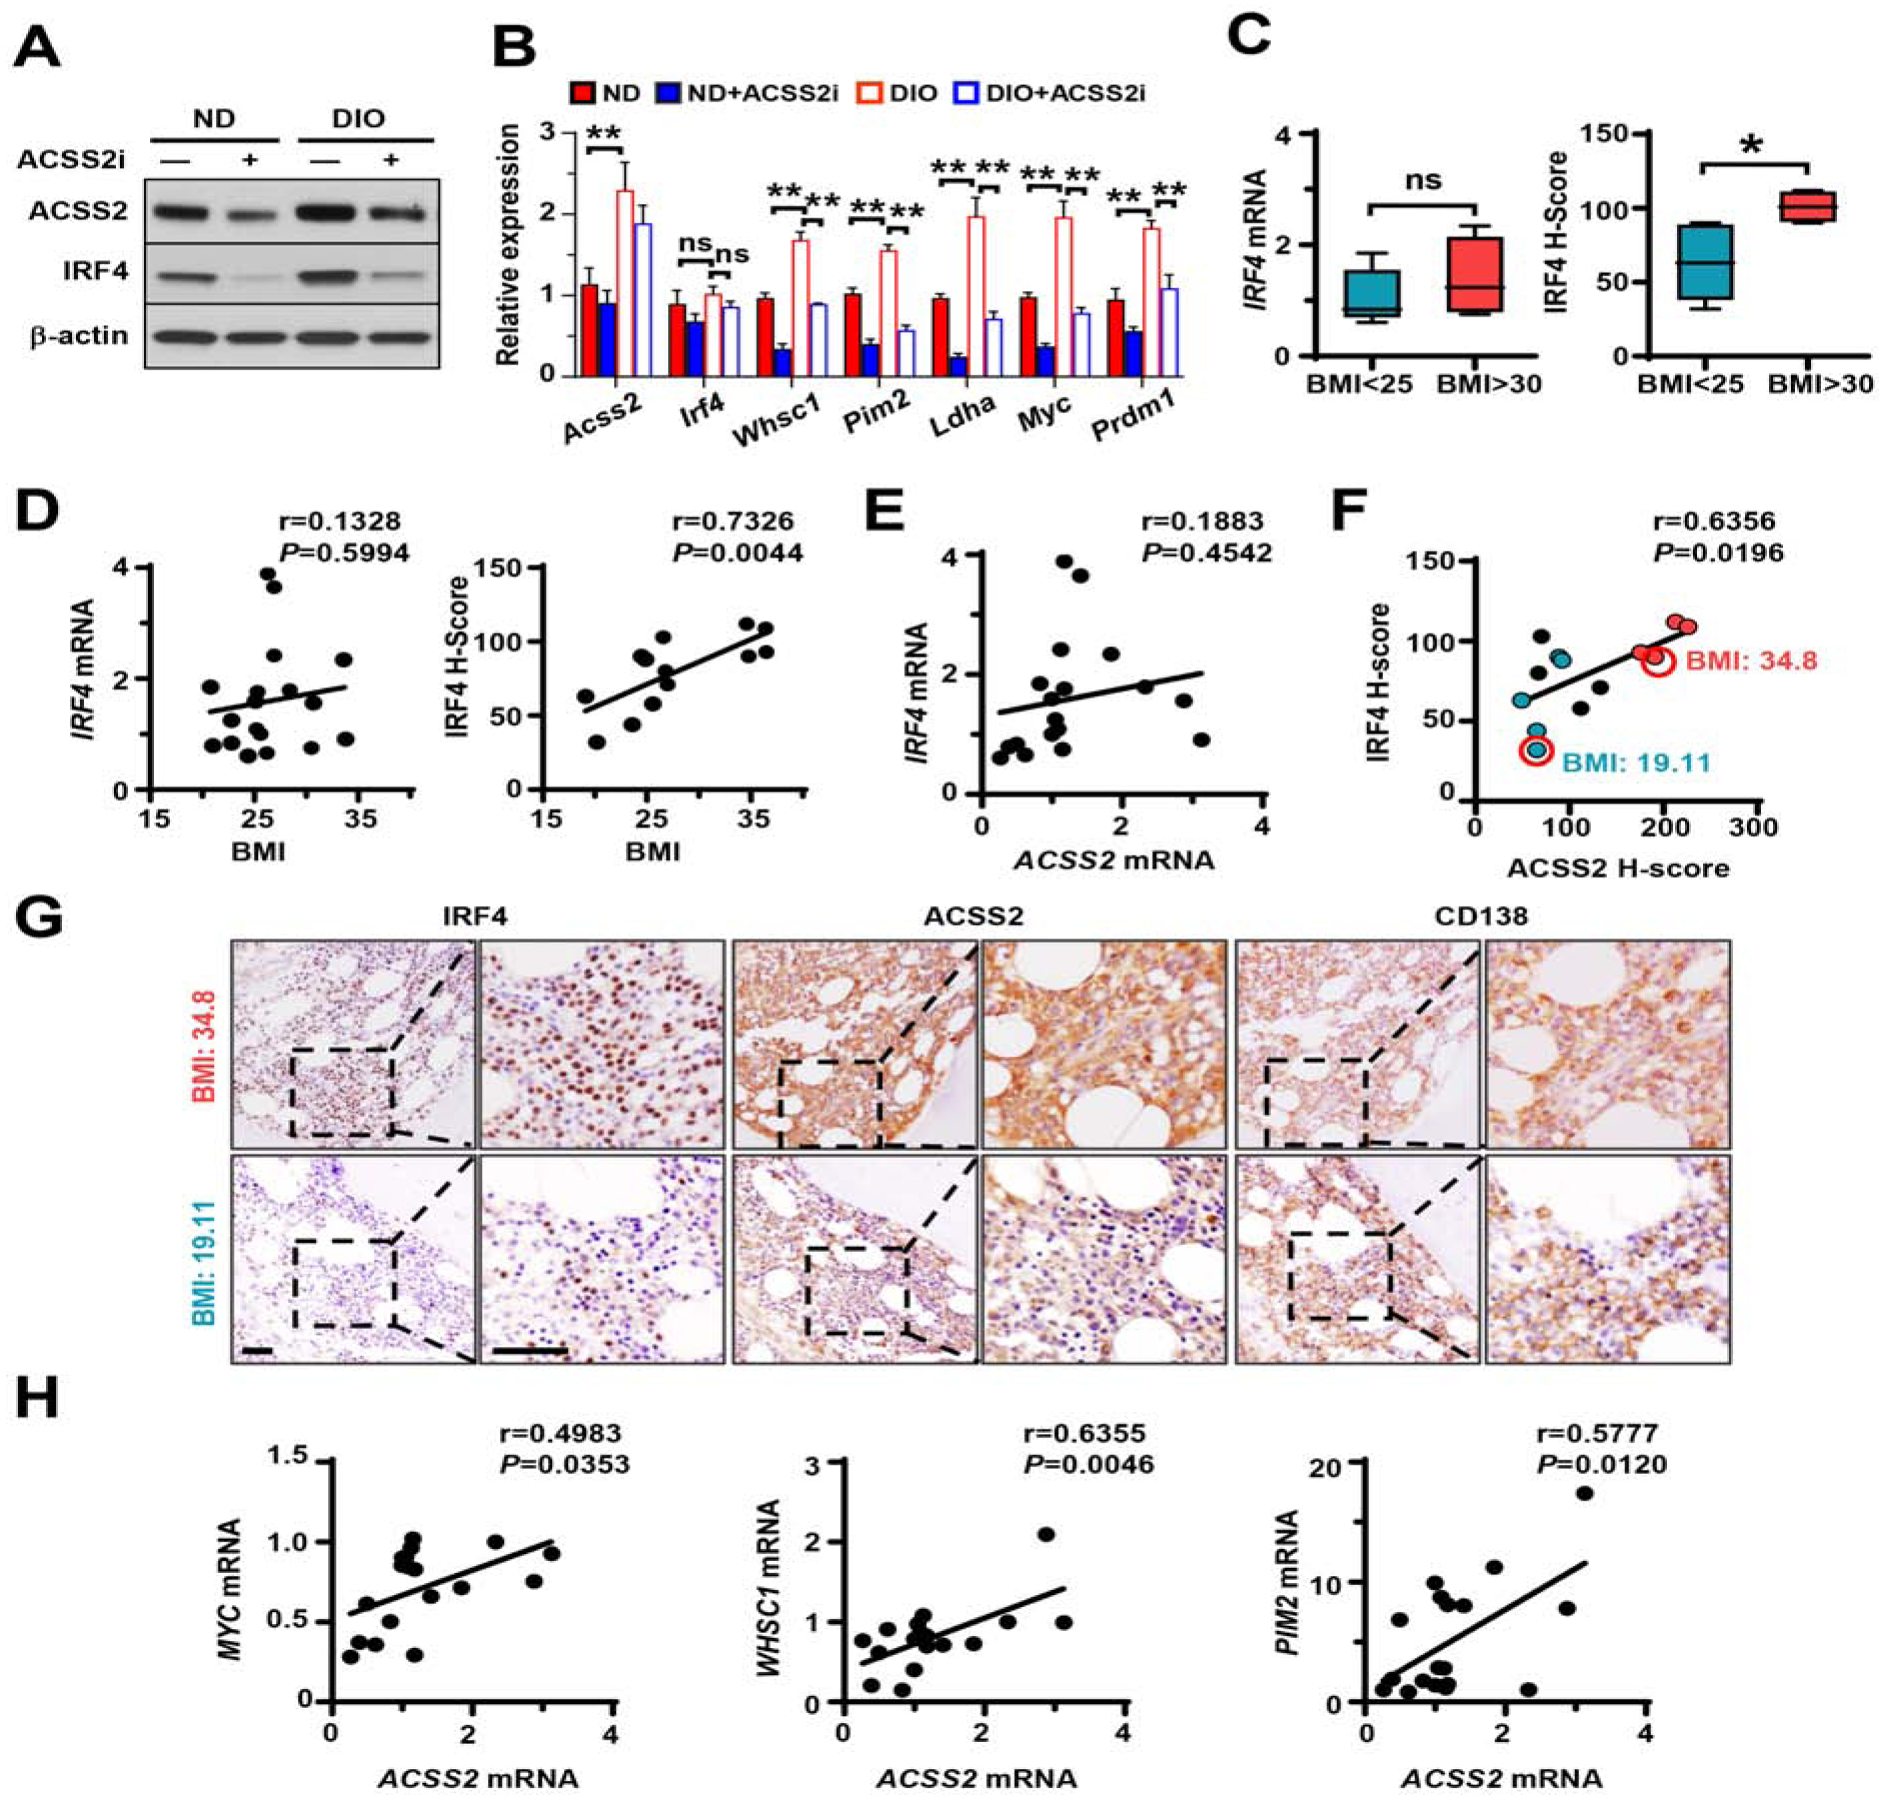
Obesity is often linked to malignancies including multiple myeloma, and the underlying mechanisms remain elusive. Here we showed that acetyl-CoA synthetase 2 (ACSS2) may be an important linker in obesity-related myeloma. ACSS2 is overexpressed in myeloma cells derived from obese patients and contributes to myeloma progression. We identified adipocyte-secreted angiotensin II as a direct cause of adiposity in increased ACSS2 expression. ACSS2 interacts with oncoprotein interferon regulatory factor 4 (IRF4), and enhances IRF4 stability and IRF4-mediated gene transcription through activation of acetylation. The importance of ACSS2 overexpression in myeloma is confirmed by the finding that an inhibitor of ACSS2 reduces myeloma growth both in vitro and in a diet-induced obese mouse model. Our findings demonstrate a key impact for obesity-induced ACSS2 on the progression of myeloma. Given the central role of ACSS2 in many tumors, this mechanism could be important to other obesity-related malignancies.

Keywords: ACSS2; IRF4; adipocytes; angiotensin II; autophagy; lysine acetylation; multiple myeloma; obesity.


Conflict of interest statement

Declaration of Interests The authors declare no conflicts of interest.

Figures

Figure 1.
Figure 1.. Expression of ACSS2 in malignant plasma cells is elevated in obese myeloma patients.
(A-E) RNAs of malignant plasma cells from bone marrow aspirates of patients with newly diagnosed myeloma were subjected to microarray analysis based on patients’ BMI (< 25 kg/m2, n=4; > 30 kg/m2, n=5). (A) Volcano plot shows the differentially up- or down-regulated genes between the two groups. Genes deemed statistically significant are in lime green. (B) Gene ontology analysis shows the biological processes most altered between the compared groups. (C) Heat map of the 127 most significantly up- and down-regulated genes from the metabolic process gene set. (D) Schematic process of acetyl-CoA synthesis (upper) and the GSEA enrichment plot using the “acetyl-CoA metabolic process” gene set in myeloma cells (lower). (E) Heat map of differentially expressed genes in acetyl-CoA synthesis in obese patients when compared with normal-weight patients. (F) ACSS1 or ACSS2 mRNAs in malignant plasma cells isolated from bone marrow aspirates of myeloma patients (n=18). (G) Immunohistochemical staining of patients’ bone marrow biopsies with antibodies against ACSS1, ACSS2, and CD138. Scale bars, 50 μm. Right, summarized data. (H) Correlation coefficient between ACSS1 or ACSS2 mRNAs in malignant plasma cells and patients’ BMIs (n=27). (I) Kaplan–Meier analysis of overall (left) and relapse-free (right) survivals in 4 myeloma patient groups (n=5–7/group). (J-K) Kaplan–Meier analysis of overall (J) and relapse-free (K) survivals in myeloma patients with high (n=9) or low (n=7) ACSS1 or ACSS2 expression. (L-M) Kaplan–Meier analysis of patients’ overall survival in the indicated groups of Zhan et al dataset (n=100/group, L) and MMRF CoMMpass dataset (n = 53/group, M). (N) Relative expression of ACSS1 or ACSS2 in myeloma subgroups (CD1=28, CD2=60, HY=116, LB=55, MF=37, MS=65 and PR=46) characterized by gene expression profiling by Zhan et al, 2006. *P < 0.05; **P < 0.01; ****P < 0.0001. See also Figure S1 and Table S1.
Figure 2.
Figure 2.. Treatment of ACSS2i reduces tumor growth in the myeloma DIO mouse model.
(A-F) ND or DIO C57BL/6J mice intrafemorally injected with Vk12598 cells were treated with ACSS2i (n=5 or 8/group). (A) Schema for the myeloma obesity mouse model. (B) Mouse body weights. (C) Levels of IgG2b in mouse sera. (D) Percentages of marrow-infiltrated CD138+ myeloma cells. (E) Representative images of mouse spleens (upper) and percentages of spleen-infiltrated CD138+ myeloma cells (lower). (F) Kaplan–Meier analysis of overall mouse survival. (G) Incidence rate of myeloma in mice (left) and representative images of mouse spleens (right) 8 weeks after DIO or ND C57BL/6J mice intravenously injected with 5TGM1 cells and treated with ACSS2i (n=10/group). Data shown as mean ± SD (**P < 0.01; ****P < 0.0001). See also Figures S2 and S3.
Figure 3.
Figure 3.. ACSS2 mediates adipocyte-enhanced myeloma growth in vivo.
(A-D) Illustrated injection sites (upper), bioluminescent images (lower) (A, C), quantitative bioluminescent signals, and tumor weights (B, D) of NSG mice 4 weeks after subcutaneous injection of luciferase-labeled shCtrl or shACSS2 ARP-1 cells (A-B) or sgCtrl or sgACSS2MM.1S cells (C-D), alone or mixed with human adipocytes. (E-F) Immunohistochemical staining of ACSS2, Ki67, CD138, and perilipin in tumor tissues (E) and H-scores for ACSS2 and Ki67 (F) in shCtrl or shACSS2 ARP-1 cells. Scale bars, 100 μm. Data shown as mean ± SD (n=5 mice/group). **P < 0.01; ***P < 0.001; ****P < 0.0001. See also Figures S2 and S3.
Figure 4.
Figure 4.. Adipocyte-derived angiotensin II enhances the expression of ACSS2 in myeloma cells.
(A) Colony formation in shCtrl or shACSS2 myeloma cells with or without adipocyte condition medium (AD-CM). (B) Expression of ACSS2 in myeloma cells cultured with condition medium of human MSCs, adipocytes, or osteoblasts (OBs). (C-D) ACSS2 protein levels in myeloma cells cultured in AD-CM pretreated with proteinase K-agarose (C) or different molecular weight cutoff fractions (D). (E) List of cytokines secreted by adipocytes with molecular weights around or less than 10 kDa and ACSS2 levels in ARP-1 cells cultured with leptin, ASP, Res, Apn, or Endo. (F) ACSS2 levels in myeloma cells cultured with Ang II. (G) Colony formation of shCtrl or shACCS2-expressing myeloma cells cultured with or without 100 nM Ang II. (H) Concentration of Ang II in the supernatant of adipocytes, OBs, or MSCs after 72 hours. (I) Expression of Ang II receptors AGTR1 and AGTR2 in myeloma cells. (J) ACSS2 expression in myeloma cells cultured in 100 nM Ang II and 10 μM inhibitors against AGTR1 (AGTR1i) or AGTR2 (AGTR2i). (K) AGTR1 mRNAs in shCtrl or shAGTR1 myeloma cells. (L) Colony formation in shCtrl or shAGTR1 myeloma cells cultured with or without AD-CM. (M) Kaplan–Meier analysis of overall survival of myeloma patients with high or low AGTR1 expression (left: our data, high [n=9], low [n=6]; right: MMRF CoMMpass, n=28/group). (N-P) Levels of IgG2b in mouse sera (N), percentages of marrow-infiltrated CD138+ myeloma cells (O), and mouse spleens and percentages of spleen-infiltrated CD138+ myeloma cells (P) in Vk12598-bearing ND or DIO C57BL/6J mice treated with condesartan (n=5/group). (Q) Time course on the levels of non-phosphorylated or phosphorylated Akt, ERK1/2, and JAK2 in myeloma cells treated with 100 nM Ang II. (R-S) Levels of non-phosphorylated or phosphorylated Akt and ERK1/2 in myeloma cells incubated with 100 nM Ang II and 10 μM of AGTR1i (R), LY29004 or U0126 (S). (T) Protein levels of ACSS2 and mature SREBP1 (mSREBP1) in myeloma cells cultured with Ang II (100 nM) and LY29004 (10 μM) or fatostatin (5 μM) for 24 hours. (U) ChIP assay shows the enrichment of SREBP1 at the promoter of ACSS2 gene in ARP-1 cells with or without Ang II (100 nM). Data shown as mean± SD (ns, not significant; *P<0.05; ** P < 0.01; *** P < 0.001; **** P < 0.0001). See also Figure S4.
Figure 5.
Figure 5.. ACSS2 impairs lysosome-mediated IRF4 protein degradation.
(A-B) IRF4 mRNA (A) and IRF4 protein (B) in shCtrl or shACSS2 myeloma cells, or uninfected cells treated with10 μM ACSS2i for 24 hours. (C-D) Relative expression of IRF4 target genes WHSC1, PIM2, MYC, LDHA, and PRDM1 in shCtrl- and shACSS2-expressing (C) or ACSS2i-treated (D) myeloma cells. (E) ChIP assay shows the enrichment of IRF4 at the promoter of WHSC1, PIM2, MYC, LDHA, or PRDM1 genes. (F) Time course of IRF4 protein in myeloma cells treated with 10 μM ACSS2i and 100 μM cycloheximide (CHX). Right: normalized IRF4 against GAPDH. (G) IRF4 protein levels in myeloma cells treated with 10 μM ACSS2i and 10 μM MG-132 or 10 μM leupeptin for 24 hours. (H) p62, Hsc70, and HA-IRF4 proteins in the immunoprecipitates of lysates from myeloma cells carrying HA-tagged IRF4. (I) Immunoprecipitation (IP) analysis of HA-IRF4 with endogenous p62 protein in HA-tagged IRF4 myeloma cells that were infected with lentivirus carrying shCtrl or shACSS2. Immunoblotting was detected with antibodies against HA or p62. (J) IRF4 and p62 protein levels in shp62-expressing myeloma cells treated with 10 μM ACSS2i for 24 hours. (K) LC3B-I/II, p62, and ACSS2 protein levels in shCtrl or shACSS2 myeloma cells. (L) Immunofluorescent staining of ACSS2i-treated ARP-1 cells with DAPI and antibodies against IRF4, p62, or LC3B. Scale bar, 5 μm. (M) IP of lysates from HA-tagged IRF4 ARP-1 cells that were infected with lentivirus carrying shCtrl or shACSS2 and treated with or without 100 nM bafilomycin A1 for 6 hours. Data shown as mean ± SD (ns, non-significant; **P < 0.01; ***P < 0.001; ****P < 0.0001). See also Figures S5–S7.
Figure 6.
Figure 6.. ACSS2 maintains IRF4 protein stability through activation of lysine acetylation.
(A-C) Lysine acetylation (Ac-K) and HA-IRF4 protein level (A), Coomassie blue staining of SDS-PAGE gel (B), and mass spectrometry of acetylated lysine (K-ac) at positions 59, 87, and 399 from the cutout HA-IRF4 protein band (C) in HA-IRF4 expressing cell lysates immunoprecipitated with anti-HA resin after 12 hours of ACSS2i treatment. (D) HA-IRF4 protein levels in myeloma cells carrying HA-tagged wild type (WT) or mutation of lysine to glutamine (K to Q) 24 hours after 5 μM ACSS2i treatment (immunoblotting: anti-HA). (E) Conservation of the lysine residue at 399 of IRF4 across different species. (F) IP of p62 and IRF4 with anti-HA resin in lysates of HEK293T cells co-transfected with FLAG-tagged p62 (FLAG-p62) and varied forms of HA-IRF4 (immunoblotting: anti-HA or anti-FLAG). (G) IP of p62 and IRF4 in lysates of myeloma cells carrying WT or K399Q HA-IRF4. (H) Depiction of custom-made biotin-conjugated IRF4 peptides (aa 379 to 418) in acetylated (K399ac) or non-acetylated (Non-ac) form (upper), and their interaction with FLAG-p62 expressed in HEK293T cells (lower). (I) CBP, ACSS2, and IRF4 protein in immunoprecipitates of lysates from shCtrl- or shACSS2-expressing myeloma cells. (J) Immunoprecipitates of lysates from HA-IRF4–expressing myeloma cells treated with 10 μM C646 (immunoblotting: anti-Ac-K or anti-HA). (K) HA-IRF4 and Ac-K levels in the reactive products from in vitro acetylation assays and Ponceau S-stained CBP-CD bands on PVDF membrane. (L-M) Ac-K and biotin spots in dot blotting (L) and the relative fluorescent units measuring acetyltransferase activity (M) when CBP-CD was incubated with custom Non-Ac or K399ac IRF4 peptides. (N) Dot blotting shows the specificity of custom-made antibody (K399ac) for acetylated IRF4 peptide. (O) IP of lysates from HA-IRF4–expressing myeloma cells treated with 10 μM ACSS2i or 10 μM C646 [immunoblotting: anti-IRF4 (K399ac) or anti-HA]. (P) Relative colony formation (upper) and IRF4 protein level (lower) in ARP-1 cells cultured in AD-CM with or without ACSS2i or C646. Data shown as mean ± SD (****P < 0.0001).
Figure 7.
Figure 7.. The levels of IRF4 protein and its target genes are correlated with ACSS2 expression in myeloma-bearing mice and human patients.
(A-B) ACSS2 and IRF4 protein levels (A) or Acss2, Irf4, Whsc1, Pim2, Ldha, Myc, and Prdm1 mRNAs (B) in myeloma cells isolated from bone marrow of DIO or ND mice that were intrafemorally injected with Vk12598 cells with or without ACSS2i treatment. (C) IRF4 mRNAs in patients’ myeloma cells (n=18) or IRF4 H-scores of patients’ bone marrow biopsies (n=13) immunohistochemically stained with antibodies against IRF4, ACSS2, or CD138. (D-F) Correlation coefficients between the levels of IRF4 mRNAs or IRF4 H-scores in myeloma cells and patients’ BMIs (D), IRF4 and ACSS2 mRNAs in myeloma cells (E), and IRF4 and ACSS2 H-scores in myeloma cells (F). Blue: BMI < 25 kg/m2; black, BMI 25–30 kg/m2; red, BMI > 30 kg/m2. (G) Immunohistochemistry of ACSS2, IRF4, and CD138 in bone marrow of myeloma patients (BMI=19.11 or 34.8). Scale bars, 50 μm. (H) Correlation coefficients between ACSS2 and IRF4 target genes in myeloma cells from patients’ bone marrow (n=18). Data shown as mean ± SD (ns, non-significant; *P < 0.05; **P < 0.01). See also Table S1.

References

    1. Azizi M, and Menard J (2004). Combined blockade of the renin-angiotensin system with angiotensin-converting enzyme inhibitors and angiotensin II type 1 receptor antagonists. Circulation 109, 2492–2499. - PubMed
    1. Bianchini F, Kaaks R, and Vainio H (2002). Overweight, obesity, and cancer risk. Lancet Oncology 3, 565–574. - PubMed
    1. Billet S, Aguilar F, Baudry C, and Clauser E (2008). Role of angiotensin II AT1 receptor activation in cardiovascular diseases. Kidney Int 74, 1379–1384. - PubMed
    1. Birmann BM, Giovannucci E, Rosner B, Anderson KC, and Colditz GA (2007). Body mass index, physical activity, and risk of multiple myeloma. Cancer Epidemiol Biomarkers Prev 16, 1474–1478. - PMC - PubMed
    1. Blair CK, Cerhan JR, Folsom AR, and Ross JA (2005). Anthropometric characteristics and risk of multiple myeloma. Epidemiology 16, 691–694. - PubMed

Publication types