. 2021 Jan 5;34(1):108572.
doi: 10.1016/j.celrep.2020.108572.

ApoE4 Impairs Neuron-Astrocyte Coupling of Fatty Acid Metabolism

Affiliations

ApoE4 Impairs Neuron-Astrocyte Coupling of Fatty Acid Metabolism

Guoyuan Qi et al. Cell Rep. .

Abstract

Alzheimer's disease (AD) risk gene ApoE4 perturbs brain lipid homeostasis and energy transduction. However, the cell-type-specific mechanism of ApoE4 in modulating brain lipid metabolism is unclear. Here, we describe a detrimental role of ApoE4 in regulating fatty acid (FA) metabolism across neuron and astrocyte in tandem with their distinctive mitochondrial phenotypes. ApoE4 disrupts neuronal function by decreasing FA sequestering in lipid droplets (LDs). FAs in neuronal LDs are exported and internalized by astrocytes, with ApoE4 diminishing the transport efficiency. Further, ApoE4 lowers FA oxidation and leads to lipid accumulation in both astrocyte and the hippocampus. Importantly, diminished capacity of ApoE4 astrocytes in eliminating neuronal lipids and degrading FAs accounts for their compromised metabolic and synaptic support to neurons. Collectively, our findings reveal a mechanism of ApoE4 disruption to brain FA and bioenergetic homeostasis that could underlie the accelerated lipid dysregulation and energy deficits and increased AD risk for ApoE4 carriers.

Keywords: ApoE4; astrocyte; fatty acid metabolism; lipid droplet; lipid transport; metabolic coupling; mitochondria; neuron.


Conflict of interest statement

Declaration of Interests The authors declare no competing interests.

Figures

Figure 1.
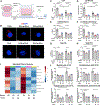
Figure 1.. ApoE4 Decreases Neuronal Lipid Sequestering in Lipid Droplets
(A) Cropped images of DIV8 hippocampal neurons from ApoE3 and ApoE4 mice (E17) immunostained for LD, DAPI, and MAP-2 (upper panel) or Plin2 (lower panel). (B and C) Number and volume of LDs per individual neuron on DIV0, DIV4, and DIV8. (D) Distribution of LD sizes in DIV8 neurons binned between 0 and 1 μm3. (E) Representative TEM images of DIV8 neurons showing LDs (asterisk) and mitochondria (arrow). (F) Total free FA levels in DIV8 neurons, n = 4. (G) Schematic diagram of FA and LD metabolism-related pathways and inhibitors. (H) LD volume in E3 and E4 neurons pretreated with MAFP, ND-630, TC, or vehicle for 12 h. (I) Representative images showing protein levels of p-AMPKThr172, AMPK, p-ACC, ACC, SREBP-1c, FAS, and PPAR-γ in neurons (n = 4–6, quantified in Figure S1J). (J) E3 neurons treated with AICAR, Compound C, or vehicle for 12 h were quantified for LD. (K) E3 and E4 neurons treated with 3-MA or vehicle for 12 h were quantified for LD. Data are presented as mean ± SEM. *p < 0.05, **p < 0.01. Data across all figures were from at least 3 animals or independent batches of cell cultures. For image-based quantifications in all figures, each data point represents the averaged value across all cells on a coverslip; n = 6–9 coverslips/condition, 8 ± 2 cells/coverslip. Scale bars, 10 μm (A); 500 nm (E). See also Figure S1.
Figure 2.
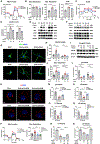
Figure 2.. ApoE4 Neurons Exhibit Impaired Bioenergetic Function and Neurite Outgrowth
(A) Protein levels of ApoE in DIV8 E3 and E4 neurons (quantified in Figure S2A). (B and C) Mitochondrial stress test performed on E3 and E4 neurons with sequential injections of mitochondrial inhibitors including oligomycin A, FCCP, and rotenone+antimycin A; basal and maximal respiration and spare capacity ratio (SCR) were determined. (D) Mitochondrial membrane potential in neurons (n = 5). (E) ATP levels in neurons (n = 5). (F and G) Representative images for protein levels of mitochondrial complexes I–V subunits and PGC-1α and PGC-1β in neurons (quantified in Figures S2C and S2D). (H) Representative TEM images of mitochondria (arrows) in neurons. (I and J) Mitochondrial stress test performed on E3 neurons ± TC for 12 h; basal respiration and maximal respiration are shown. (K) Glucose uptake capacity of E3 and E4 neurons. (L) Mitochondrial stress test in E3 and E4 neurons supplied with glucose alone (25 mM) or glucose (25 mM) + pyruvate (1 mM); maximal respiration capacity is shown. (M) Confocal images of neurons immunostained for MAP2. (N) Length, branch count, and area of neurites in neurons; n = 8 coverslips/condition, 8 ± 2 cells/coverslip. (O) Representative images of PSD-95 and SNAP-25 protein expression in neurons (quantified in Figure S2E). Data are presented as mean ± SEM. *p < 0.05, **p < 0.01. For Seahorse assays across all figures, data shown are representative results of 3 independent experiments. Scale bars, 500 nm (H); 20 μm (M). See also Figure S2.
Figure 3.
Figure 3.. ApoE4 Astrocytes Are Less Capable to Clear Neuronal Lipid Droplets
(A) Schematic diagram of neuron-astrocyte co-culture system. (B–D) LD in DIV0 E3 and E4 neurons cultured alone or co-cultured with either E3 or E4 astrocytes for 8 days. (E and F) LD in DIV8 neurons cultured alone or co-cultured with astrocytes for 48 h. (G and H) Total levels of triacylglycerol (TAG) and FAs in neurons cultured alone or co-cultured with astrocytes for 8 days. (I) Heatmap of a panel of saturated, medium to long-chain free FAs in neurons cultured alone or co-cultured with astrocytes (n = 3). (J) Levels of myristic acid (C14), pentadecanoic acid (C15), heptadecanoic acid (C17), and non-adecanoic acid (C19) in neurons following co-culture by targeted metabolomics. Data are presented as mean ± SEM. *p < 0.05, **p < 0.01. For image-based quantifications, n = 5–7 coverslips/condition, 8 ± 2 cells/coverslip. Scale bars, 5 μm (B). See also Figure S3.
Figure 4.
Figure 4.. Transfer of FA from Neuron to Astrocyte Is Compromised by ApoE4
(A) Schematic diagram of neuron-astrocyte pulse-chase assay to trace FA trafficking in (B)–(F). (B) Cropped images of neurons incubated with BODIPY-C12 for 16 h followed by co-staining for LD. (C) Cropped images of E3 astrocytes co-cultured with BODIPY-C12-labeled E3 neurons for 4 h and co-stained for LD. (D) Percentage of BODIPY-C12 positive cells in E3 or E4 astrocytes co-cultured with labeled E3 or E4 neurons for 4 h. (E) Percentage of BODIPY-C12 positive cells in E3 astrocytes co-cultured with labeled E3 or E4 neurons with or without pre-treatment of BFA. (F) Percentage of BODIPY-C12 positive cells in E3 or E4 astrocytes co-cultured with labeled E3 neurons with or without pre-treatment of Pistop2. (G) Levels of myristic acid (C14), palmitic acid (C16), and stearic acid (C18) in astrocytes cultured alone or with neurons (n = 3). (H–K) mRNA and protein levels of ApoE in astrocytes and neurons after co-culture for 8 days (n = 3–4, quantified in Figures S3G and S3H). (L) ApoE levels in the medium of individual or co-culture systems (n = 4). Data are presented as mean ± SEM. *p < 0.05, **p < 0.01. For pulse-chase assays, n = 4 coverslips/condition, 4 images/coverslip. Scale bars, 5 μm (B and C). See also Figure S3.
Figure 5.
Figure 5.. ApoE4 Astrocytes Are Less Capable in Supporting Metabolic and Synaptic Functions of Neurons
(A and B) Mitochondrial respiration of E3 neurons cultured alone or with E3 or E4 astrocytes for 8 days; quantifications are shown in (B). (C) ECAR of E3 neurons cultured alone or co-cultured with astrocytes as in (A) and (B). (D) Lactate levels in neurons cultured alone or with astrocytes (n = 3). (E) Representative images for protein levels of HK1, HK2, p-PDHSer293, and PDH in neurons cultured alone or with astrocytes (quantified in Figure S4E). (F) Representative images for protein levels of p-AKT, AKT, PGC-1α, and PGC-1β in neurons cultured alone or with astrocytes (quantified in Figure S4F). (G and H) Cropped images of neurons cultured alone or with astrocytes and immunostained for MAP2 (G); neurite length is quantified in (H). (I) Representative images for protein levels of PSD-95 and SNAP-25 in neurons cultured alone or with astrocytes (quantified in Figure S4I). (J) Mitochondrial maximal respiration of DIV8 neurons cultured with or without different astrocyte conditional medium (ACM) for 48 h. (K and L) Cropped images and quantification of LD volumes in DIV8 neurons cultured with or without ACM for 48 h. (M–O) LD volume in E3 neurons treated with vehicle, E3 ACM, or E3 ACM+atglistatin (M), E3 ACM+3-MA (N), or E3 ACM+BFA (O) for 12 h. (P) Mitochondrial maximal respiration in E3 neurons treated with E3 ACM, BFA, E3 ACM+BFA, or vehicle for 12 h. (Q) LD volume in E3 neurons treated with E3 ACM, FCCP, E3 ACM+FCCP, or vehicle for 12 h. (R) LD volume in E3 neurons treated with E3 ACM, E3 ACM+rApoE3, or E3 ACM+rApoE4 for 24 h. (S) LD volume in ApoE3 neurons treated with E4 ACM, E4 ACM+rApoE3, or E4 ACM+rApoE4 for 24 h. Data are presented as mean ± SEM. *p < 0.05, **p < 0.01. For image-based quantifications, n = 3–8 coverslips/condition, 8 ± 2 cells/coverslip. Scale bars, 20 μm (G); 5 μm (K). See also Figure S4.
Figure 6.
Figure 6.. ApoE4 Alters Mitochondrial Phenotype, Suppresses Fatty Acid Degradation, and Accumulates Lipid Droplets in Astrocytes
(A) Cropped images of astrocytes isolated from E3 and E4 mice and immunostained for LD (upper panel) or co-stained for Plin2 (lower panel). (B) LD volume in E3 or E4 astrocytes. (C) Distribution of LD sizes in astrocytes binned between 0 and 1 μm3. (D) LD volume in astrocytes treated with 3-MA, TC, ND-630, or vehicle for 12 h. (E and F) Exogenous FA-induced mitochondrial respiration in astrocytes was determined after supplying palmitoyl-BSA or BSA. (G) LD volume in astrocytes treated with FCCP or vehicle for 12 h. (H) Mitochondrial fuel flex test in astrocytes with the addition of inhibitors to glucose (mitochondrial pyruvate carrier inhibitor UK5099), glutamine (glutaminase inhibitor BPTES), and FA (CPT1 inhibitor etomoxir) pathways. (I and J) Mitochondrial respiration in astrocytes with basal respiration shown in (J). (K) ECAR in astrocytes. (L and M) Representative images for expression of mitochondrial complex subunits and HK1 in astrocytes (quantified in Figures S5E and S5F). (N) ATP levels in astrocytes. (O) Representative images for p-AMPKThr172 and AMPK levels in astrocytes (quantified in Figure S5G). (P) Representative cropped confocal images of mitochondria reticulum in astrocytes. (Q) Representative TEM images of mitochondrial structures in astrocytes. (R) Ratio of fission products to fusion products in astrocytes by subtype analysis of mitochondria reticulum images. (S) Representative images for protein expression of Drp1 and OPA1 in astrocytes (quantified in Figure S5J). Data are presented as mean ± SEM. *p < 0.05, **p < 0.01. For image-based quantifications, n = 6–10 coverslips/condition, 8 ± 2 cells/coverslip. Scale bars, 10 μm (A and P); 500 nm (Q). See also Figure S5.
Figure 7.
Figure 7.. ApoE4 Diminishes FA Oxidation, Elevates Triacylglycerol Levels, and Promotes Glucose Metabolism in Mouse Hippocampus
(A) Schematic diagram to determine metabolic phenotype in acute hippocampal slices. (B–E) Mitochondrial respiration of hippocampal slices with 10 mM glucose but no exogenous FA (B), no exogenous glucose or FA (C), 150 μM oleate-BSA but no glucose (D), or 10 mM glucose + 150 μM oleate-BSA (E). (F and G) Acidification rate in hippocampal slices without (F) or with (G) exogenous FA (with 0 or 10 mM glucose). (H) Total TAG levels in E3 and E4 mouse hippocampi. Data are presented as mean ± SEM. *p < 0.05, **p < 0.01. (B–G) n = 12 slices from 3 animals; (H) n = 5 animals.

References

    1. Barber CN, and Raben DM (2019). Lipid Metabolism Crosstalk in the Brain: Glia and Neurons. Front. Cell. Neurosci 13, 212. - PMC - PubMed
    1. Batiuk MY, de Vin F, Duqué SI, Li C, Saito T, Saido T, Fiers M, Belgard TG, and Holt MG (2017). An immunoaffinity-based method for isolating ultrapure adult astrocytes based on ATP1B2 targeting by the ACSA-2 antibody. J. Biol. Chem 292, 8874–8891. - PMC - PubMed
    1. Bélanger M, Allaman I, and Magistretti PJ (2011). Brain energy metabolism: focus on astrocyte-neuron metabolic cooperation. Cell Metab. 14, 724–738. - PubMed
    1. Belloy ME, Napolioni V, and Greicius MD (2019). A Quarter Century of APOE and Alzheimer’s Disease: Progress to Date and the Path Forward. Neuron 101, 820–838. - PMC - PubMed
    1. Benador IY, Veliova M, Liesa M, and Shirihai OS (2019). Mitochondria Bound to Lipid Droplets: Where Mitochondrial Dynamics Regulate Lipid Storage and Utilization. Cell Metab. 29, 827–835. - PMC - PubMed

Publication types