

Multi-Elemental Analysis of Wine Samples in Relation to Their Type, Origin, and Grape Variety
- PMID: 33406611
- PMCID: PMC7795369
- DOI: 10.3390/molecules26010214
Multi-Elemental Analysis of Wine Samples in Relation to Their Type, Origin, and Grape Variety
Abstract
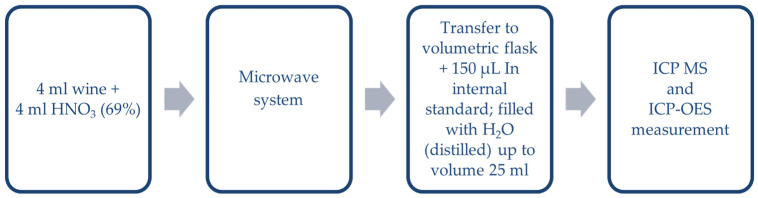
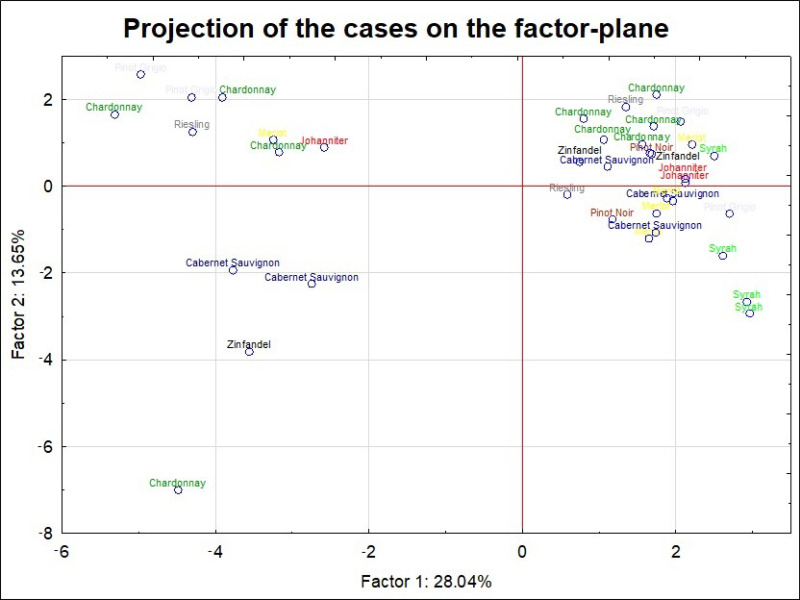
Wine is one of the most popular alcoholic beverages. Therefore, the control of the elemental composition is necessary throughout the entire production process from the grapes to the final product. The content of some elements in wine is very important from the organoleptic and nutritional points of view. Nowadays, wine studies have also been undertaken in order to perform wine categorization and/or to verify the authenticity of products. The main objective of this research was to evaluate the influence of the chosen factors (type of wine, producer, origin) on the levels of 28 elements in 180 wine samples. The concentration of studied elements was determined by ICP-MS (Ag, B, Ba, Be, Bi, Cd, Co, Cr, Cu, Li, Mn, Mo, Ni, Pb, Rb, Sb, Sn, Sr, Te, Tl, U, Zn), ICP-OES (Ca, Fe, K, Mg, Ti), and CVAAS (Hg) techniques in 79 red, 75 white, and 26 rose wine samples. In general, red wines contained higher values of mean and median of B, Ba, Cr, Cu, Mn, Sr and Zn in contrast to other wine types (white and rose). In white wines (when compared to red and rose wines) higher levels of elements such as Ag, Be, Bi, Cd, Co, Li, K and Ti were determined. In contrast, rose wines were characterized by a higher concentration of Fe and U. The study also revealed that in the case of 18 samples, the maximum levels of some metals (Cd-8 samples, Pb-9 samples, Cu-1 sample) were slightly exceeded according to the OIV standards, while for Zn and Ti in any wine sample the measured concentrations of these metals were above the permissible levels. Thus, it can be stated that the studied wines contained, in general, lower levels of heavy metals, suggesting that they should have no effect on the safety of consumption. The results also showed higher pH level for red wines as a consequence of the second fermentation process which is typically carried out for this type of wine (malolactic fermentation). The highest median value of pH was reported for Merlot-based wines, while the lowest was for Riesling. It is assumed that dry Riesling has a higher content of tartaric and malic acid than dry Chardonnay grown in the same climate. From all of the studied countries, wines from Poland seemed to present one of the most characteristic elemental fingerprints since for many elements relatively low levels were recorded. Moreover, this study revealed that also wine samples from USA and Australia can be potentially discriminated from the rest of studied wines. For USA the most characteristic metal for positive identification of the country of origin seems to be uranium, whereases for Australia - strontium and manganese. Based on the highly reduced set of samples, it was not possible to differentiate the studied wine products according to the grape variety other than Syrah, and partially Chardonnay. Since all the Syrah-based samples originated from the same country (Australia) thus, the observed grouping should be more related with the country of origin than the grape variety.
Keywords: CVAAS; ICP-MS; ICP-OES; PCA; beverages; multi-elemental analysis; trace elements; wine samples.
Conflict of interest statement
The authors declare no conflict of interest.
Figures


Similar articles
-
Determination of Metal Content by Inductively Coupled Plasma-Mass Spectrometry in Polish Red and White Wine Samples in Relation to Their Type, Origin, Grape Variety and Health Risk Assessment.Foods. 2023 Aug 25;12(17):3205. doi: 10.3390/foods12173205. Foods. 2023. PMID: 37685138 Free PMC article.
-
Multielement composition of wines and their precursors including provenance soil and their potentialities as fingerprints of wine origin.J Agric Food Chem. 2003 Jul 30;51(16):4788-98. doi: 10.1021/jf034145b. J Agric Food Chem. 2003. PMID: 14705914
-
Searching the most appropriate sample pretreatment for the elemental analysis of wines by inductively coupled plasma-based techniques.J Agric Food Chem. 2008 Jul 9;56(13):4943-54. doi: 10.1021/jf800286y. Epub 2008 Jun 14. J Agric Food Chem. 2008. PMID: 18553915
-
Medical application of laser-induced breakdown spectroscopy (LIBS) for assessment of trace element and mineral in biosamples: Laboratory and clinical validity of the method.J Trace Elem Med Biol. 2023 Sep;79:127241. doi: 10.1016/j.jtemb.2023.127241. Epub 2023 Jun 12. J Trace Elem Med Biol. 2023. PMID: 37393771 Review.
-
Analysis of Wine and Its Use in Tracing the Origin of Grape Cultivation.Crit Rev Anal Chem. 2022;52(8):1901-1912. doi: 10.1080/10408347.2021.1925082. Epub 2021 Jun 1. Crit Rev Anal Chem. 2022. PMID: 34061694 Review.
Cited by
-
Assessment of the Authenticity of Whisky Samples Based on the Multi-Elemental and Multivariate Analysis.Foods. 2022 Sep 12;11(18):2810. doi: 10.3390/foods11182810. Foods. 2022. PMID: 36140938 Free PMC article.
-
The Elemental Profile of Beer Available on Polish Market: Analysis of the Potential Impact of Type of Packaging Material and Risk Assessment of Consumption.Molecules. 2022 May 5;27(9):2962. doi: 10.3390/molecules27092962. Molecules. 2022. PMID: 35566304 Free PMC article.
-
Characterization of Semisweet and Sweet Wines from Kos Island Produced Traditionally and Conventionally.Foods. 2023 Oct 13;12(20):3762. doi: 10.3390/foods12203762. Foods. 2023. PMID: 37893655 Free PMC article.
-
Elemental composition, rare earths and minority elements in organic and conventional wines from volcanic areas: The Canary Islands (Spain).PLoS One. 2021 Nov 3;16(11):e0258739. doi: 10.1371/journal.pone.0258739. eCollection 2021. PLoS One. 2021. PMID: 34731184 Free PMC article.
-
Determination of Metal Content by Inductively Coupled Plasma-Mass Spectrometry in Polish Red and White Wine Samples in Relation to Their Type, Origin, Grape Variety and Health Risk Assessment.Foods. 2023 Aug 25;12(17):3205. doi: 10.3390/foods12173205. Foods. 2023. PMID: 37685138 Free PMC article.
References
-
- Rodrigues S.M., Otero M., Alves A., Coimbra J. Elemetal analysis for categorization of wines and authentication of their certified brand of origin. J. Food Compos. Anal. 2011;24:548–562. doi: 10.1016/j.jfca.2010.12.003. - DOI
-
- Dragusha B., Zogaj M., Ramadani X., Susaj L. Determination of some heavy metals in some wines of Kosovo. Int. J. Ecosyst. Ecol. Sci. 2017;7:635–638.
-
- Fabain M.P., Arrúa R.C., Vazquez F., Diaz M.P., Baroni M.V., Wunderlin D.A. Evaluation of elemental profile coupled to chemometrics to assess the geographical origin of Argentinean wines. Food Chem. 2010;1:372–379. doi: 10.1016/j.foodchem.2009.05.085. - DOI
MeSH terms
Substances
LinkOut - more resources
Full Text Sources
Other Literature Sources
Research Materials
