

SPServer: split-statistical potentials for the analysis of protein structures and protein-protein interactions
- PMID: 33407073
- PMCID: PMC7788957
- DOI: 10.1186/s12859-020-03770-5
SPServer: split-statistical potentials for the analysis of protein structures and protein-protein interactions
Abstract
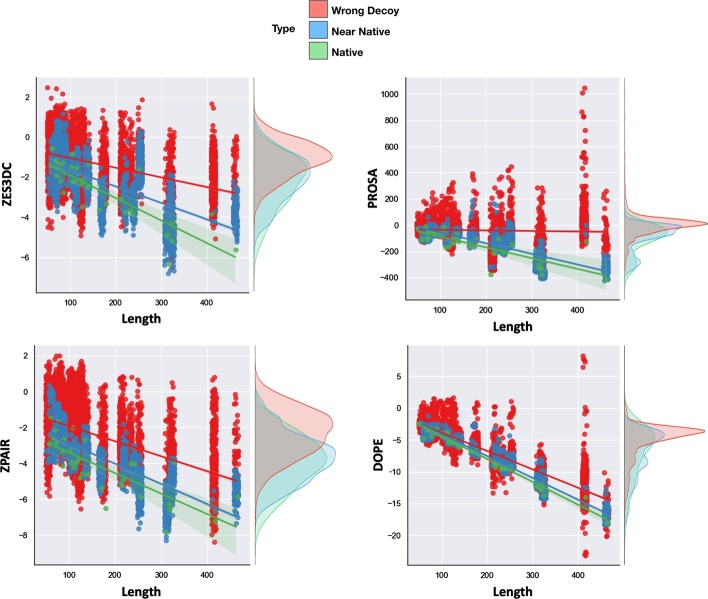
Background: Statistical potentials, also named knowledge-based potentials, are scoring functions derived from empirical data that can be used to evaluate the quality of protein folds and protein-protein interaction (PPI) structures. In previous works we decomposed the statistical potentials in different terms, named Split-Statistical Potentials, accounting for the type of amino acid pairs, their hydrophobicity, solvent accessibility and type of secondary structure. These potentials have been successfully used to identify near-native structures in protein structure prediction, rank protein docking poses, and predict PPI binding affinities.
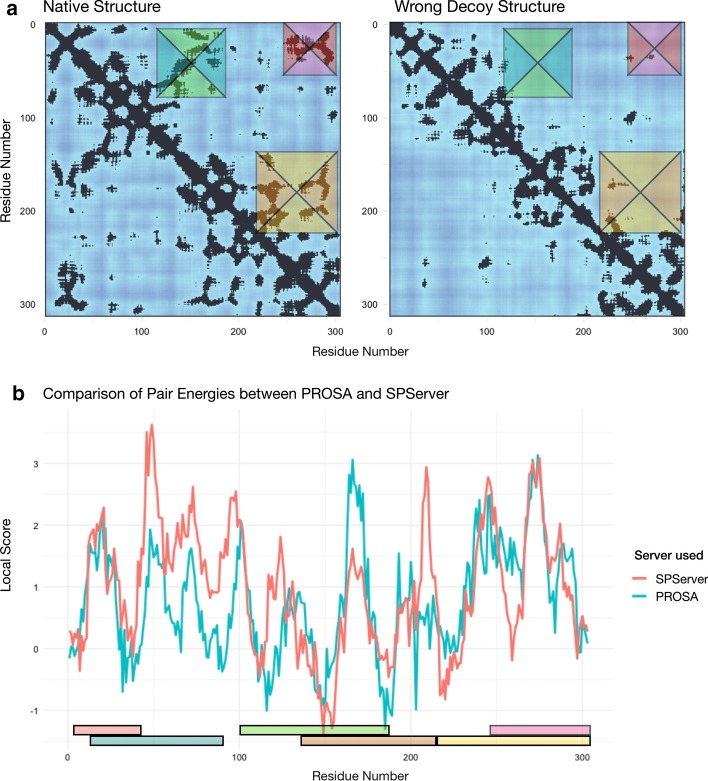
Results: Here, we present the SPServer, a web server that applies the Split-Statistical Potentials to analyze protein folds and protein interfaces. SPServer provides global scores as well as residue/residue-pair profiles presented as score plots and maps. This level of detail allows users to: (1) identify potentially problematic regions on protein structures; (2) identify disrupting amino acid pairs in protein interfaces; and (3) compare and analyze the quality of tertiary and quaternary structural models.
Conclusions: While there are many web servers that provide scoring functions to assess the quality of either protein folds or PPI structures, SPServer integrates both aspects in a unique easy-to-use web server. Moreover, the server permits to locally assess the quality of the structures and interfaces at a residue level and provides tools to compare the local assessment between structures. SERVER ADDRESS: https://sbi.upf.edu/spserver/ .
Keywords: Knowledge-based potential; Protein structure evaluation; Protein structure prediction; Protein structure quality assessment; Protein–protein evaluation; Protein–protein interaction.
Conflict of interest statement
Baldo Oliva is member of the Editorial Board of this journal. The rest of authors have no other competing interest.
Figures

References
-
- Fornes O, Garcia-Garcia J, Bonet J, Oliva B. On the use of knowledge-based potentials for the evaluation of models of protein-protein, protein-DNA, and protein-RNA interactions. In: Advances in protein chemistry and structural biology. Elsevier; 2014. p. 77–120. - PubMed
MeSH terms
Substances
Grants and funding
- BIO2017-85329-R (FEDER,UE)/Ministerio de Economía, Industria y Competitividad, Gobierno de España
- BIO2017-83591-R(FEDER,UE/Ministerio de Economía, Industria y Competitividad, Gobierno de España
- RYC-2015-17519/Ministerio de Economía, Industria y Competitividad, Gobierno de España
- MDM-2014-0370/Ministerio de Economía, Industria y Competitividad, Gobierno de España
- FI/Agència de Gestió d'Ajuts Universitaris i de Recerca
LinkOut - more resources
Full Text Sources
Other Literature Sources
