. 2021 Jan 6;22(1):12.
doi: 10.1186/s12859-020-03945-0.

mixIndependR: a R package for statistical independence testing of loci in database of multi-locus genotypes

Affiliations

mixIndependR: a R package for statistical independence testing of loci in database of multi-locus genotypes

Bing Song et al. BMC Bioinformatics. .

Abstract

Background: Multi-locus genotype data are widely used in population genetics and disease studies. In evaluating the utility of multi-locus data, the independence of markers is commonly considered in many genomic assessments. Generally, pairwise non-random associations are tested by linkage disequilibrium; however, the dependence of one panel might be triplet, quartet, or other. Therefore, a compatible and user-friendly software is necessary for testing and assessing the global linkage disequilibrium among mixed genetic data.

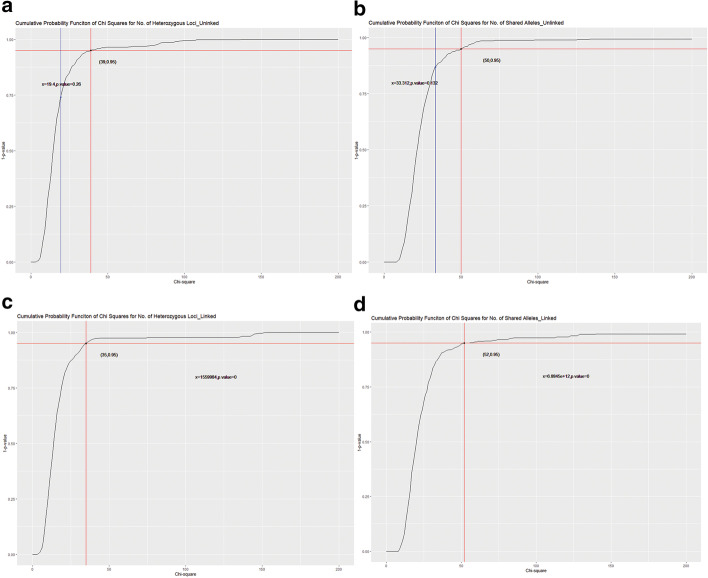
Results: This study describes a software package for testing the mutual independence of mixed genetic datasets. Mutual independence is defined as no non-random associations among all subsets of the tested panel. The new R package "mixIndependR" calculates basic genetic parameters like allele frequency, genotype frequency, heterozygosity, Hardy-Weinberg equilibrium, and linkage disequilibrium (LD) by mutual independence from population data, regardless of the type of markers, such as simple nucleotide polymorphisms, short tandem repeats, insertions and deletions, and any other genetic markers. A novel method of assessing the dependence of mixed genetic panels is developed in this study and functionally analyzed in the software package. By comparing the observed distribution of two common summary statistics (the number of heterozygous loci [K] and the number of share alleles [X]) with their expected distributions under the assumption of mutual independence, the overall independence is tested.

Conclusion: The package "mixIndependR" is compatible to all categories of genetic markers and detects the overall non-random associations. Compared to pairwise disequilibrium, the approach described herein tends to have higher power, especially when number of markers is large. With this package, more multi-functional or stronger genetic panels can be developed, like mixed panels with different kinds of markers. In population genetics, the package "mixIndependR" makes it possible to discover more about admixture of populations, natural selection, genetic drift, and population demographics, as a more powerful method of detecting LD. Moreover, this new approach can optimize variants selection in disease studies and contribute to panel combination for treatments in multimorbidity. Application of this approach in real data is expected in the future, and this might bring a leap in the field of genetic technology.

Availability: The R package mixIndependR, is available on the Comprehensive R Archive Network (CRAN) at: https://cran.r-project.org/web/packages/mixIndependR/index.html .

Keywords: Linkage disequilibrium; Mutual independence; Non-random association; R package; SNPs; STRs.


Conflict of interest statement

The authors declare that they have no competing interests.

Figures

Fig. 1
Fig. 1
Distribution of number of heterozygous loci and shared alleles for unlinked vs fully linked data. The simulated dataset is a mixed genetic panel with 20 STRs and 10 SNPs for 500 random individuals. a, b are the distribution comparisons of number of heterozygous loci and Shared Alleles (non-overlapped pairs) for unlinked data. All STRs and SNPs were generated from different chromosomes randomly. c, d are distribution comparisons of number of heterozygous loci and Shared Alleles (non-overlapped pairs) for linked data. All STRs were from the same chromosome, and all SNPs were from the same chromosome. However, STRs and SNPs were randomly grouped. Red line in plots are curves of expected probabilities
Fig. 2
Fig. 2
Curve of cumulative probability of Chi-square values for number of heterozygous loci or shared alleles. Red line is where the critical value lies for the confidence level of 95%; while the blue one is the test statistic. a, b are figures for unlinked data; c, d are figures for fully linked data. In (c) and (d), the test statistic is far larger than the critical value, and beyond the limit of x-axis
Fig. 3
Fig. 3
Power and significance level (proportion of p values < 0.05) for different levels of linkage. X-axis denotes the number of markers in one panel; Y-axis denotes the proportion of cases when p values < 0.05 out of 1000 cases. For the completely unlinked panels, this proportion means significance level (Type I error) in null hypothesis; for other panels with linkages, this proportion means power (1- type II error) of these two methods. ac are figures of K and df are figures of X. a, d are panels with all linked markers are SNPs; b, e are panels with all linked markers on STRs; c, f are panels with equal number of linked SNPs and STRs. In condition, power increases with panel size extends; linkage on SNPs contributes more power than STRs; and K shows more power than X. For SNP-biased (linkage on SNPs) panels, dependency can be detected when linkage is quarter-linked or more; but for STR-biased panels, only three-quarter-linked and almost -linked panels can be tested as dependent panels. In unbiased panels, half-quarter-linkage are also hardly to be detected
Fig. 4
Fig. 4
Power and significance level comparison between summary statistics and traditional LD test. Comparison among K, X, and pairwise LD calculated by R package genetics. K denotes number of heterozygous loci; X denotes number of shared alleles; Pairwise LD denotes the results from the function LD of package genetics
Fig. 5
Fig. 5
Comparison of K or X and pairwise LD in real data. Four panels designed from real dataset by variant pruning with threshold 0.2, 0.4, 0.6 and 0.8 are tested in pairwise LD and summary statistic K and X. In each panel, there are 2067, 3157, 4278 and 5754 variants, respectively. a is the boxplot excluding outliers of r2 values for each panel. With the threshold increasing (x-axis denotes the groups), the boxplot lifts but major parts remain under 0.2. b is the power of pairwise LD by GDA, K, and X in multiple trials (10 trials for GDA, 1000 trials for K or X) for 100 random markers from each panel. On each new trial, the markers were re-selected. Y-axis shows the proportion of significant p values on each panel. The number of trials for GDA is small due to the time-consuming of this software. The power in this method might not be accurate. Average proportions for significant p values in method GDA is: 0.047 (0.2 group); 0.041 (0.4 group), 0.054 (0.6 group), 0.040 (0.8 group)
Fig. 6
Fig. 6
Pipeline of mixIndependR. Functions are presented in the grey boxes, and the results are in dark red boxes. The same function in different paths use different logic parameters. Crossed paths share input parameters

References

    1. Butler JM, Coble MD, Vallone PM. STRs vs. SNPs: thoughts on the future of forensic DNA testing. Forensic Sci Med Pathol. 2007;3(3):200–205. - PubMed
    1. Wei T, Liao F, Wang Y, Pan C, Xiao C, Huang D. A novel multiplex assay of SNP-STR markers for forensic purpose. PLoS ONE. 2018;13(7):e0200700. - PMC - PubMed
    1. Wang L, He W, Mao J, Wang H, Jin B, Luo HB, Liang WB, Zhang L. Development of a SNP-STRs multiplex for forensic identification. Forensic Sci Int Genet Suppl Ser. 2015;5:e598–e600.
    1. Edge MD, Algee-Hewitt BFB, Pemberton TJ, Li JZ, Rosenberg NA. Linkage disequilibrium matches forensic genetic records to disjoint genomic marker sets. Proc Natl Acad Sci USA. 2017;114(22):5671–5676. - PMC - PubMed
    1. Schulze TG, Chen YS, Akula N, Hennessy K, Badner JA, McInnis MG, DePaulo JR, Schumacher J, Cichon S, Propping P, et al. Can long-range microsatellite data be used to predict short-range linkage disequilibrium? Hum Mol Genet. 2002;11(12):1363–1372. - PubMed

LinkOut - more resources