

Ordinal outcome analysis improves the detection of between-hospital differences in outcome
- PMID: 33407167
- PMCID: PMC7788719
- DOI: 10.1186/s12874-020-01185-7
Ordinal outcome analysis improves the detection of between-hospital differences in outcome
Abstract
Background: There is a growing interest in assessment of the quality of hospital care, based on outcome measures. Many quality of care comparisons rely on binary outcomes, for example mortality rates. Due to low numbers, the observed differences in outcome are partly subject to chance. We aimed to quantify the gain in efficiency by ordinal instead of binary outcome analyses for hospital comparisons. We analyzed patients with traumatic brain injury (TBI) and stroke as examples.
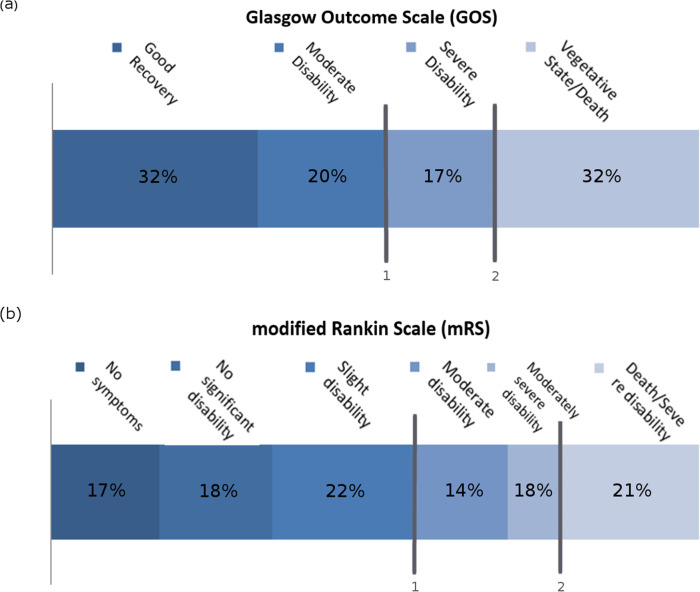
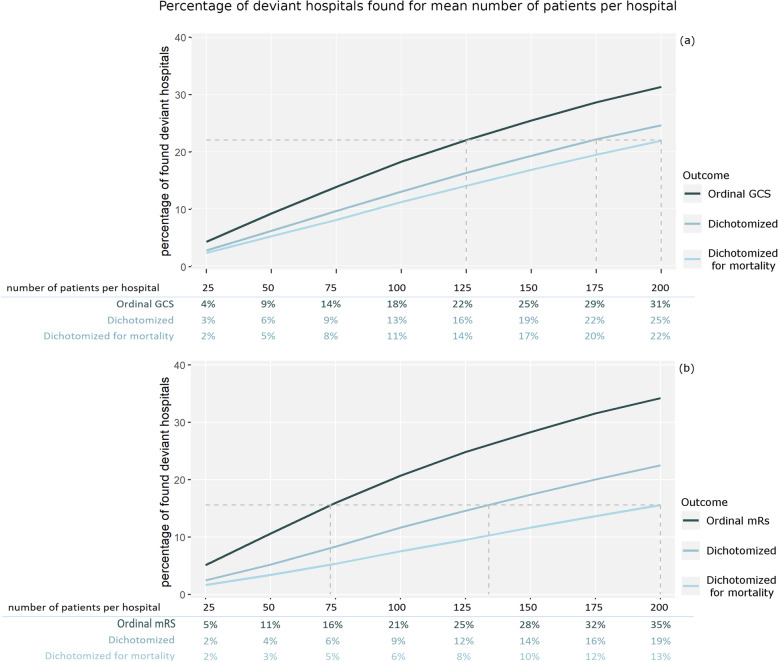
Methods: We sampled patients from two trials. We simulated ordinal and dichotomous outcomes based on the modified Rankin Scale (stroke) and Glasgow Outcome Scale (TBI) in scenarios with and without true differences between hospitals in outcome. The potential efficiency gain of ordinal outcomes, analyzed with ordinal logistic regression, compared to dichotomous outcomes, analyzed with binary logistic regression was expressed as the possible reduction in sample size while keeping the same statistical power to detect outliers.
Results: In the IMPACT study (9578 patients in 265 hospitals, mean number of patients per hospital = 36), the analysis of the ordinal scale rather than the dichotomized scale ('unfavorable outcome'), allowed for up to 32% less patients in the analysis without a loss of power. In the PRACTISE trial (1657 patients in 12 hospitals, mean number of patients per hospital = 138), ordinal analysis allowed for 13% less patients. Compared to mortality, ordinal outcome analyses allowed for up to 37 to 63% less patients.
Conclusions: Ordinal analyses provide the statistical power of substantially larger studies which have been analyzed with dichotomization of endpoints. We advise to exploit ordinal outcome measures for hospital comparisons, in order to increase efficiency in quality of care measurements.
Trial registration: We do not report the results of a health care intervention.
Keywords: Benchmarking; Between-hospital variation; Comparative effectiveness research; Observational data; Ordinal outcome analysis; Proportional odds analysis; Statistical power.
Conflict of interest statement
The authors declare that they have no competing interests.
Figures


References
-
- Krumholz HM, Lin Z, Normand S-LT. Measuring hospital clinical outcomes. 2013. - PubMed
-
- Lingsma HF, Roozenbeek B, Li B, Lu J, Weir J, Butcher I, et al. Large between-center differences in outcome after moderate and severe traumatic brain injury in the international mission on prognosis and clinical trial design in traumatic brain injury (IMPACT) study. Neurosurgery. 2011;68:601–607. doi: 10.1227/NEU.0b013e318209333b. - DOI - PubMed
MeSH terms
LinkOut - more resources
Full Text Sources
Other Literature Sources
Medical
