. 2021 Jan 6;40(1):14.
doi: 10.1186/s13046-020-01812-7.

Thrombospondin 4/integrin α2/HSF1 axis promotes proliferation and cancer stem-like traits of gallbladder cancer by enhancing reciprocal crosstalk between cancer-associated fibroblasts and tumor cells

Affiliations

Thrombospondin 4/integrin α2/HSF1 axis promotes proliferation and cancer stem-like traits of gallbladder cancer by enhancing reciprocal crosstalk between cancer-associated fibroblasts and tumor cells

Yu Shi et al. J Exp Clin Cancer Res. .

Abstract

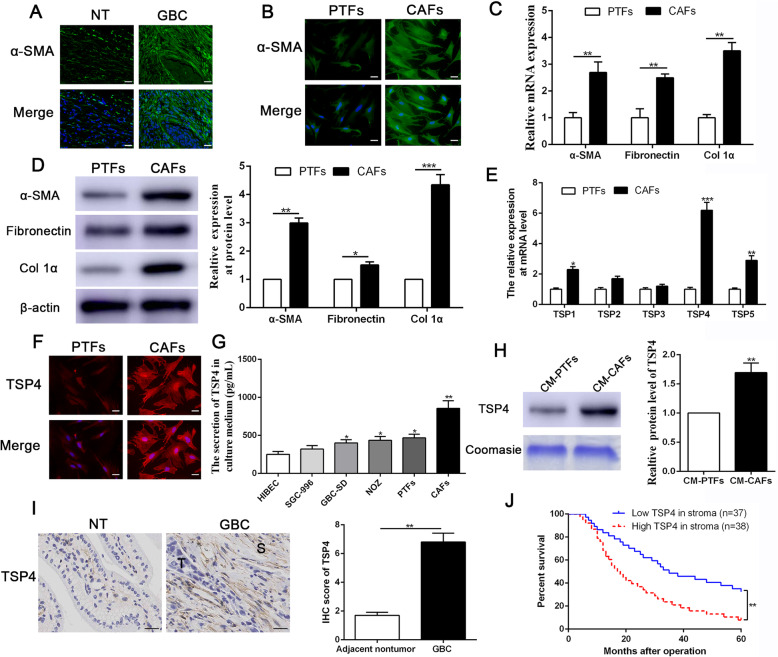
Background: Cancer-associated fibroblasts (CAFs), the primary component of tumor stroma in tumor microenvironments, are well-known contributors to the malignant progression of gallbladder cancer (GBC). Thrombospondins (THBSs or TSPs) comprise a family of five adhesive glycoproteins that are overexpressed in many types of cancers. However, the expression and potential roles of TSPs in the crosstalk between CAFs and GBC cells has remained unclear.

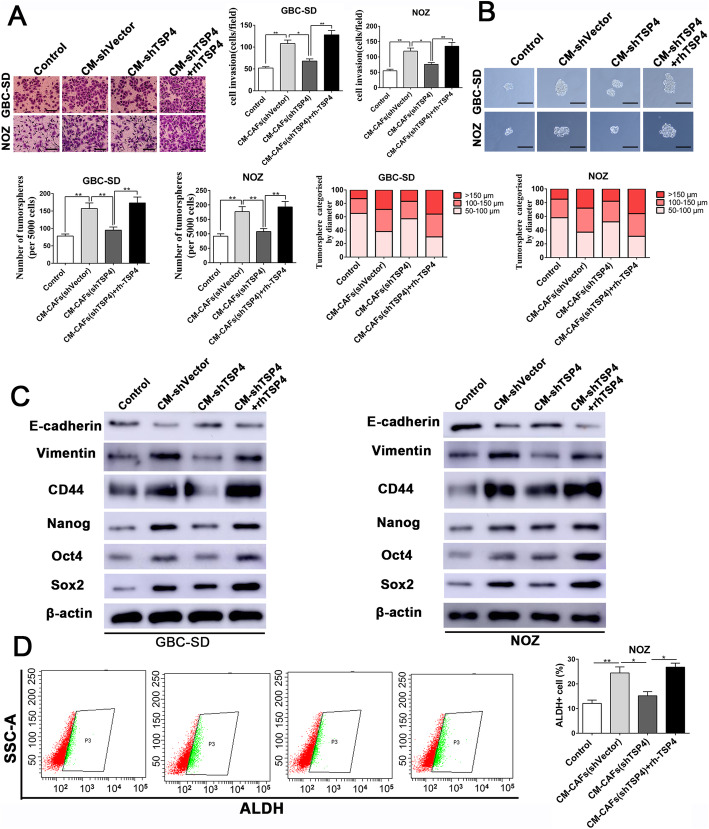
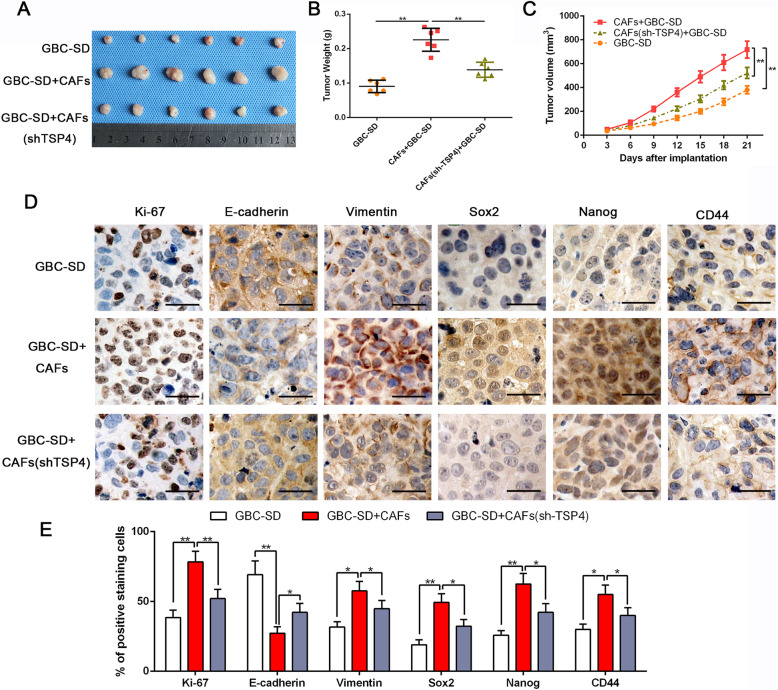
Methods: Peritumoral fibroblasts (PTFs) and CAFs were extracted from GBC tissues. Thrombospondin expression in GBC was screened by RT-qPCR. MTT viability assay, colony formation, EdU incorporation assay, flow cytometry analysis, Transwell assay, tumorsphere formation and western blot assays were performed to investigate the effects of CAF-derived TSP-4 on GBC cell proliferation, EMT and cancer stem-like features. Subcutaneous tumor formation models were established by co-implanting CAFs and GBC cells or GBC cells overexpressing heat shock factor 1 (HSF1) to evaluate the roles of TSP-4 and HSF1 in vivo. To characterize the mechanism by which TSP-4 is involved in the crosstalk between CAFs and GBC cells, the levels of a variety of signaling molecules were detected by coimmunoprecipitation, immunofluorescence staining, and ELISA assays.

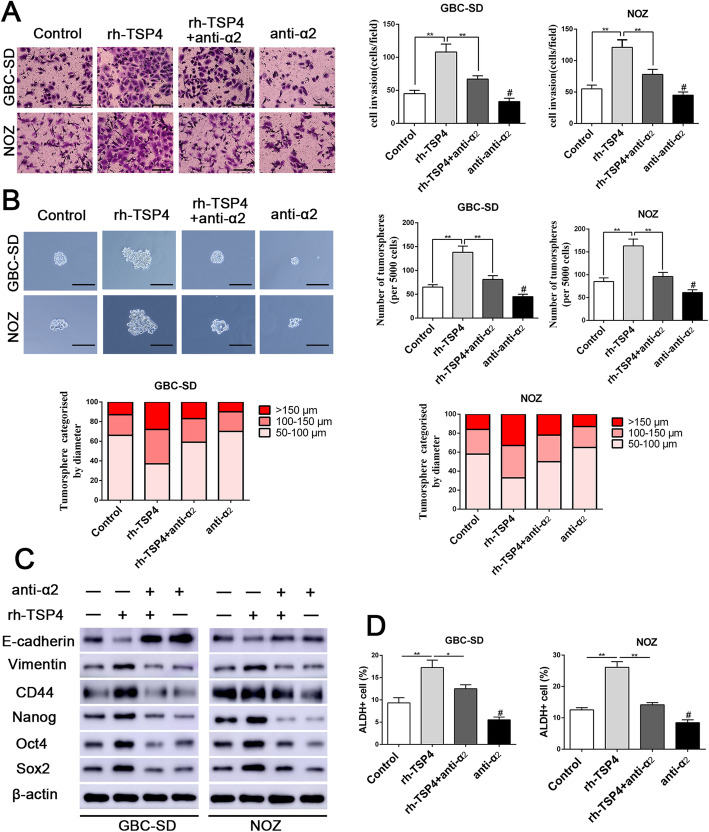
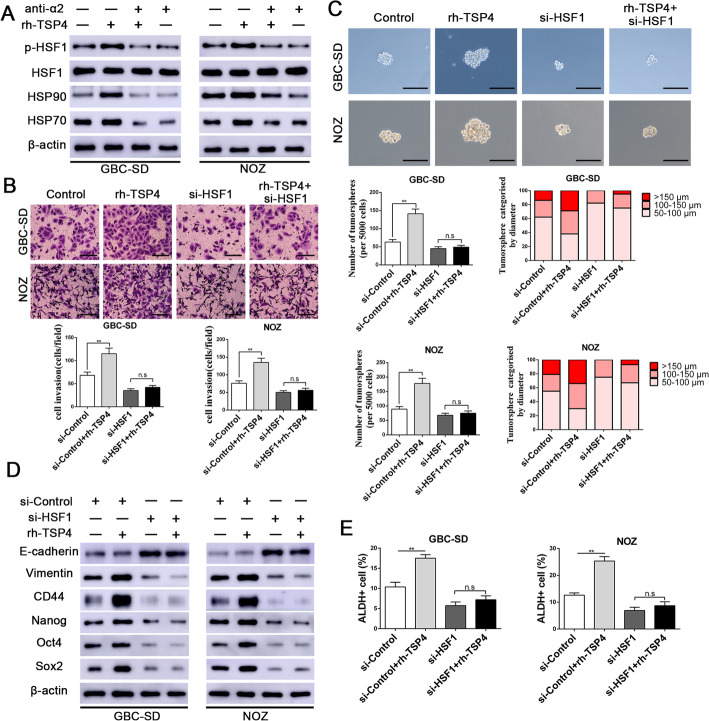
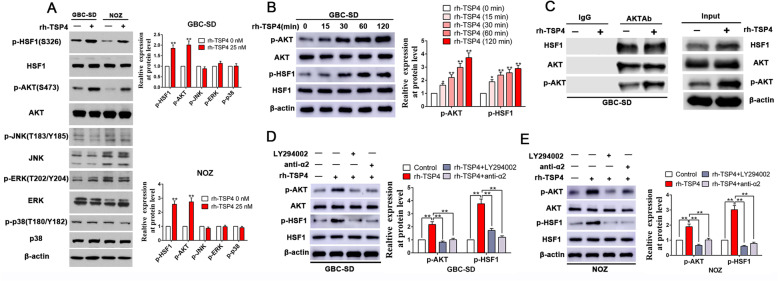
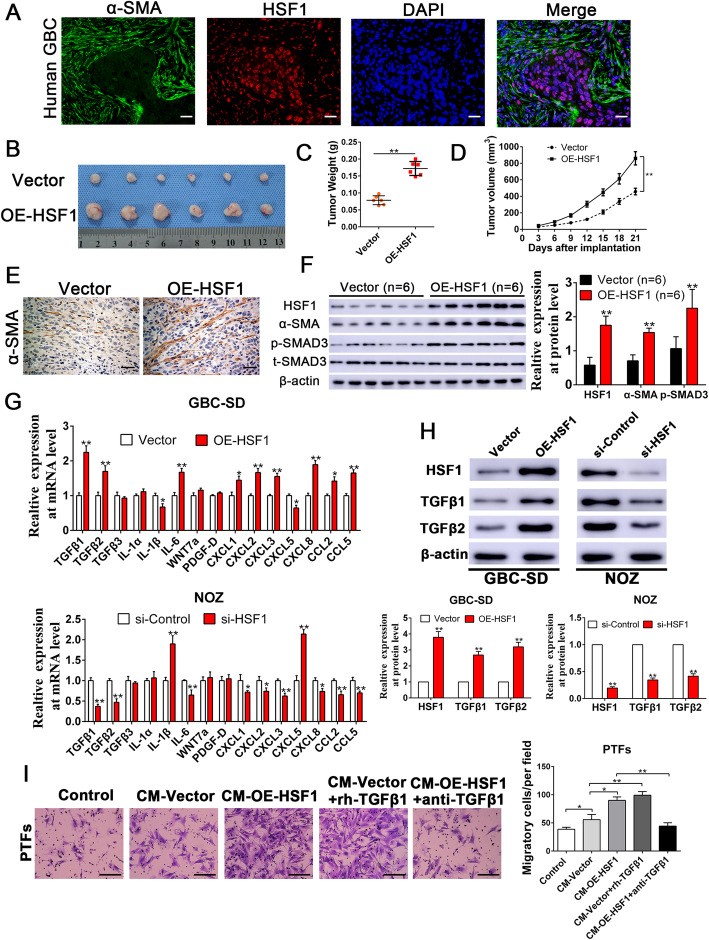
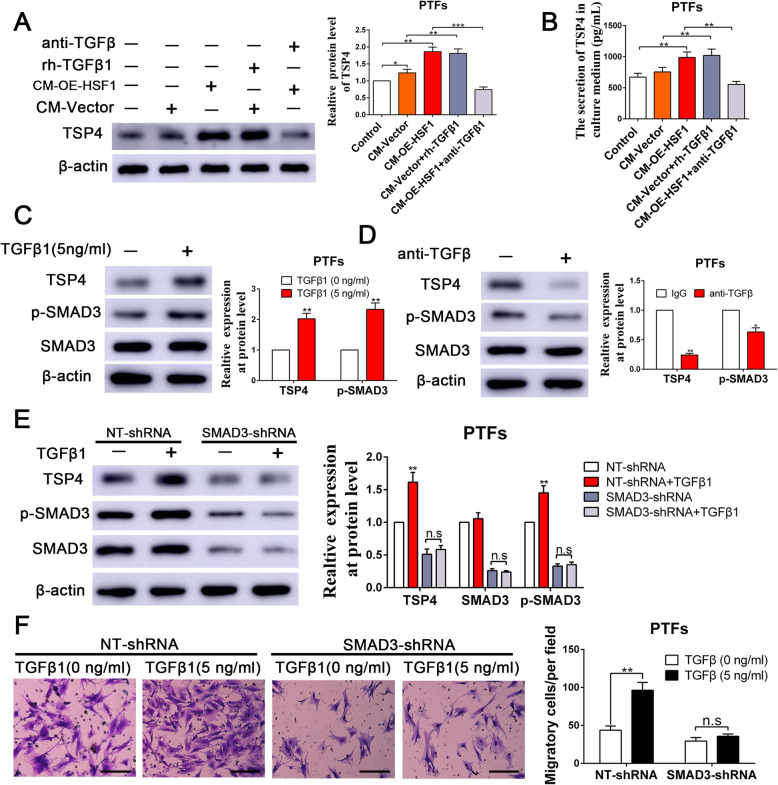
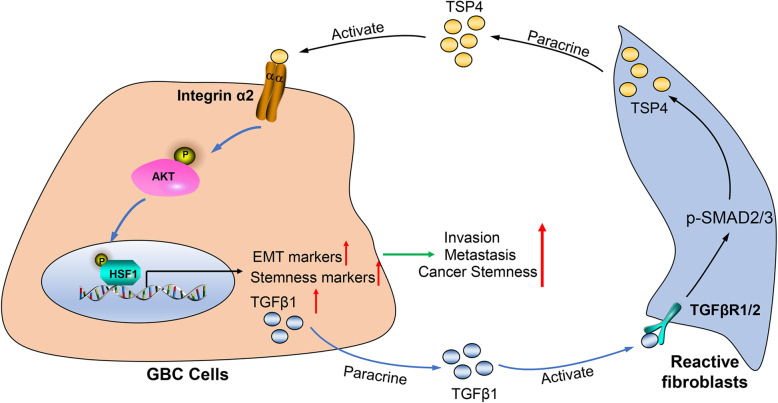
Results: In the present study, we showed that TSP-4, as the stromal glycoprotein, is highly expressed in CAFs from GBC and that CAF-derived TSP-4 induces the proliferation, EMT and cancer stem-like features of GBC cells. Mechanistically, CAF-secreted TSP-4 binds to the transmembrane receptor integrin α2 on GBC cells to induce the phosphorylation of HSF1 at S326 and maintain the malignant phenotypes of GBC cells. Moreover, the TSP-4/integrin α2 axis-induced phosphorylation of HSF1 at S326 is mediated by Akt activation (p-Akt at S473) in GBC cells. In addition, activated HSF1 signaling increased the expression and paracrine signaling of TGF-β1 to induce the transdifferentiation of PTFs into CAFs, leading to their recruitment into GBC and increased TSP-4 expression in CAFs, thereby forming a positive feedback loop to drive the malignant progression of GBC.

Conclusions: Our data indicate that a complex TSP-4/integrin α2/HSF1/TGF-β cascade mediates reciprocal interactions between GBC cells and CAFs, providing a promising therapeutic target for gallbladder cancer patients.

Keywords: Cancer stemness; Cancer-associated fibroblasts; Gallbladder cancer; Heat shock factor 1; Proliferation; Thrombospondin 4.


Conflict of interest statement

The authors declare that they have no competing interests.

Figures

Fig. 1
Fig. 1
TSP-4 is mainly derived from CAFs in GBC and predicts poor prognosis. a Immunofluorescence (IF) staining of α-SMA in human GBC and adjacent non-tumor (NT) tissue. The magnification of the picture is 400×. Scale bars = 20 μm. b CAFs and PTFs were isolated from human GBC tissues and adjacent non-tumor tissue. α-SMA level in CAFs and PTFs were assessed by IF staining. The magnification of the picture is 400×. Scale bars = 20 μm. c, d The expression of α-SMA, fibronectin and col. 1α at mRNA and protein level was determined by qRT-PCR and Western blot respectively. n = 15, *P < 0.05 or **P < 0.01 by Student’s t-test. e qRT-PCR was used to screen the expression of thrombospondins (TSP1-TSP5) in CAFs and PTFs. n = 15, *P < 0.05 or **P < 0.01 or ***P < 0.001 by Student’s t-test. f TSP-4 level in CAFs and PTFs were determined by IF staining. The magnification is 400×. Scale bars = 20 μm. g The secretion of TSP-4 in GBC cell lines, PTFs and CAFs was confirmed by Elisa assay. n = three independent experiments, *P < 0.05 or **P < 0.01 by ANOVA. h The secretion of TSP-4 in CM-PTFs and CM-CAFs was assessed by western blot. n = 15, *P < 0.05 or **P < 0.01 by Student’s t-test. i The expression of TSP-4 was upregulated in stroma of GBC compared to that in normal tissues, as determined by IHC staining. **P < 0.01 by Student’s t-test. j Kaplan-Meier survival curves of overall survival in our GBC patients’ cohort (n = 75). Patients were assigned into two subgroups according to the median expression of TSP-4 in GBC stroma. **P < 0.01by two-sided log-rank test
Fig. 2
Fig. 2
CAFs-derived TSP-4 signaling facilitated EMT and cancer stem-like traits in GBC cells. a GBC-SD and NOZ cells were incubated with CM-shVector, CM-shTSP-4, CM-shTSP-4 + rh-TSP-4 for 24 h, then the invasive ability of GBC cells was assessed by the Matrigel-invasion assay. Scale bars = 50 μm. n = three independent experiments, *P < 0.05 or **P < 0.01 by ANOVA. b Representative images of the tumorsphere formation assay after CM-shVector, CM-shTSP-4, CM-shTSP-4 + rh-TSP-4 treatments in GBC-SD and NOZ cells. The number of tumorspheres was counted and plotted, and the percentage of tumorspheres with diameters of 50–100 μm, 100–150 μm or > 150 μm was calculated and plotted. Magnification is × 200, and scale bars = 50 μm. n = three independent experiments, **P < 0.01 by ANOVA. c The expression of CSC and EMT markers after CM-shVector, CM-shTSP-4, CM-shTSP-4 + rh-TSP-4 treatments were evaluated by western blotting. d The ALDH+ cells populations in NOZ cells after CM-shVector, CM-shTSP-4, CM-shTSP-4 + rh-TSP-4 treatments were detected by Flow cytometric analysis. n = three independent experiments, *P < 0.05 or **P < 0.01 by ANOVA
Fig. 3
Fig. 3
Depletion of TSP-4 in CAFs dampens CAFs-induced tumorgenicity of GBC-SD cells along with reversing the mesenchymal and stem-like phenotypes. a Representative images of subcutaneous xenografts in nude mice implanted with GBC-SD alone, GBC-SD + CAFs and GBC-SD + CAFs (shTSP-4) (n = 6). b, c Xenografts weight (mg) and tumor sizes were monitored and undergone quantification analysis. n = 6, **P < 0.01 by ANOVA for tumor weight; **P < 0.01 by repeated-measures ANOVA for tumor sizes. d, e Immunohistochemistry staining and semiquantitative analysis of Ki-67, E-cadherin, Vimentin, Sox2, Nanog and CD44 in xenograft tissues from different groups. Magnification is × 400, the scale bar represents 20 μm. n = 6, *P < 0.05 or **P < 0.01 by ANOVA
Fig. 4
Fig. 4
Integrin α2 mediates the efficacy of paracrine of TSP-4 signaling on EMT and cancer stemness of GBC cells. a Representative images of the Matrigel invasion assay after rh-TSP-4, rh-TSP-4 + anti-α2 or anti-α2 treatments in GBC-SD and NOZ cells. Scale bars = 50 μm. n = three independent experiments, **P < 0.01 or # P < 0.01by ANOVA versus control group. b Representative images of the tumorsphere formation assay after rh-TSP-4, rh-TSP-4 + anti-α2 or anti-α2 treatments in GBC-SD and NOZ cells. The number of tumorspheres was counted and plotted, and the percentage of tumorspheres with diameters of 50–100 μm, 100–150 μm or > 150 μm was calculated and plotted. Magnification is × 200, and scale bars = 50 μm. n = three independent experiments, **P < 0.01 or # P < 0.01by ANOVA versus control group. c The expression of CSC and EMT markers after rh-TSP-4, rh-TSP-4 + anti-α2 or anti-α2 treatments were evaluated by western blotting. d The ALDH+ cells populations after rh-TSP-4, rh-TSP-4 + anti-α2 or anti-α2 treatments were detected by Flow cytometric analysis. n = three independent experiments, *P < 0.05 or **P < 0.01 or # P < 0.01by ANOVA versus control group
Fig. 5
Fig. 5
HSF1 activation mediates the effects of the TSP-4/integrin α2 axis on EMT and CSC-like features in GBC cells. a The protein expression levels of p-HSF1 (sc326), HSF1 and its downstream targets after rh-TSP-4, rh-TSP-4 + anti-α2 or anti-α2 treatments were determined by western blot analysis in GBC-SD and NOZ cells. b Representative images of the Matrigel invasion assay after rh-TSP-4, si-HSF1or rh-TSP-4 + si-HSF1 treatments in GBC-SD and NOZ cells. Scale bars = 50 μm. n = three independent experiments, **P < 0.01 by ANOVA versus si-control group. c Representative images of the tumorsphere formation assay after rh-TSP-4, si-HSF1or rh-TSP-4 + si-HSF1 treatments in GBC-SD and NOZ cells. The number of tumorspheres was counted and plotted, and the percentage of tumorspheres with diameters of 50–100 μm, 100–150 μm or > 150 μm was calculated and plotted. Magnification is × 200, and scale bars = 50 μm. n = three independent experiments, **P < 0.01by ANOVA versus si-control group. d The expression of EMT and CSC markers (E-cadherin, Vimentin, CD44, Nanog, Oct4 and Sox2) after rh-TSP-4, si-HSF1or rh-TSP-4 + si-HSF1 treatments were evaluated by western blotting. e The ALDH+ cells populations after rh-TSP-4, si-HSF1or rh-TSP-4 + si-HSF1 treatments were detected by Flow cytometric analysis. n = three independent experiments, **P < 0.01by ANOVA versus si-control group
Fig. 6
Fig. 6
Concurrent activation of HSF1 and AKT by TSP-4/integrin α2 axis in gallbladder cancer cells. a rh-TSP-4 induced phosphorylation of both AKT and HSF1 ((p-AKT: S473 and p-HSF1:S326)) in GBC cells. GBC-SD and NOZ cells were treated with and without rh-TSP-4 for 2 h and the whole cell lysates were analyzed by WB for levels of integrin α2 downstream kinases. β-Actin was used as an internal control. n = three independent experiments, **P < 0.01 by Student’s t-test versus control group. b Kinetics for HSF-1 activation was in accordance with that for Akt. GBC-SD cells were incubated with rh-TSP-4 for 0–120 min and the whole cell lysates were utilized for WB analysis to determine levels of p-HSF-1 (S326) and p-Akt (S473). β-Actin was used as an internal control. n = three independent experiments, **P < 0.01 by ANOVA versus control group. c Akt interacts with HSF-1 constitutively, independent of rh-TSP-4 treatment. CO-IP assay was performed using whole cell lysates extracted from GBC-SD cells treated with and without rh-TSP-4. An Akt antibody was used to immunoprecipitate Akt, whereas IgG was used as negative controls. d, e Western blot analysis showed that rh-TSP-4 increased Akt and HSF1 phosphorylation (p-AKT: S473 and p-HSF1:S326) in GBC-SD and NOZ cells, while this effect was antagonized by blocking integrin α2 or inhibiting Akt. β-Actin was used as an internal control. n = three independent experiments, **P < 0.01 by ANOVA versus control group
Fig. 7
Fig. 7
Overexpression of HSF1 in GBC induced the recruitment of CAFs through TGFβ signaling. a The double IF staining in human GBC tissue displayed that HSF1 was principally expressed in nuclear of gallbladder cancer cells, while α-SMA positive stroma was surrounded in HSF1 positive GBC cells. b Representative images of subcutaneous xenografts in nude mice implanted with GBC-SD cells with Vector or overexpression of HSF1 group (n = 6). c, d Xenografts weight (mg) and tumor sizes were monitored and undergone quantification analysis. n = 6, **P < 0.01 by Student’s t-test for tumor weight; **P < 0.01 by repeated-measures ANOVA for tumor sizes. e IHC analyses verified that α-SMA expression levels were significantly increased in xenograft tumors from nude mice subcutaneous implantation models of GBC-SD cells expressing exogenous HSF1. Magnification is × 400, the scale bar represents 20 μm. f Xenograft tissues arising from HSF1 overexpression group (n = 6) and control group (n = 6) were subjected to immunoblotting for HSF1, α-SMA, p-SMAD3 and t-SMAD3 protein expression, respectively. n = 6, **P < 0.01 by Student’s t-test. g The expression patterns in mRNA levels of the selected chemokines, inflammation-related genes and TGFβ after manipulation of HSF1 in GBC cells. n = three independent experiments, *P < 0.05 or **P < 0.01 by Student’s t-test. h The alterations of TGFβ1 and TGFβ2 expression levels were assessed by Western blot in GBC-SD and NOZ cells after manipulations of HSF1. β-Actin was used as an internal control. n = three independent experiments, **P < 0.01 by Student’s t-test. i The migration capacity of PTFs in response to CM-Vector, CM-OE-HSF1, CM-Vector+TGFβ1 or CM-OE-HSF1 + anti-TGFβ treatment was detected by Transwell-migration assay. Scale bars = 50 μm. n = three independent experiments, *P < 0.05 or **P < 0.01 by ANOVA
Fig. 8
Fig. 8
HSF1-mediated TGFβ signaling maintained the CAFs phenotypes and increased the expression and secretion of TSP-4. a, b The expression and secretion of TSP-4 with PTFs in response to CM-Vector, CM-OE-HSF1, CM-Vector+TGFβ1 or CM-OE-HSF1 + anti-TGFβ treatment was detected by western blot and Elisa assay respectively. n = three independent experiments, *P < 0.05 or **P < 0.01 by ANOVA. c, d TGFβ1 increased while TGFβ neutralizing antibody (anti-TGFβ) reduced the expression of TSP-4 and p-SMAD3 in PTFs. n = three independent experiments, *P < 0.05 or **P < 0.01 by Student’s t-test. e Knockdown of SMAD3 abrogated the TGFβ1-induced the expression of TSP-4. n = three independent experiments, **P < 0.01 by ANOVA. f Depletion of SMAD3 reversed the TGFβ1-induced the migration of PTFs. Scale bars = 50 μm. n = three independent experiments, **P < 0.01 by ANOVA
Fig. 9
Fig. 9
Schematic of the findings of the present study. The TSP-4 secreted by CAFs binds to integrin α2 on the surface of GBC cells, thus activating downstream signaling cascades, including upregulation the phosphorylation of AKT and HSF1(p-AKT: S473 and p-HSF1:S326), which induces nuclear translocation of p-HSF1, and triggers the EMT and cancer stem-like traits. Activated HSF1 signaling further increased the expression and paracrine of TGF-β to induce the transdifferentiation of reactive fibroblasts into CAFs, leading to their recruitment into GBC and increased TSP-4 expression in CAFs

Similar articles

Cited by

References

    1. Li M, Zhang Z, Li X, Ye J, Wu X, Tan Z, Liu C, Shen B, Wang XA, Wu W, et al. Whole-exome and targeted gene sequencing of gallbladder carcinoma identifies recurrent mutations in the ErbB pathway. Nat Genet. 2014;46:872–876. doi: 10.1038/ng.3030. - DOI - PubMed
    1. Boutros C, Gary M, Baldwin K, Somasundar P. Gallbladder cancer: past, present and an uncertain future. Surg Oncol. 2012;21:e183–e191. doi: 10.1016/j.suronc.2012.08.002. - DOI - PubMed
    1. Ye YY, Mei JW, Xiang SS, Li HF, Ma Q, Song XL, Wang Z, Zhang YC, Liu YC, Jin YP, et al. MicroRNA-30a-5p inhibits gallbladder cancer cell proliferation, migration and metastasis by targeting E2F7. Cell Death Dis. 2018;9:410. doi: 10.1038/s41419-018-0444-x. - DOI - PMC - PubMed
    1. Joyce JA, Pollard JW. Microenvironmental regulation of metastasis. Nat Rev Cancer. 2009;9:239–252. doi: 10.1038/nrc2618. - DOI - PMC - PubMed
    1. Vanharanta S, Massague J. Origins of metastatic traits. Cancer Cell. 2013;24:410–421. doi: 10.1016/j.ccr.2013.09.007. - DOI - PMC - PubMed

LinkOut - more resources