. 2021 Jan 6;23(1):5.
doi: 10.1186/s13075-020-02372-z.

Anti-CD40 antibody KPL-404 inhibits T cell-mediated activation of B cells from healthy donors and autoimmune patients

Affiliations

Anti-CD40 antibody KPL-404 inhibits T cell-mediated activation of B cells from healthy donors and autoimmune patients

John Marken et al. Arthritis Res Ther. .

Erratum in

Abstract

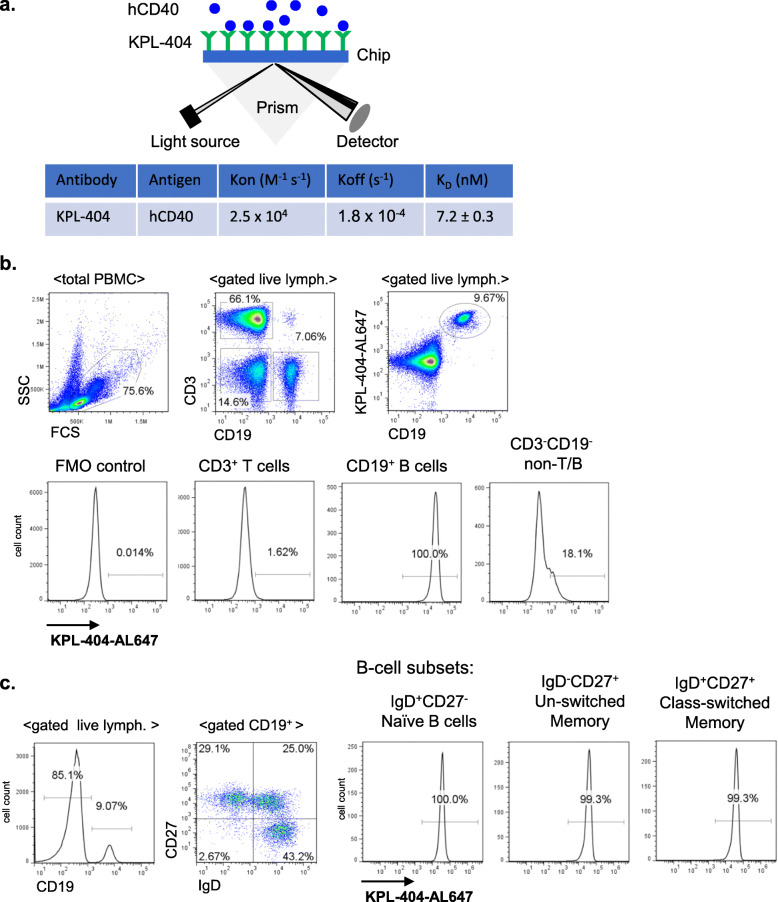
Background: CD40-CD40L is a key co-stimulatory pathway for B cell activation. As such, its blockade can inhibit pathogenic B cell responses in autoimmune diseases, such as Sjogren's syndrome (SjS) and systemic lupus erythematosus (SLE). In this study, we examined the in vitro effects of KPL-404, a humanized anti-CD40 monoclonal antibody (Ab), on primary human B cells derived from either healthy donors (HD) or autoimmune patients and compared them to the effects of G28-5, a partially antagonistic anti-CD40 antibody.

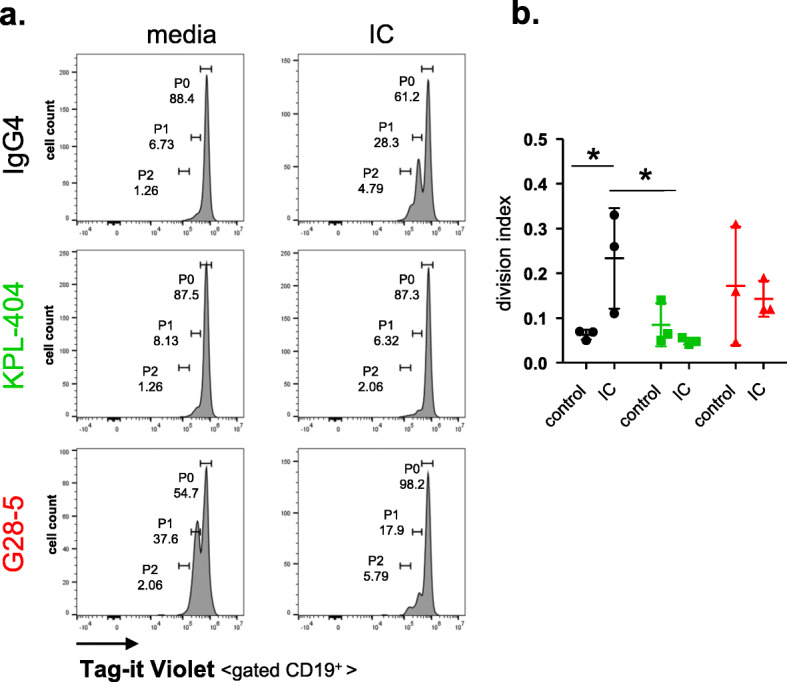
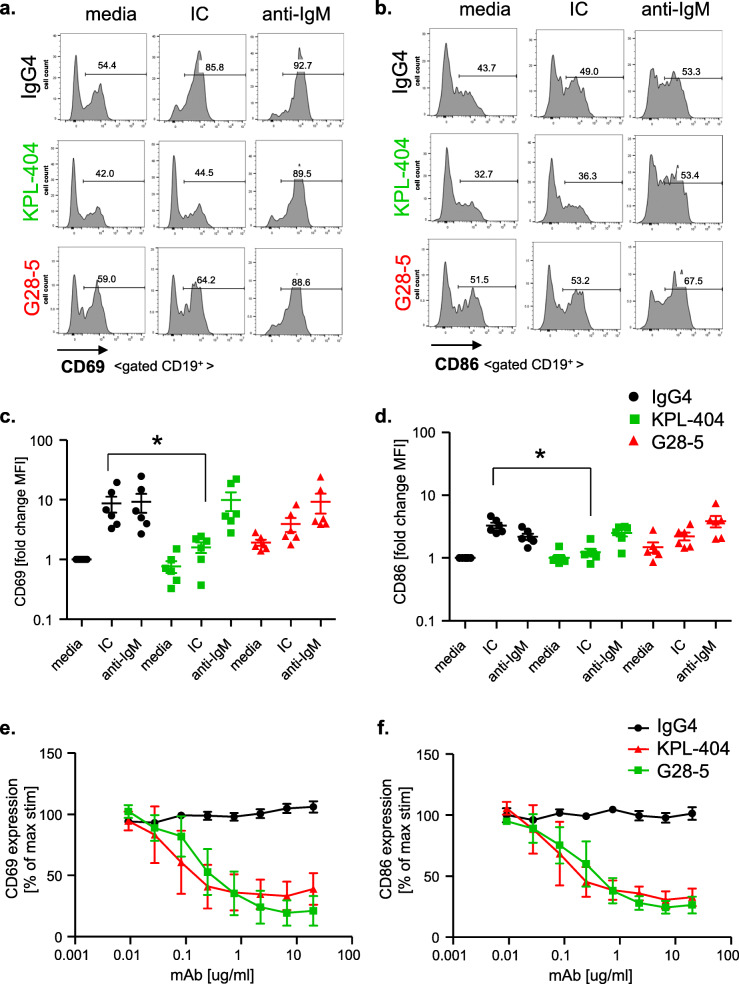
Methods: PBMCs from HD or SjS and SLE patients were cultured in high-density cell cultures in the presence of IgG4 isotype control or anti-CD40 Abs KPL-404 or G28-5. Cells were stimulated with anti-CD3/CD28 cross-linking reagent ImmunoCult (IC) to induce CD40L-CD40-mediated B cell responses. B cell proliferation and activation, measured by dilution of proliferation tracker dye and the upregulation of CD69 and CD86, respectively, were assessed by flow cytometry. Anti-CD40 Ab cell-internalization was examined by imaging flow cytometry. Cytokine release in the PBMC cultures was quantified by bead-based multiplex assay.

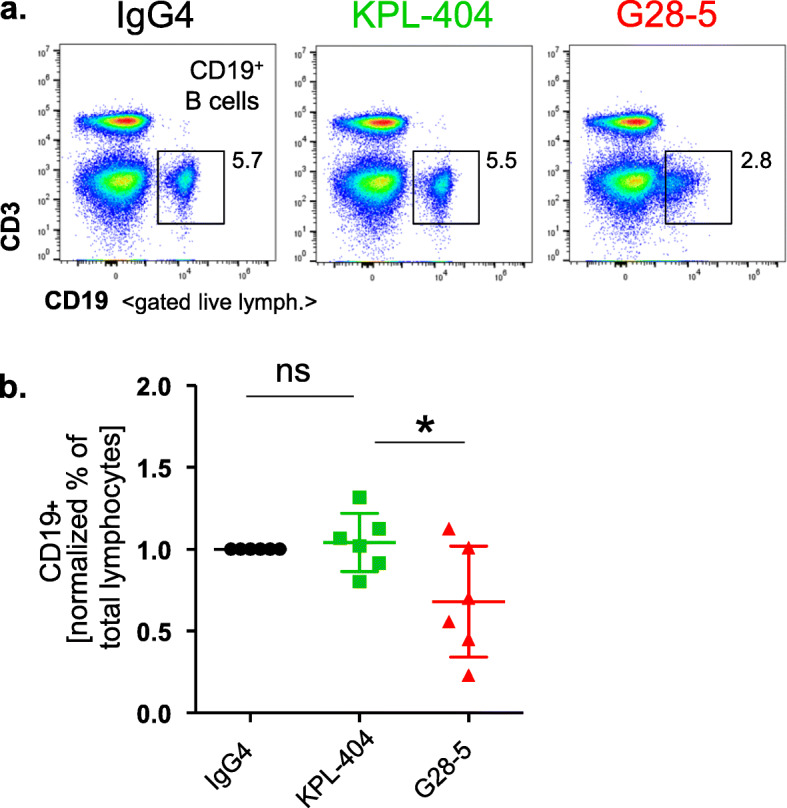
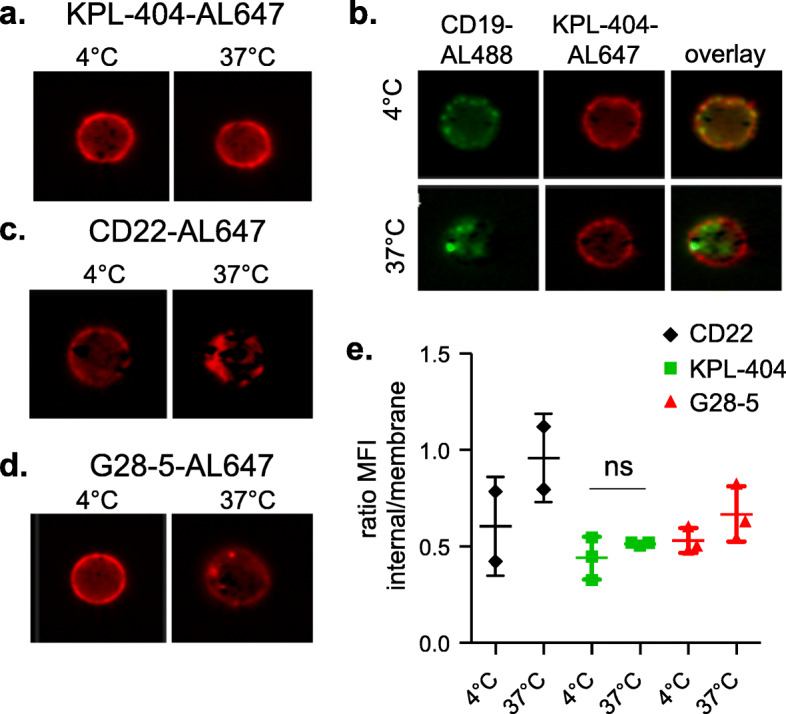
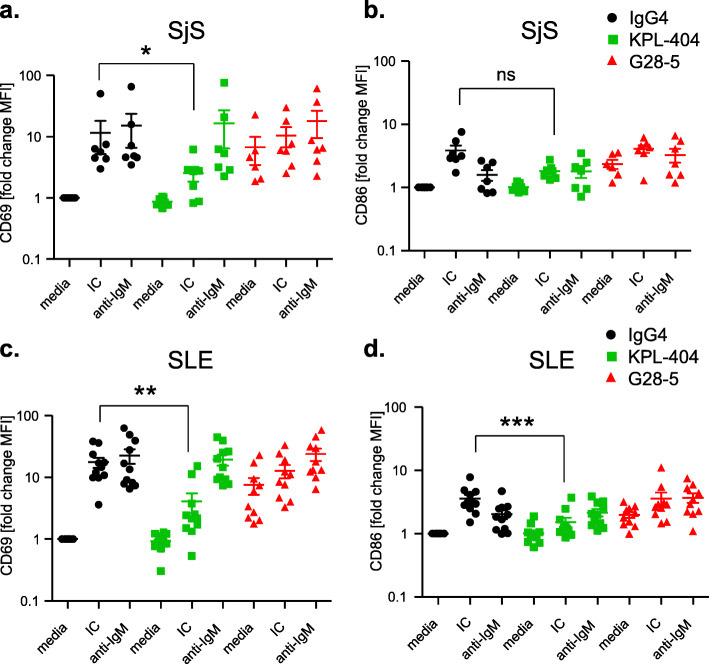
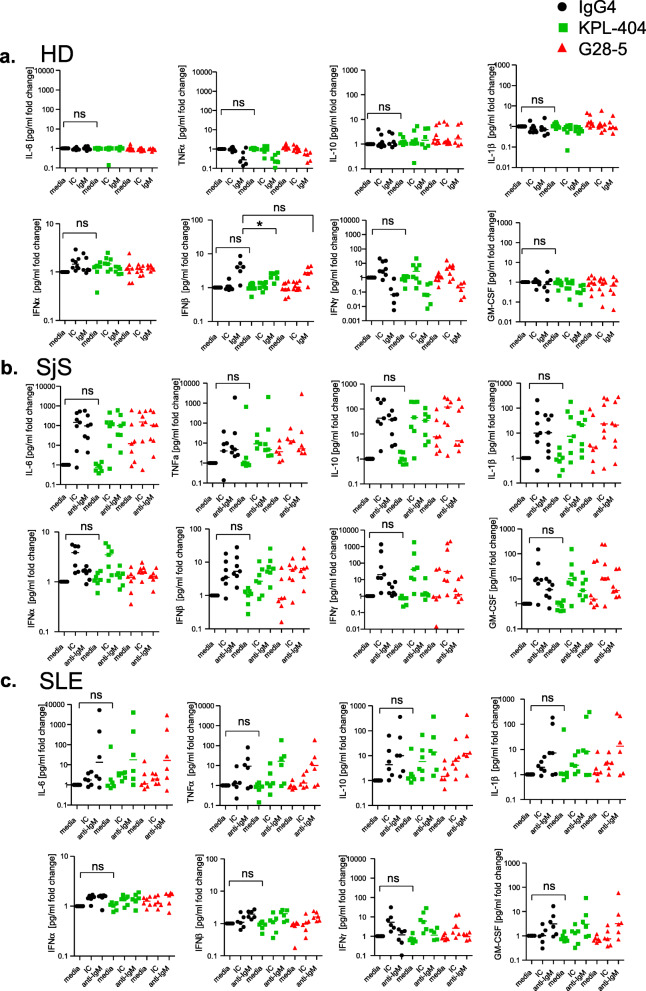
Results: KPL-404 binds to CD40 expressed on different subsets of B cells without inducing cell depletion, or B cell proliferation and activation in in vitro culture. Under the same conditions, G28-5 promoted proliferation of and increased CD69 expression on otherwise unstimulated B cells. KPL-404 efficiently blocked the CD40L-CD40-mediated activation of B cells from HD at concentrations between 1 and 10 μg/ml. Treatment with KPL-404 alone did not promote cytokine production and blocked the production of IFNβ in healthy PBMC cultures. KPL-404 efficiently blocked CD40L-CD40-mediated activation of B cells from patients with SjS and SLE, without affecting their anti-IgM responses or affecting their cytokine production. Consistent with the differences of their effects on B cell responses, KPL-404 was not internalized by cells, whereas G28-5 showed partial internalization upon CD40 binding.

Conclusions: Anti-CD40 mAb KPL-404 showed purely antagonistic effects on B cells and total PBMCs. KPL-404 inhibited CD40L-CD40-mediated B cell activation in PBMC cultures from both healthy controls and autoimmune patients. These data support the therapeutic potential of CD40 targeting by KPL-404 Ab for inhibiting B cell responses in SjS and SLE.

Keywords: Anti-CD40 mAb; B cell activation; CD40-CD40L co-stimulation; KPL-404; Sjogren’s syndrome (SjS); Systemic lupus erythematosus (SLE).


Conflict of interest statement

This study was supported by Kiniksa Pharmaceuticals, Ltd. S.M. is an employee of Kiniksa Pharmaceuticals Corp. and J.M and N.G. received research funding from Kiniksa Pharmaceuticals, Ltd.

Figures

Fig. 1
Fig. 1
KPL-404 affinity and binding to primary B cells. a Binding kinetics of KPL-404 to recombinant human CD40 molecule was analyzed following direct immobilization of KPL-404 onto a sensor chip. CD40 analyte was flowed over the immobilized KPL-404. The KD [equilibrium dissociation constant = Koff (dissociation rate)/Kon (association rate)] was calculated by analyzing the change in reflection of incident light on the chip as a result of KPL-404 and CD40 interaction. b PBMCs were stained with cell lineage markers and AL647-labeled KPL-404 Ab. Representative data from one HD. Histograms show the percentage KPL-404-AL647+ cells within different cell subsets, including CD19+ (B cells), CD3+ (T cells), and CD19CD3 (non-T/B). c B cell subsets within CD19+ PBMCs were defined based on the expression of IgD and CD27. Histograms show the percentage KPL-404+ cells within different subsets, including naïve (IgD+CD27), un-switched memory (IgD+CD27+), and class-switched memory (IgDCD27+) B cells. Data are representative of three independent experiments, using PBMCs from different donors
Fig. 2
Fig. 2
KPL-404 does not deplete B cells in culture. PBMCs were cultured in the presence of 10 μg/ml IgG4 isotype control or anti-CD40 Abs KPL-404, or G28-5 (16–18 h of cell culture). a Representative flow data showing the percentage of CD19+ B cells of gated live lymphocytes. b Summary data from 6 individual HD showing the percentage of live CD19+ cells in the lymphocyte population. B cell frequencies for each donor are normalized to IgG4 control. The bars represent mean and standard deviation (SD). *p < 0.05, determined by unmatched ANOVA analysis with multiple comparisons to control IgG4
Fig. 3
Fig. 3
Effects of anti-CD40 antibodies KPL-404 and G28-5 on B cell proliferation. PBMCs were labeled with a cell proliferation tracker dye (Tag-it Violet) and cultured for 5 days in the presence of 10 μg/ml IgG4 isotype control Ab or anti-CD40 Abs—KPL-404 and G28-5. Cells were left untreated (media control) or stimulated with anti-CD3/CD28 cross-linking reagent ImmunoCult (IC). Levels of CD19+ B cell proliferation were measured based on Tag-it Violet dilution. a Flow cytometry data from one representative experiment. Gates depict non-proliferating cells (gate P0) or Tag-it Violet dim (proliferating) cells (gates P1-P2). b Cumulative data from 3 individual donors. B cell proliferation is presented as division Index (total number of divisions/total number of cells) for each sample. The bars represent mean and standard deviation (SD). *p < 0.05, determined by two-way ANOVA with multiple comparisons test
Fig. 4
Fig. 4
Effect of Anti-CD40 Abs KPL-404 and G28-5 on T cell-dependent B cell activation in healthy donors. PBMCs were cultured in the presence of 10 μg/ml IgG4 isotype control or anti-CD40 Abs KPL-404, or G28-5 (16–18 h of cell culture). Cells were left unstimulated (media control) or stimulated with CD3/CD28 cross-linker IC or F(ab′)2 goat anti-human IgM (anti-IgM). a, b Flow cytometry data from one representative experiment, showing CD69 (a) and CD86 (b) expression on gated live CD19+ B cells. c, d Cumulative data, depicting the expression of CD69 (c) and CD86 (d) in six individual HD donors. Data are expressed as fold change MFI over IgG4-teated, media controls. Data were analyzed using one-way ANOVA on log-transformed data with matched mixed-effects modeling for multiple comparisons tests of significance between different conditions; *p < 0.05. Only comparisons between IgG4 vs KPL-404 of IC-stimulated samples are shown. Complete statistical analysis of the data is presented as Supplemental Fig. S3. e, f PBMCs were stimulated with IC in the presence of varying concentrations (20 to 0.01 μg/ml) of IgG4 isotype antibody control, KPL-404, or G28-5 anti-CD40 antibodies. Graphs show the expression of CD69 (e) and CD86 (f) on gated CD19+ B cells, relative to isotype control (100% max. stimulation) for each Ab. Cumulative data from three independent experiments using different donors
Fig. 5
Fig. 5
KPL-404 is not internalized upon binding to CD40 on primary B cells. HD PBMCs were stained with FVD and anti-CD19-Alexa Fluor 488, anti-CD40 KPL-404-AL647 or G28-5-AL647, or anti-CD22-AL647 control (1 μg/ml) and analyzed by imaging flow cytometry. Gated live CD19+ B cells (gating strategy is presented in Fig. S6) comprising 400–500 B cell images were analyzed for Ab internalization at 4 °C, 0.1% sodium azide (non-permissive conditions) or after incubation at 37 °C for 1 h (permissive conditions). ad Representative images of B cell analysis. (a) KPL-404-AL647 binding and internalization; (b) CD19-Alexa Fluor 488 and KPL-404-AL647 binding and internalization, showing CD19 and KPL-404 signal overlay; (c) anti-CD22-AL647 binding and internalization; and (d) G28-25-AL647 binding and internalization under non-permissive (4 °C) or permissive conditions (37 °C). e Cumulative data of three independent experiments. Graph depicts the ratios of the internal mask MFI and membrane mask MFI as a measure of internalization
Fig. 6
Fig. 6
KPL-404 blocks T cell-induced B cell activation in PBMC cultures from SjS and SLE patients. PBMCs were cultured in the presence of 10 μg/ml IgG4 isotype control or anti-CD40 Abs KPL-404 or G28-5 (16–18 h of cell culture). Cells were left unstimulated (media control) or stimulated with CD3/CD28 cross-linker IC, or F(ab′)2 goat anti-human IgM (anti-IgM) and B cell activation was assessed by the expression of the activation markers CD69 and CD86 on gated live CD19+ B cells. Representative flow cytometry data from one SLE donor is presented on Fig. S5. a, b Cumulative data, depicting the expression of CD69 (a) and CD86 (b) in seven individual SjS donors. c, d Cumulative data, depicting the expression of CD69 (c) and CD86 (d) in eleven individual SLE donors. Data are expressed as fold change MFI over IgG4-teated, media controls. Bars represent mean and standard deviation. Data were analyzed using one-way ANOVA on log-transformed data with matched mixed-effects modeling for multiple comparisons tests of significance between different conditions, *p < 0.05. Only comparisons between IgG4 vs KPL-404 of IC-stimulated samples are shown. Complete statistical analysis of the data is presented in Fig. S5
Fig. 7
Fig. 7
Effects of KPL-404 and G28-5 on cytokine production in PBMC cultures from healthy donors and autoimmune patients. PBMCs were stimulated for 18 h. with media control, IC, or anti-IgM in the presence of either IgG4 isotype control, KPL-404, or G28-5 anti-CD40 antibodies. Supernatants analyzed for production of key inflammatory cytokines. Shown are combined results from six HD (a), seven SjS (b), and six SLE donors (c). Additional data is presented in Fig. S7. The data for each sample and each cytokine were normalized against media controls and is expressed as a fold change. Comparison between IgG4 isotype and KPL-404 of unstimulated samples (media control) are shown (all samples), or differences in IFNβ production in response to anti-IgM stimulation (HDs). Statistical analysis were performed using one-way Friedman multiple comparisons test and one-way ANOVA mixed-effects analysis (for HD due to missing values); *p < 0.05

Similar articles

Cited by

References

    1. Hernandez MG, Shen L, Rock KL. CD40-CD40 ligand interaction between dendritic cells and CD8+ T cells is needed to stimulate maximal T cell responses in the absence of CD4+ T cell help. J Immunol. 2007;178(5):2844–2852. doi: 10.4049/jimmunol.178.5.2844. - DOI - PubMed
    1. Grewal IS, Flavell RA. The role of CD40 ligand in costimulation and T-cell activation. Immunol Rev. 1996;153:85–106. doi: 10.1111/j.1600-065X.1996.tb00921.x. - DOI - PubMed
    1. Ma DY, Clark EA. The role of CD40 and CD154/CD40L in dendritic cells. Semin Immunol. 2009;21(5):265–272. doi: 10.1016/j.smim.2009.05.010. - DOI - PMC - PubMed
    1. Elgueta R, Benson MJ, de Vries VC, Wasiuk A, Guo Y, Noelle RJ. Molecular mechanism and function of CD40/CD40L engagement in the immune system. Immunol Rev. 2009;229(1):152–172. doi: 10.1111/j.1600-065X.2009.00782.x. - DOI - PMC - PubMed
    1. Chen JM, Guo J, Wei CD, Wang CF, Luo HC, Wei YS, Lan Y. The association of CD40 polymorphisms with CD40 serum levels and risk of systemic lupus erythematosus. BMC Genet. 2015;16:121. doi: 10.1186/s12863-015-0279-8. - DOI - PMC - PubMed

Publication types