. 2021 Jan 6;14(1):3.
doi: 10.1186/s13072-020-00376-2.

Genome-wide occupancy reveals the localization of H1T2 (H1fnt) to repeat regions and a subset of transcriptionally active chromatin domains in rat spermatids

Affiliations

Genome-wide occupancy reveals the localization of H1T2 (H1fnt) to repeat regions and a subset of transcriptionally active chromatin domains in rat spermatids

Vasantha Shalini et al. Epigenetics Chromatin. .

Abstract

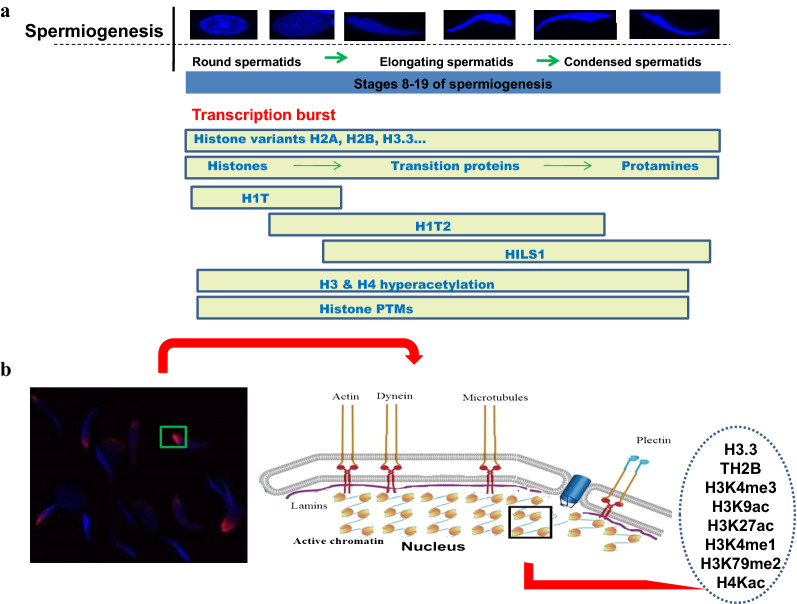
Background: H1T2/H1FNT is a germ cell-specific linker histone variant expressed during spermiogenesis specifically in round and elongating spermatids. Infertile phenotype of homozygous H1T2 mutant male mice revealed the essential function of H1T2 for the DNA condensation and histone-to-protamine replacement in spermiogenesis. However, the mechanism by which H1T2 imparts the inherent polarity within spermatid nucleus including the additional protein partners and the genomic domains occupied by this linker histone are unknown.

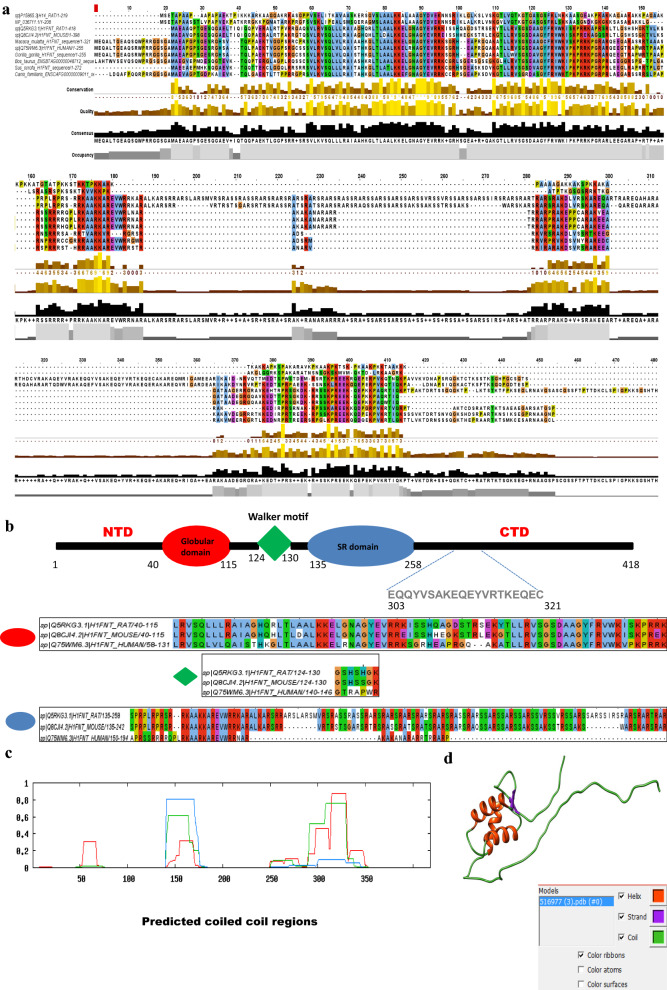
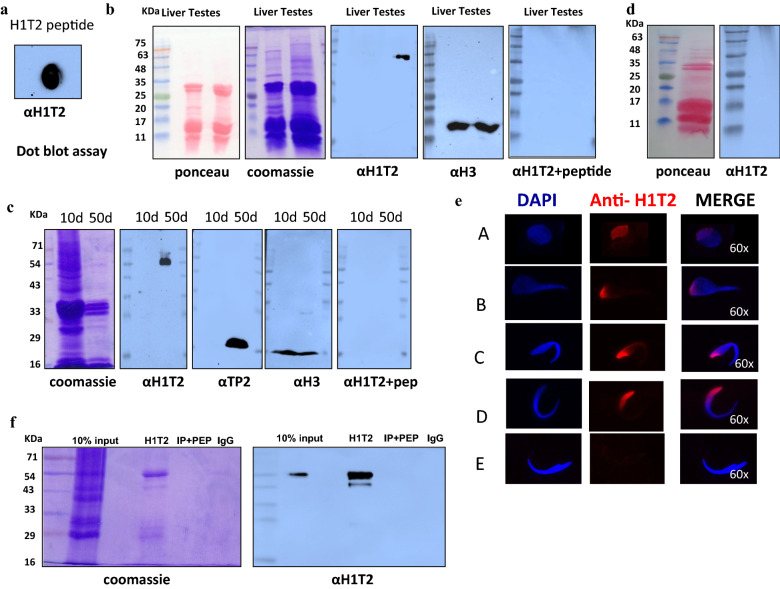
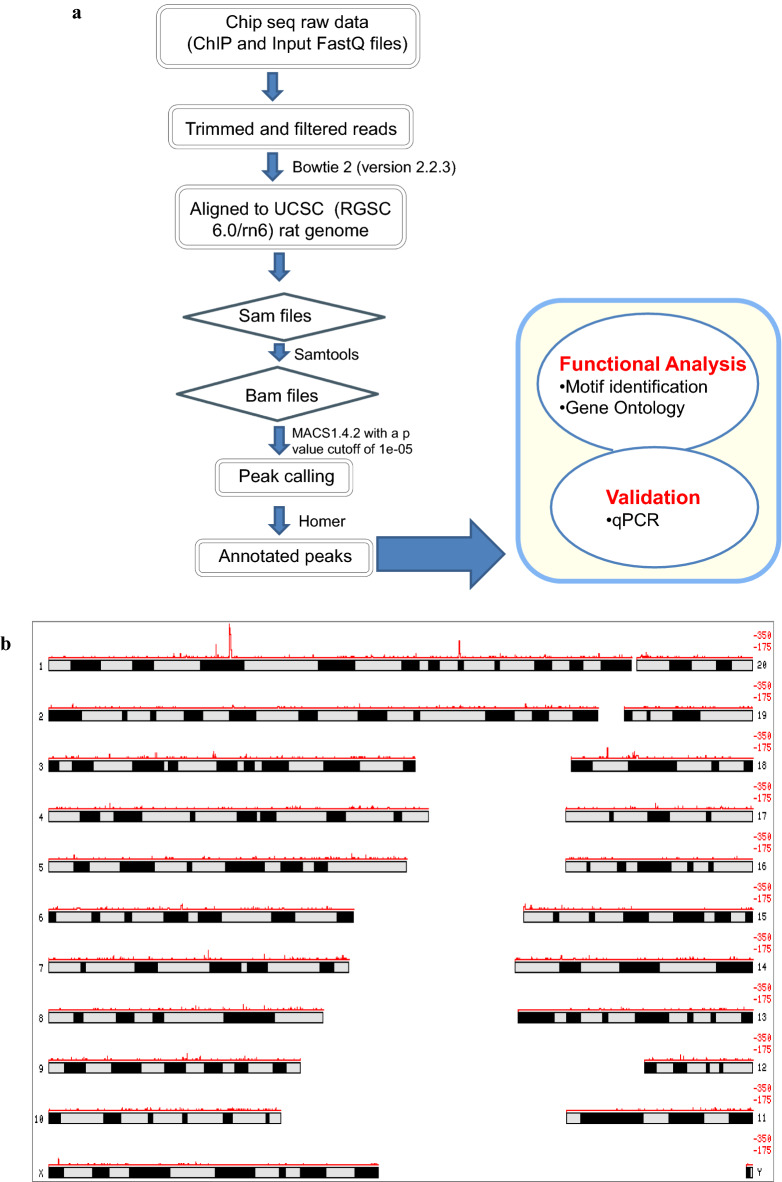
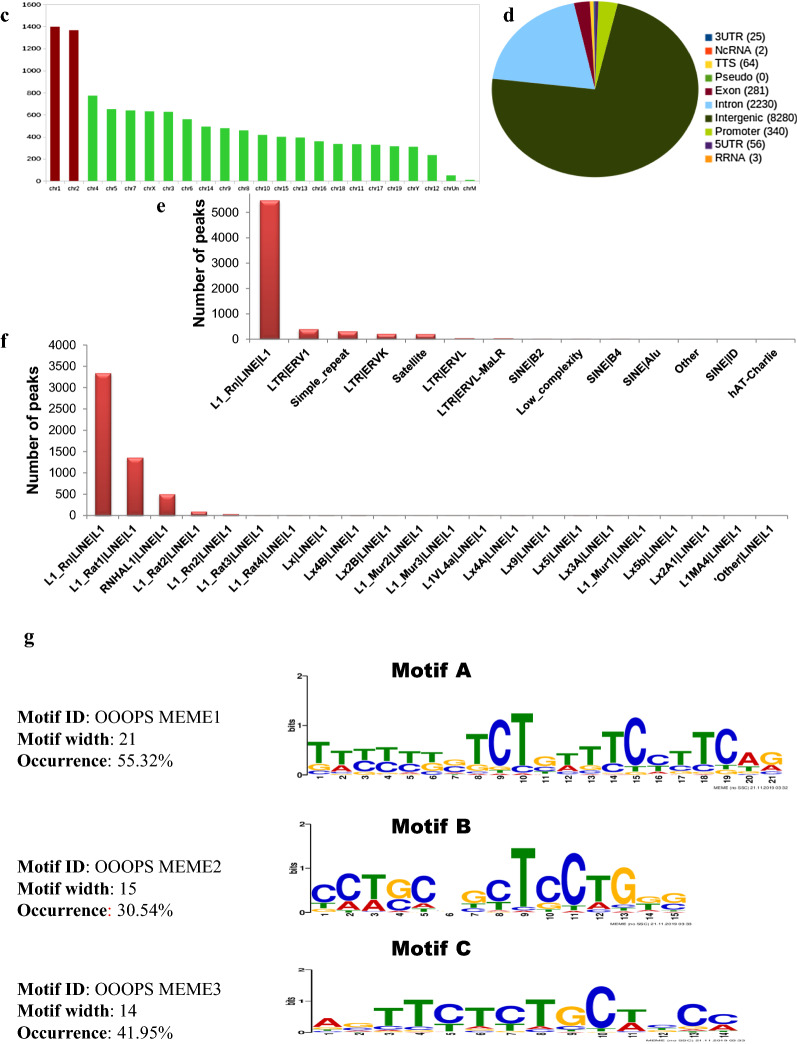
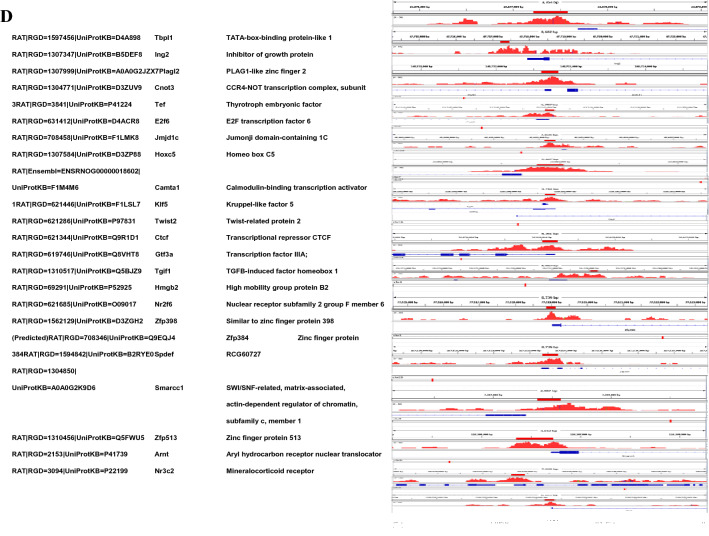
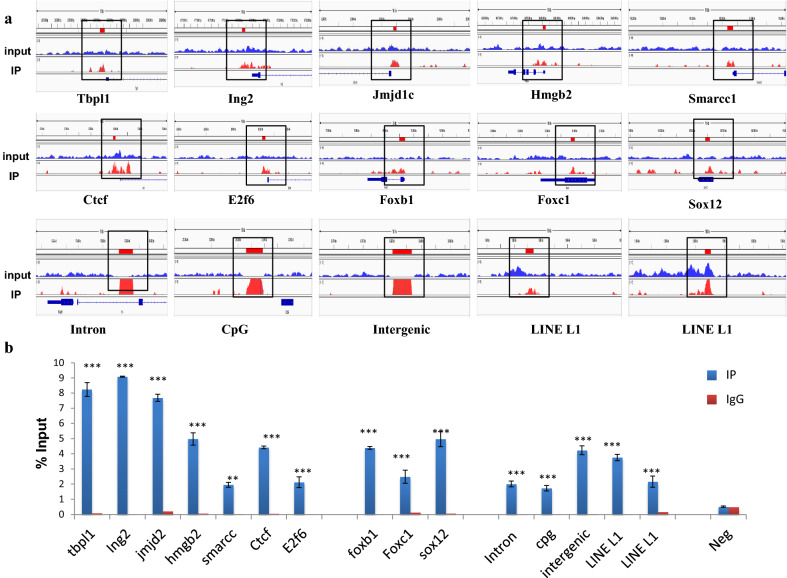
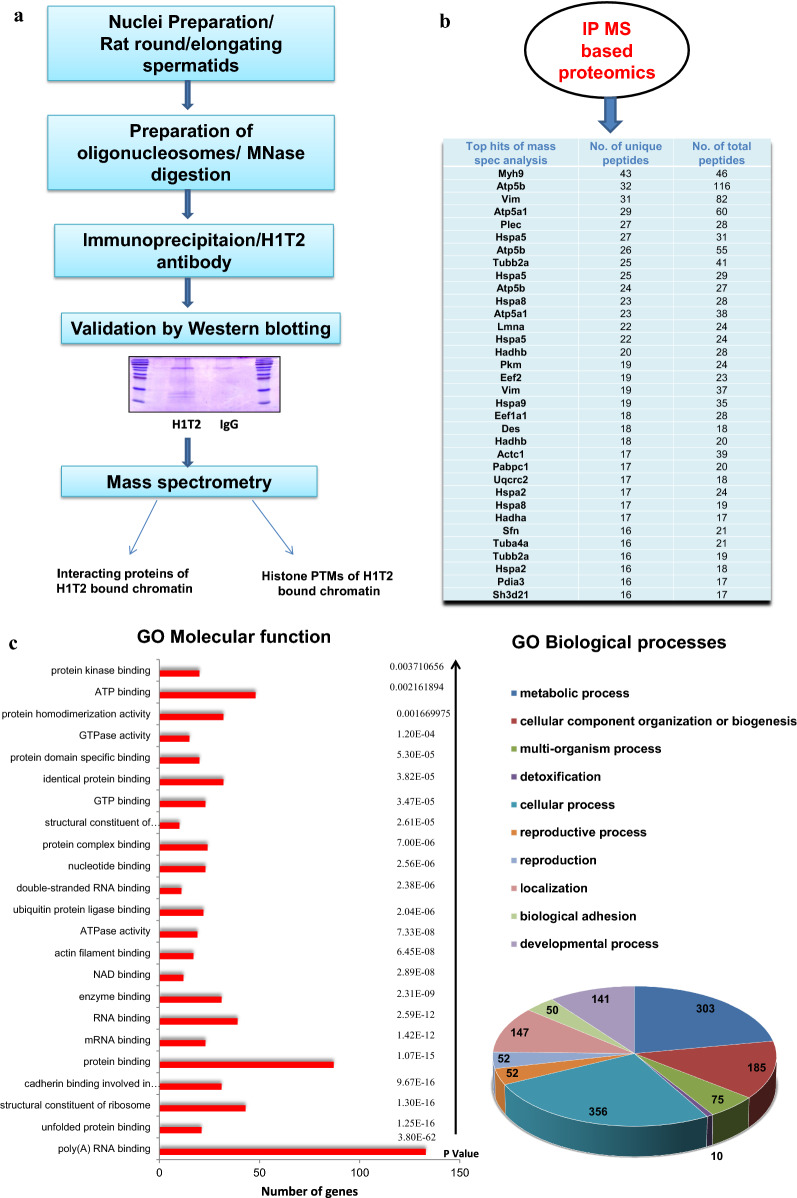
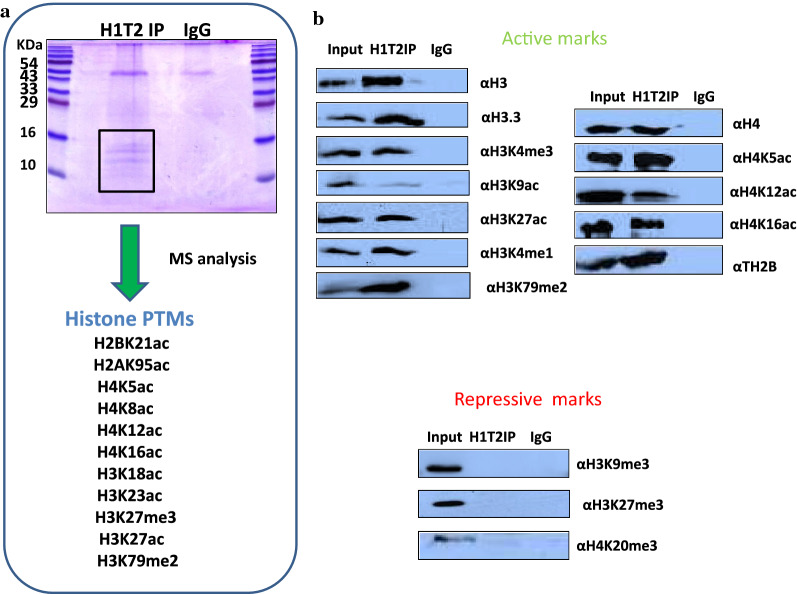
Results: Sequence analysis revealed the presence of Walker motif, SR domains and putative coiled-coil domains in the C-terminal domain of rat H1T2 protein. Genome-wide occupancy analysis using highly specific antibody against the CTD of H1T2 demonstrated the binding of H1T2 to the LINE L1 repeat elements and to a significant percentage of the genic regions (promoter-TSS, exons and introns) of the rat spermatid genome. Immunoprecipitation followed by mass spectrometry analysis revealed the open chromatin architecture of H1T2 occupied chromatin encompassing the H4 acetylation and other histone PTMs characteristic of transcriptionally active chromatin. In addition, the present study has identified the interacting protein partners of H1T2-associated chromatin mainly as nucleo-skeleton components, RNA-binding proteins and chaperones.

Conclusions: Linker histone H1T2 possesses unique domain architecture which can account for the specific functions associated with chromatin remodeling events facilitating the initiation of histone to transition proteins/protamine transition in the polar apical spermatid genome. Our results directly establish the unique function of H1T2 in nuclear shaping associated with spermiogenesis by mediating the interaction between chromatin and nucleo-skeleton, positioning the epigenetically specialized chromatin domains involved in transcription coupled histone replacement initiation towards the apical pole of round/elongating spermatids.

Keywords: ChIP-sequencing; Histone PTMs; Linker histone; Spermatid; Spermiogenesis.


Conflict of interest statement

The authors declare that they have no competing interests with the contents of this article.

Figures

Fig. 1
Fig. 1
H1T2 possess highly divergent C terminal domain. a Multiple sequence alignment of sequences of linker histone variants. Sequences from either somatic linker histone H1d or germ cell-specific H1t were aligned to consensus sequence from germ cell-specific H1T2 of different species. Amino acids are colored according to their similarity degree using the ClustalX option of Jalview. b Schematic representation of domain architecture of rat H1T2 protein: Globular domain (red), ATP-binding walker motif (green), serine-arginine rich domain (blue). Peptide sequence against which the antibody is raised, is highlighted in the C terminal domain. Clustal alignment of H1T2 sequence from rat, mouse and human species is also shown in the figure. Conserved globular domain, walker motif (ATP binding), and the divergent SR domain in the H1T2 sequences are represented separately. c Coiled-coil prediction analysis of rat H1T2 sequence (https://embnet.vital-it.ch/cgi-bin/COILS_form_parser). d Secondary structure of the rat H1T2 sequence predicted using Phyre2 (PDB format)
Fig. 2
Fig. 2
Characterization of antibody raised against the highly divergent C terminal domain of H1T2. a Dot-blot analysis of affinity purified antibody against H1T2 with respective peptide. b Western blot analysis of the acid extracts from rat liver (lane 1) and testes (lane 2) with antibody against H1T2. c Western blot analysis of acid-soluble proteins from 10 days postnatal (lane 1) and 40 days postnatal (lane 2) rat testes nuclei with anti-H1T2 antibodies in the presence or absence of peptide competition with a 200-fold molar excess of the peptide used for antibody generation, as indicated. Western blot analysis with anti-TP2 and anti-H3 antibodies served as positive controls. d Western blot analysis of acid extracts of epididymal sperm using H1T2 antibody. e Immunofluorescence analysis in spermatids using H1T12 antibody. f Western blot analysis of the pull-down fractions with α H1T2. Input (lane 1), anti-H1T2 antibody (lane 2), anti-H1T2 antibodies + peptide (lane 3), IgG (lane 4). No signal was observed in peptide competition and pre-immune IgG lanes
Fig. 3
Fig. 3
Genome-wide analysis of H1T2 in rat spermatid genome using antibody against C terminal domain. a Schematic representation of the protocol used for ChIP-sequencing analysis. b Chromosome-wise enrichment of H1T2 ChIP peaks in rat spermatid genome. c Number of peaks distributed across different rat chromosomes (x-axis), where y-axis represents the number of peaks. Box plot representing the H1T2-associated average peak length (y-axis) across different chromosomes (x-axis). d Pie chart distribution of H1T2 peaks for various genomic features in rat spermatids. The peaks are distributed in among intergenic, intron, promoter, exon, TTS, 5′UTR, 3′UTR regions. I, bar diagram of number of occurrences of peaks across repeat elements. e Bar diagram showing the number of occurrences of peaks across different classes of repeat elements. f Bar diagram showing the number of occurrences of peaks across different subclasses of LINE-1 repeat elements. g Motif identification by MEME. The figure represents the details of the three most significant motifs identified from the overlapping peak summits (H1T2 ChIP peaks)
Fig. 3
Fig. 3
Genome-wide analysis of H1T2 in rat spermatid genome using antibody against C terminal domain. a Schematic representation of the protocol used for ChIP-sequencing analysis. b Chromosome-wise enrichment of H1T2 ChIP peaks in rat spermatid genome. c Number of peaks distributed across different rat chromosomes (x-axis), where y-axis represents the number of peaks. Box plot representing the H1T2-associated average peak length (y-axis) across different chromosomes (x-axis). d Pie chart distribution of H1T2 peaks for various genomic features in rat spermatids. The peaks are distributed in among intergenic, intron, promoter, exon, TTS, 5′UTR, 3′UTR regions. I, bar diagram of number of occurrences of peaks across repeat elements. e Bar diagram showing the number of occurrences of peaks across different classes of repeat elements. f Bar diagram showing the number of occurrences of peaks across different subclasses of LINE-1 repeat elements. g Motif identification by MEME. The figure represents the details of the three most significant motifs identified from the overlapping peak summits (H1T2 ChIP peaks)
Fig. 4
Fig. 4
Functional analysis of H1T2 bound promoter-TSS regions in rat spermatids genome. a Gene ontology analysis of the 321 genes whose promoter-TSS regions are bound to H1T2. David software was used for the analysis and the results are shown in the figure. GO biological processes are represented in the figure with P values. X-axis represents the number of genes associated to the GO term. b Distribution of H1T2 peaks from ± 3 kb centered around TSS of genes in the spermatids genome and heatmap showing the same observation ngs. Plot showing distribution of H1T2 peaks throughout the gene. c GO analysis of 321 genes according to molecular function represented as pie diagram. The number of genes associated to the GO term is given in the pie chart. 23 transcription factors whose promoter-TSS is bound to H1T2 are highlighted in the pie diagram. d Integrative Genomics Viewer (IGV) outputs of representative genomic regions showing the occupancy of H1T2 at various transcription factors of the spermatid genome
Fig. 4
Fig. 4
Functional analysis of H1T2 bound promoter-TSS regions in rat spermatids genome. a Gene ontology analysis of the 321 genes whose promoter-TSS regions are bound to H1T2. David software was used for the analysis and the results are shown in the figure. GO biological processes are represented in the figure with P values. X-axis represents the number of genes associated to the GO term. b Distribution of H1T2 peaks from ± 3 kb centered around TSS of genes in the spermatids genome and heatmap showing the same observation ngs. Plot showing distribution of H1T2 peaks throughout the gene. c GO analysis of 321 genes according to molecular function represented as pie diagram. The number of genes associated to the GO term is given in the pie chart. 23 transcription factors whose promoter-TSS is bound to H1T2 are highlighted in the pie diagram. d Integrative Genomics Viewer (IGV) outputs of representative genomic regions showing the occupancy of H1T2 at various transcription factors of the spermatid genome
Fig. 5
Fig. 5
Validation of H1T2 ChIP-sequencing data by ChIP PCR analysis of representative genes bound to the linker histone H1T2. a Screenshots of H1T2 ChIP peaks displayed from Integrative Genomics Viewer. Shown are 15 different genomic regions associated to H1T2. The y-axis unit is reads per million (rpm).The x-axis represent the genomic positions in base pairs as follows: Chr1:23977211–23977579; Chr16:47717217–47717457; Chr20:22882800–22883032; Chr16:36080014–36080219; Chr8:118206347–118206725; Chr19:37599804–37600003; Chr6:42092121–42092366; Chr8:75994988–75995401; chr17:33949714–33950006; Chr3:147864851–147865149; Chr5:173429327–173430483; Chr1:213008609–213009881; Chr15:33478042–33479362; Chr5:1682868–1683456; ChrY:1588659–1589079. b Bar graphs showing H1T2 ChIP-PCR results represented as % of input. The first seven regions represents the H1T2 occupancy in transcription factors and the next group of three regions represent the H1T2 bound developmental genes while the remaining regions shows the preferential binding of H1T2 to the repeat elements. A negative control region (specific regions of chr 15) was also included for ChIP PCR, where no peaks were present according to the data analysis and visualization. Results are from three independent experiments and error bars represent standard deviation. *shows comparison with IgG control and # shows comparison with IP + pep group. ***(P ≤ 0.001), **(P ≤ 0.01), *(P ≤ 0.05)
Fig. 6
Fig. 6
Nucleosome IP/Mass spectrometry analysis for the identification of H1T2-nucleosome interacting proteins. a Schematic of the nucleosome IP and mass spectrometry protocol used. b Schematic shows the complete list of interacting proteins of H1T2-associated chromatin with top protein hits with more than 15 unique peptides, identified by mass spectrometric analysis of the H1T2 immunoprecipitated chromatin. c Gene ontology analysis of the proteins identified in our MS analysis. Diagrammatic representation (bar diagram) of functional classes of H1T2 interacting proteins according to molecular function (P values are given) and pie chart representation of GO biological process associated to the interacting proteins. d Different functional classes of H1T2 interacting proteins mainly related to spermatogenesis and sperm function. e Validation of proteins associated to H1T2–chromatin identified by mass spectrometry by IP/ WB analysis
Fig. 6
Fig. 6
Nucleosome IP/Mass spectrometry analysis for the identification of H1T2-nucleosome interacting proteins. a Schematic of the nucleosome IP and mass spectrometry protocol used. b Schematic shows the complete list of interacting proteins of H1T2-associated chromatin with top protein hits with more than 15 unique peptides, identified by mass spectrometric analysis of the H1T2 immunoprecipitated chromatin. c Gene ontology analysis of the proteins identified in our MS analysis. Diagrammatic representation (bar diagram) of functional classes of H1T2 interacting proteins according to molecular function (P values are given) and pie chart representation of GO biological process associated to the interacting proteins. d Different functional classes of H1T2 interacting proteins mainly related to spermatogenesis and sperm function. e Validation of proteins associated to H1T2–chromatin identified by mass spectrometry by IP/ WB analysis
Fig. 7
Fig. 7
Identification of histone PTMs associated to H1T2 bound chromatin. a Coomassie stained gel of the acid-soluble fractions of H1T2 and IgG immunoprecipitated chromatin samples and the list of histone PTMs identified by MS analysis. b IP/WB analysis of the histone PTMs associated to H1T2 bound chromatin. Western analysis with antibodies against active histone PTMs gave positive signal upon immunoprecipitation with H1T2 antibody, whereas H1T2 bound chromatin was found to be devoid of any repressive modifications
Fig. 8
Fig. 8
Schematic representation of the process of spermiogenesis and chromatin architecture of H1T2 occupied polar apical region of spermatids. a Spermiogenesis is a lengthy post-meiotic developmental process of spermatogenesis in which the round spermatids undergo several morphological and biochemical modifications to form the mature spermatozoa. Substantial remodeling of chromatin during spermiogenesis involves the replacement of standard histones with histone variants (H1t, H1T2, HILS1, H3.3A, and H3.3B) and testes-specific histones (TH2A, TH2B, and TH3) that should favor an open chromatin conformation. Hyperacetylation of H3 and H4 histones probably facilitates the substantial and continuous repackaging of DNA with transition proteins, further replaced by protamines. Leaky transcription of the spermatid genome is considered as a functional consequence of chromatin remodeling in spermatids [121]. b A schematic model showing the involvement of H1T2 in organizing the nucleoskeleton associated active chromatin architecture of the polar apical region of spermatids

Similar articles

Cited by

References

    1. Boerke A, Dieleman SJ, Gadella BM. A possible role for sperm RNA in early embryo development. Theriogenology. 2007;68(Suppl 1):S147–S155. doi: 10.1016/j.theriogenology.2007.05.058. - DOI - PubMed
    1. Ren X, Chen X, Wang Z, Wang D. Is transcription in sperm stationary or dynamic? J Reprod Dev. 2017;63(5):439–443. doi: 10.1262/jrd.2016-093. - DOI - PMC - PubMed
    1. O'Donnell L. Mechanisms of spermiogenesis and spermiation and how they are disturbed. Spermatogenesis. 2014;4(2):e979623. doi: 10.4161/21565562.2014.979623. - DOI - PMC - PubMed
    1. Poccia D. Remodeling of nucleoproteins during gametogenesis, fertilization, and early development. Int Rev Cytol. 1986;105:1–65. doi: 10.1016/S0074-7696(08)61061-X. - DOI - PubMed
    1. Balhorn R. The protamine family of sperm nuclear proteins. Genome Biol. 2007;8(9):227. doi: 10.1186/gb-2007-8-9-227. - DOI - PMC - PubMed

Publication types

LinkOut - more resources