. 2021 Jan 6;23(1):4.
doi: 10.1186/s13075-020-02371-0.

Increased development of radiographic hip osteoarthritis in individuals with high bone mass: a prospective cohort study

Affiliations

Increased development of radiographic hip osteoarthritis in individuals with high bone mass: a prospective cohort study

April Hartley et al. Arthritis Res Ther. .

Abstract

Background: Individuals with high bone mass (HBM) have a greater odds of prevalent radiographic hip osteoarthritis (OA), reflecting an association with bone-forming OA sub-phenotypes (e.g. osteophytosis, subchondral sclerosis). As the role of bone mineral density (BMD) in hip OA progression is unclear, we aimed to determine if individuals with HBM have increased incidence and/or progression of bone-forming OA sub-phenotypes.

Methods: We analysed an adult cohort with and without HBM (L1 and/or total hip BMD Z-score > + 3.2) with pelvic radiographs collected at baseline and 8-year follow-up. Sub-phenotypes were graded using the OARSI atlas. Superior/inferior acetabular/femoral osteophyte and medial/superior joint space narrowing (JSN) grades were summed and Δosteophyte and ΔJSN derived. Pain and functional limitations were quantified using the WOMAC questionnaire. Associations between HBM status and change in OA sub-phenotypes were determined using multivariable linear/logistic regression, adjusting for age, sex, height, total body fat mass, follow-up time and baseline sub-phenotype grade. Generalised estimating equations accounted for individual-level clustering.

Results: Of 136 individuals, 62% had HBM at baseline, 72% were female and mean (SD) age was 59 (10) years. HBM was positively associated with both Δosteophytes and ΔJSN (adjusted mean grade differences between individuals with and without HBM βosteophyte = 0.30 [0.01, 0.58], p = 0.019 and βJSN = 0.10 [0.01, 0.18], p = 0.019). Incident subchondral sclerosis was rare. HBM individuals had higher WOMAC hip functional limitation scores (β = 8.3 [0.7, 15.98], p = 0.032).

Conclusions: HBM is associated with the worsening of hip osteophytes and JSN over an average of 8 years, as well as increased hip pain and functional limitation.

Keywords: BMD; High bone mass; Hip osteoarthritis; Progression; WOMAC.


Conflict of interest statement

The authors have no competing interests to disclose.

Figures

Fig. 1
Fig. 1
Flowchart detailing the baseline population through 8 years, to derive the follow-up population able to be studied
Fig. 2
Fig. 2
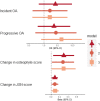
Associations between HBM and incident and progressive OA and change in OA sub-phenotypes. Points for continuous outcomes represent the difference in mean outcome between individuals with and without HBM (for example, a beta of 1 for change in osteophyte score would represent a 1-point greater increase in summed osteophyte score, which is the equivalent of the appearance of one additional osteophyte over 8 years or the increase in the size of an osteophyte already present). Points for binary outcomes represent the odds ratio for individuals with HBM compared to their relatives with normal BMD. Model 1: unadjusted; model 2: adjusted for age, sex and follow-up time (plus baseline score for continuous outcomes); model 3: adjusted for age, sex, follow-up time, height and TBFM (plus baseline score for continuous outcomes). Nincident OA = 248; Ncontinuous outcomes = 263. Abbreviation: JSN joint space narrowing
Fig. 3
Fig. 3
Associations between HBM status and WOMAC pain and function sub-scale scores. Points represent the mean difference in WOMAC scores between individuals with HBM and relatives/spouses without HBM. Person-level analysis, accounting for clustering in families. Follow-up osteophyte and JSN score is the highest of the two hips. Model 1: unadjusted; model 2: adjusted for age and sex; model 3: adjusted for age, sex, height and total body fat mass; model 4: model 3 plus osteophyte severity at follow-up, model 5: model 3 plus JSN severity at follow-up. N = 127

Similar articles

Cited by

References

    1. Cross M, Smith E, Hoy D, Nolte S, Ackerman I, Fransen M, et al. The global burden of hip and knee osteoarthritis: estimates from the global burden of disease 2010 study. Ann Rheum Dis. 2014;73(7):1323–1330. doi: 10.1136/annrheumdis-2013-204763. - DOI - PubMed
    1. Stewart A, Black A, Robins SP, Reid DM. Bone density and bone turnover in patients with osteoarthritis and osteoporosis. J Rheumatol. 1999;26(3):622–626. - PubMed
    1. Glowacki J, Tuteja M, Hurwitz S, Thornhill TS, Leboff MS. Discordance in femoral neck bone density in subjects with unilateral hip osteoarthritis. J Clin Densitom. 2010;13(1):24–28. doi: 10.1016/j.jocd.2009.09.007. - DOI - PubMed
    1. Nevitt MC, Lane NE, Scott JC, Hochberg MC, Pressman AR, Genant HK, et al. Radiographic osteoarthritis of the hip and bone mineral density. The Study of Osteoporotic Fractures Research Group. Arthritis Rheum. 1995;38(7):907–916. doi: 10.1002/art.1780380706. - DOI - PubMed
    1. Chaganti RK, Parimi N, Lang T, Orwoll E, Stefanick ML, Nevitt M, et al. Bone mineral density and prevalent osteoarthritis of the hip in older men for the Osteoporotic Fractures in Men (MrOS) Study Group. Osteoporos Int. 2010;21(8):1307–1316. doi: 10.1007/s00198-009-1105-9. - DOI - PMC - PubMed

Publication types