. 2021 Feb 19;14(2):dmm047555.
doi: 10.1242/dmm.047555.

A muscle growth-promoting treatment based on the attenuation of activin/myostatin signalling results in long-term testicular abnormalities

Affiliations

A muscle growth-promoting treatment based on the attenuation of activin/myostatin signalling results in long-term testicular abnormalities

Danielle Vaughan et al. Dis Model Mech. .

Abstract

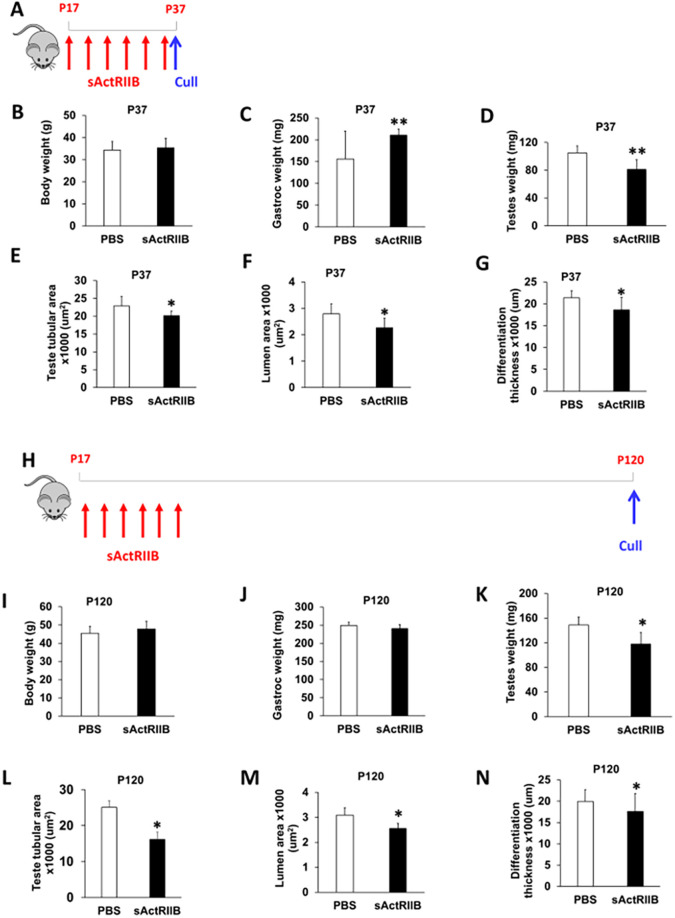
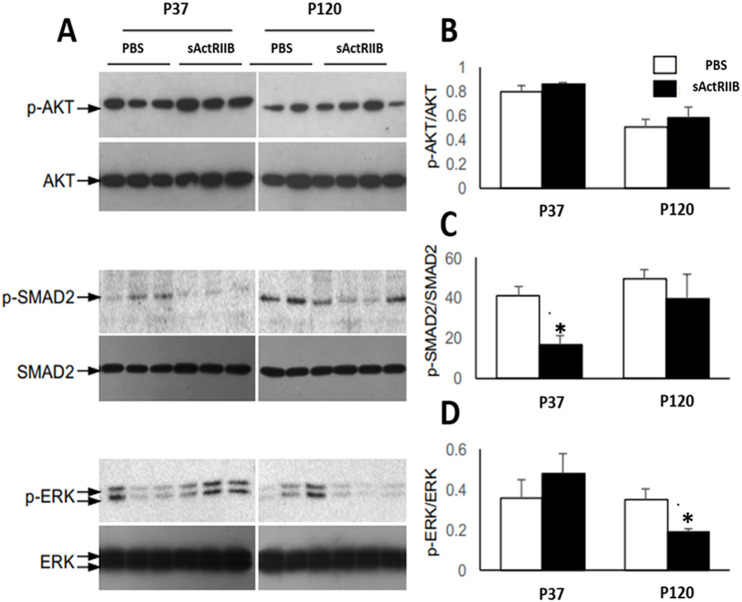
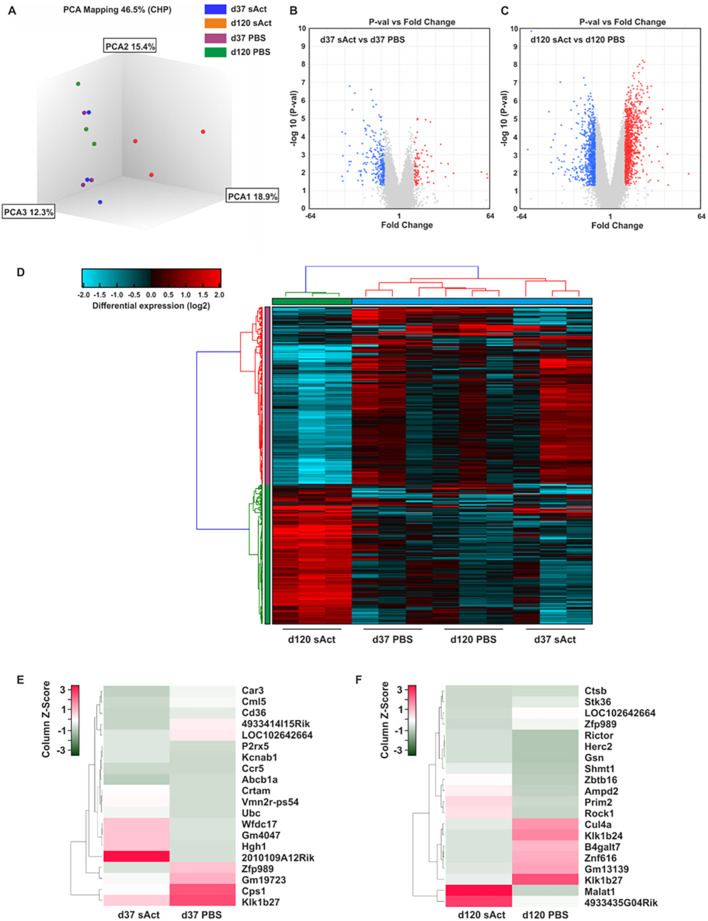
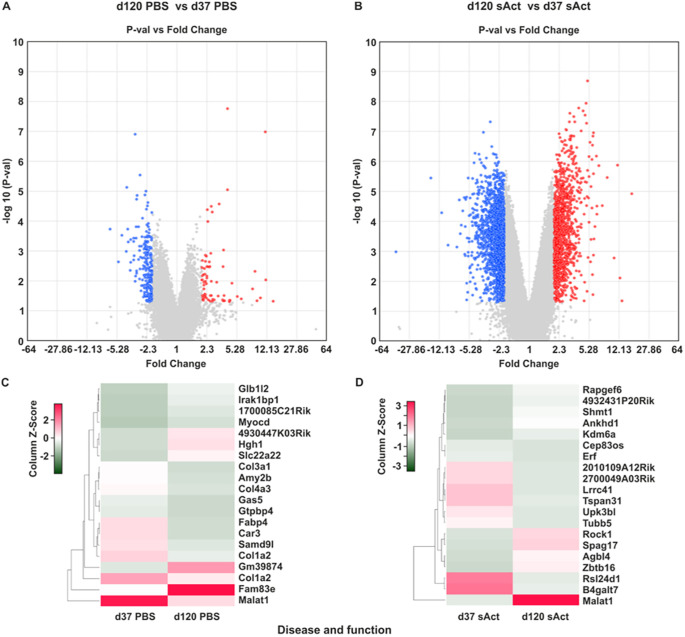
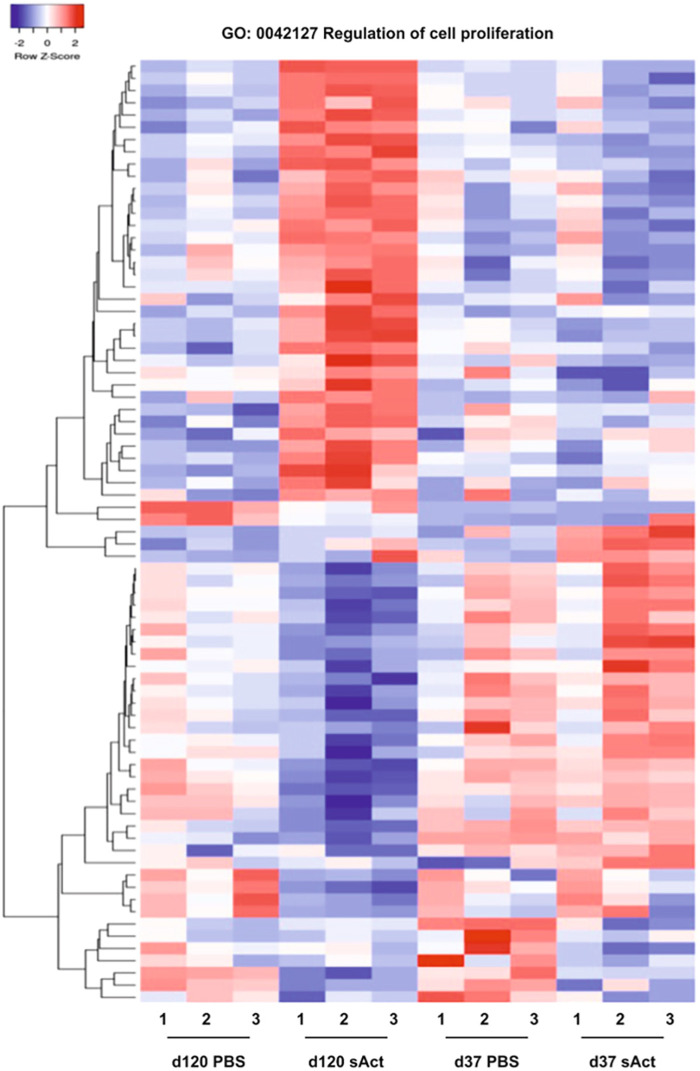
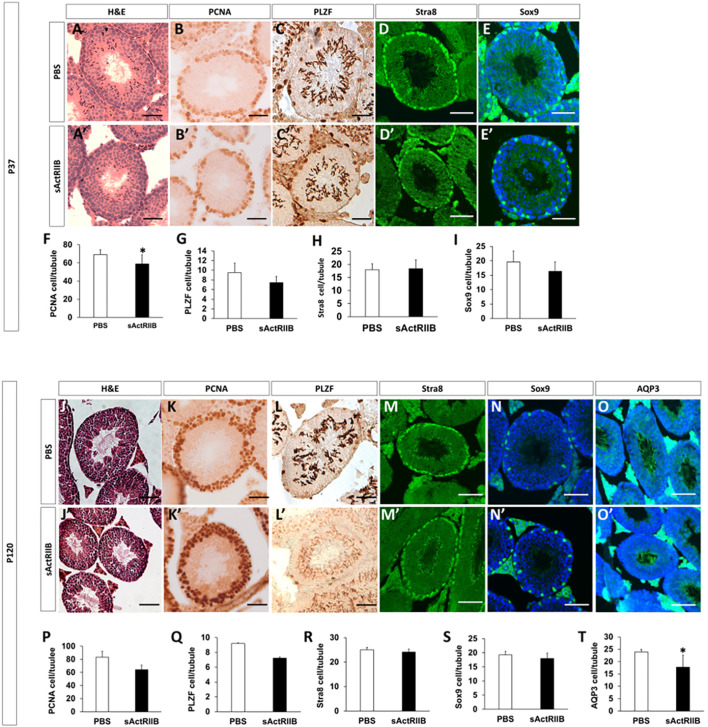
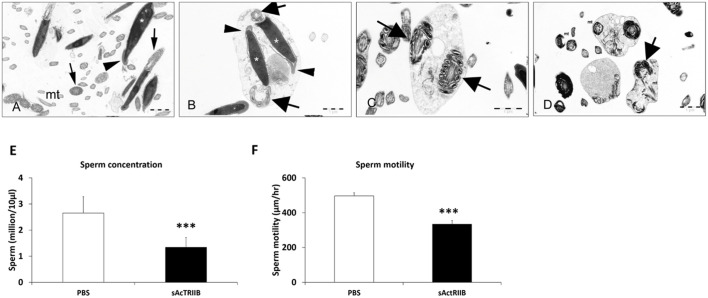
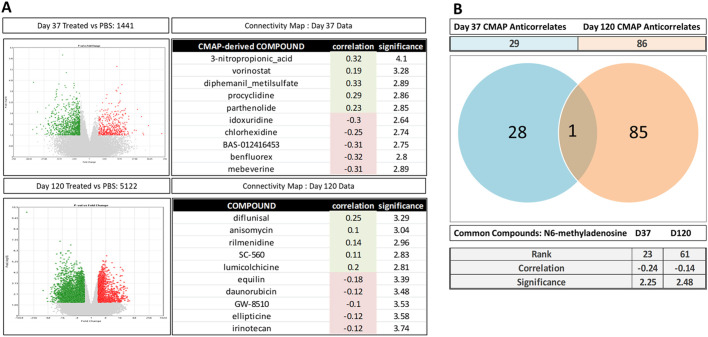
Activin/myostatin signalling acts to induce skeletal muscle atrophy in adult mammals by inhibiting protein synthesis as well as promoting protein and organelle turnover. Numerous strategies have been successfully developed to attenuate the signalling properties of these molecules, which result in augmenting muscle growth. However, these molecules, in particular activin, play major roles in tissue homeostasis in numerous organs of the mammalian body. We have recently shown that although the attenuation of activin/myostatin results in robust muscle growth, it also has a detrimental impact on the testis. Here, we aimed to discover the long-term consequences of a brief period of exposure to muscle growth-promoting molecules in the testis. We demonstrate that muscle hypertrophy promoted by a soluble activin type IIB ligand trap (sActRIIB) is a short-lived phenomenon. In stark contrast, short-term treatment with sActRIIB results in immediate impact on the testis, which persists after the sessions of the intervention. Gene array analysis identified an expansion in aberrant gene expression over time in the testis, initiated by a brief exposure to muscle growth-promoting molecules. The impact on the testis results in decreased organ size as well as quantitative and qualitative impact on sperm. Finally, we have used a drug-repurposing strategy to exploit the gene expression data to identify a compound - N6-methyladenosine - that may protect the testis from the impact of the muscle growth-promoting regime. This work indicates the potential long-term harmful effects of strategies aimed at promoting muscle growth by attenuating activin/myostatin signalling. Furthermore, we have identified a molecule that could, in the future, be used to overcome the detrimental impact of sActRIIB treatment on the testis.

Keywords: Activin; Gene array; Muscle; Myostatin; Testis.


Conflict of interest statement

Competing interestsThe authors declare no competing or financial interests.

Figures

Fig. 1.
Fig. 1.
sActRIIB causes a reduction in testicular development in mice at P37 and P120. (A) Schematic of experimental design for P37 treatment. Red arrows indicate injection of 10 mg/kg sActRIIB; blue arrow indicates time of cull. (B-G) For P37, body weight (B), gastrocnemius mass (C), testis mass (D), average tubule area (E), average lumen area (F) and average differentiation thickness (G) in the PBS- and sActRIIB-treated mice. n=7 PBS-treated male mice, n=7 sActRIIB-treated male mice. (H) Schematic of experimental design for P120 treatment. Red arrows indicate injection of 10 mg/kg sActRIIB; blue arrow indicates time of cull. (I-N) For P120, body weight (I), gastrocnemius mass (J), testis mass (K), average tubule area (L), average lumen area (M) and average differentiation thickness (N) in the PBS- and sActRIIB-treated mice. n=4 PBS-treated male mice, n=4 sActRIIB-treated male mice. Unpaired Student's t-test was used to determine statistical significance. *P<0.05, **P<0.01.
Fig. 2.
Fig. 2.
Altered signalling in testis upon sActRIIB treatment. (A) Immunoblot analyses of testis lysates from P35 (young) or P120 (adult) mice treated with PBS or sActRIIB (see Materials and Methods for treatment times) for either phosphorylated (p) or total target proteins (AKT, SMAD2 and ERK) as indicated. (B-D) Bar graphs representing densitometric quantification of phosphorylated target protein normalised to total target protein from the western blotting experiments shown in A: pAKT/AKT (B), pSMAD2/SMAD2 (C) and pERK/ERK (D). Unpaired Student's t-test was used to determine statistical significance. n=3, *P<0.05.
Fig. 3.
Fig. 3.
Bioinformatic comparison of the gene expression in sActRIIB-treated mice and control animals. (A) Principal component 3D-analysis (PCA) of the gene expression data set. Each dot represents a sample. (B,C) Volcano plot analysis showing log2 fold change and P-value of each transcript. Each gene is represented by a dot on the graph. The x-axis represents the log2 value of fold change, and the y-axis represents the t-statistic as log10 P-value. Coloured dots represent the genes that are ≥2-fold upregulated (red) or downregulated (blue) with a P-value lower than 0.05. In total, 355 genes were found to be differentially expressed in sActRIIB-treated animals and controls at P37 (B), and 1801 genes were found to be differentially expressed at P120 (C). (D) Hierarchical clustering. Each column represents one individual animal. The colour and intensity of the boxes are used to represent changes (not absolute values) in gene expression. Red represents upregulated genes; blue represents downregulated genes; black represents unchanged expression. Only genes significantly (P<0.05) differentially expressed with a 3-fold minimal change in expression are illustrated. (E,F) Heat map representations of differentially expressed transcripts at P37 (E) and P120 (F), with the highest degree of change sorted according to z-score ranking. Euclidean distance measures and average leaf clustering were applied to rows. The list of differentially altered transcripts with the highest degree of change of expression in each condition is shown in the column on the right (corresponding gene symbols). The colours correspond to the z-score, ranging from green (low expression) to red (high expression).
Fig. 4.
Fig. 4.
Bioinformatic comparison of testis gene expression in sActRIIB-treated mice. (A,B) Volcano plot analysis showing log2 fold change and P-value of each transcript at P120 versus P37 in PBS-treated mice (A) and sActRIIB-treated mice (B). The x-axis represents the log2 value of fold change, and the y-axis represents the t-statistic as log10 P-value. Coloured dots represent the genes that are ≥2-fold up- or downregulated with a P-value lower than 0.05. Upregulated and downregulated genes are highlighted in red and blue, respectively. (C,D) Heat map representations of differentially expressed transcripts with the highest degree of change, sorted according to z-score ranking, in PBS-treated mice (C) and sActRIIB-treated mice (D). Euclidean distance measures and average leaf clustering were applied to rows. The list of differentially altered transcripts with the highest degree of change of expression in a given condition is shown in the column on the right (corresponding gene symbols).
Fig. 5.
Fig. 5.
Heat map representations of differentially expressed transcripts within the gene ontology category ‘Regulation of cell proliferation’. Euclidean distance measures and average leaf clustering were applied to rows. The experimental conditions are indicated on the bottom. Each column represents one individual animal.
Fig. 6.
Fig. 6.
Histological and immunocytochemical analysis of testis. (A-I) Tissue from P37 mice. (A,A′) H&E staining of seminiferous tubules in PBS- (A) and sActRIIB-treated (A′) mice, showing smaller tubules in the sActRIIB-treated mice. (B,B′) PCNA-positive cells in the tubules of PBS- (B) and sActRIIB-treated (B′) mice, showing a reduction in PCNA-positive cells in the sActRIIB-treated mice. (C,C′) PLZF-positive cells in the tubules of PBS- (C) and sActRIIB-treated (C′) mice. (D,D′) Stra8-positive cells in the tubules of PBS- (D) and sActRIIB-treated (D′) mice. (E,E′) Sox9-positive cells in the tubules of PBS- (E) and sActRIIB-treated (E′) mice. (F) Quantification of PCNA-positive cells per tubule. (G) Quantification of PLZF-positive cells per tubule. (H) Quantification of Stra8-positive cells per tubule. (I) Quantification of Sox9-positive cells per tubule. n=7 PBS-treated male mice, n=7 sActRIIB-treated male mice. (J-T) Tissue from P120 mice. (J,J′) H&E staining of seminiferous tubules in PBS- (J) and sActRIIB-treated (J′) mice, showing smaller tubules in the sActRIIB-treated mice. (K,K′) PCNA-positive cells in the tubules of PBS- (K) and sActRIIB-treated (K′) mice, showing a reduction in PCNA-positive cells in the sActRIIB-treated mice. (L,L′) PLZF-positive cells in the tubules of PBS- (L) and sActRIIB-treated (L′) mice. (M,M′) Stra8-positive cells in the tubules of PBS- (M) and sActRIIB-treated (M′) mice. (N,N′) Sox9-positive cells in the tubules of PBS- (N) and sActRIIB-treated (N′) mice. (O,O′) AQP3-positive cells in the tubules of PBS- (O) and sActRIIB-treated (O′) mice. (P) Quantification of PCNA-positive cells per tubule. (Q) Quantification of PLZF-positive cells per tubule. (R) Quantification of Stra8-positive cells per tubule. (R) Quantification of Sox9-positive cells per tubule. (T) Quantification of AQP3-positive tubules as a percentage of total tubules. n=4 PBS-treated male mice, n=4 sActRIIB-treated male mice. Scale bars: 50 µm. Unpaired Student's t-test was used to determine statistical significance. *P<0.05. H&E, Haemotoxylin and Eosin; PCNA, proliferating cell nuclear antigen; PLZF, promyelocytic leukemia zinc finger; Sox9, SRY-box 9; Stra8, stimulated by retinoic acid 8.
Fig. 7.
Fig. 7.
sActRIIB treatment disrupts spermatozoa morphology, sperm concentration and sperm speed when administered to CD1 mice from P17 until P120. (A) Transmission electron microscopy of sperm revealed normal spermatozoa morphology in mice treated with vehicle. Acrosome (arrowhead), nuclei (asterisk), midpiece with mitochondrial sheath (arrows), and numerous longitudinal and cross sections of the principal and end pieces showing regular arrangement of microtubules (mt) and outer dense filaments, are shown. (B-D) In the sActRIIB group, few intact spermatozoa were detectable. Instead, a lot of cell debris and displastic sperm was detectable (asterisks, B). This included immature, round sperm containing doubled nuclei (arrowheads, B), with normal acrosomes (arrows, C) and doubled midpieces (arrows, B,D). Spermatozoa also displayed degenerating mitochondria (mt, D) and disarranged microtubules (D) and outer dense filaments. Scale bars: 1 µm. (E) Sperm concentration at 17 weeks of age. (F) Sperm speeds at 17 weeks of age. n=6 PBS-treated male CD1 mice, n=6 sActRIIB-treated male CD1 mice. Unpaired Student's t-test was used to determine statistical significance. ***P<0.001.
Fig. 8.
Fig. 8.
Connectivity Map (CMAP)-based drug identification. (A) Differential gene expression analysis between P37 and P120 conditions are represented as volcano plots (P>0.01, fold change >±2) and top five correlate and anti-correlate CMAP-derived drug matches at each time point. (B) Venn diagram and CMAP scores of the unique and common drug compound between P37 and P120.

Similar articles

Cited by

References

    1. Afzelius, B. A. (1976). A human syndrome caused by immotile cilia. Science 193, 317-319. 10.1126/science.1084576 - DOI - PubMed
    1. Alyodawi, K., Vermeij, W. P., Omairi, S., Kretz, O., Hopkinson, M., Solagna, F., Joch, B., Brandt, R. M. C., Barnhoorn, S., van Vliet, N.et al. (2019). Compression of morbidity in a progeroid mouse model through the attenuation of myostatin/activin signalling. J. Cachexia Sarcopenia Muscle 10, 662-686. 10.1002/jcsm.12404 - DOI - PMC - PubMed
    1. Amlani, S. and Vogl, A. W. (1988). Changes in the distribution of microtubules and intermediate filaments in mammalian Sertoli cells during spermatogenesis. Anat. Rec. 220, 143-160. 10.1002/ar.1092200206 - DOI - PubMed
    1. Amthor, H., Nicholas, G., Mckinnell, I., Kemp, C. F., Sharma, M., Kambadur, R. and Patel, K. (2004). Follistatin complexes Myostatin and antagonises Myostatin-mediated inhibition of myogenesis. Dev. Biol. 270, 19-30. 10.1016/j.ydbio.2004.01.046 - DOI - PubMed
    1. Babicki, S., Arndt, D., Marcu, A., Liang, Y., Grant, J. R., Maciejewski, A. and Wishart, D. S. (2016). Heatmapper: web-enabled heat mapping for all. Nucleic Acids Res. 44, W147-W153. 10.1093/nar/gkw419 - DOI - PMC - PubMed

Publication types

MeSH terms

LinkOut - more resources