. 2021 Jan;9(1):e000832.
doi: 10.1136/jitc-2020-000832.

Skin dendritic cells in melanoma are key for successful checkpoint blockade therapy

Affiliations

Skin dendritic cells in melanoma are key for successful checkpoint blockade therapy

Anastasia Prokopi et al. J Immunother Cancer. 2021 Jan.

Abstract

Background: Immunotherapy with checkpoint inhibitors has shown impressive results in patients with melanoma, but still many do not benefit from this line of treatment. A lack of tumor-infiltrating T cells is a common reason for therapy failure but also a loss of intratumoral dendritic cells (DCs) has been described.

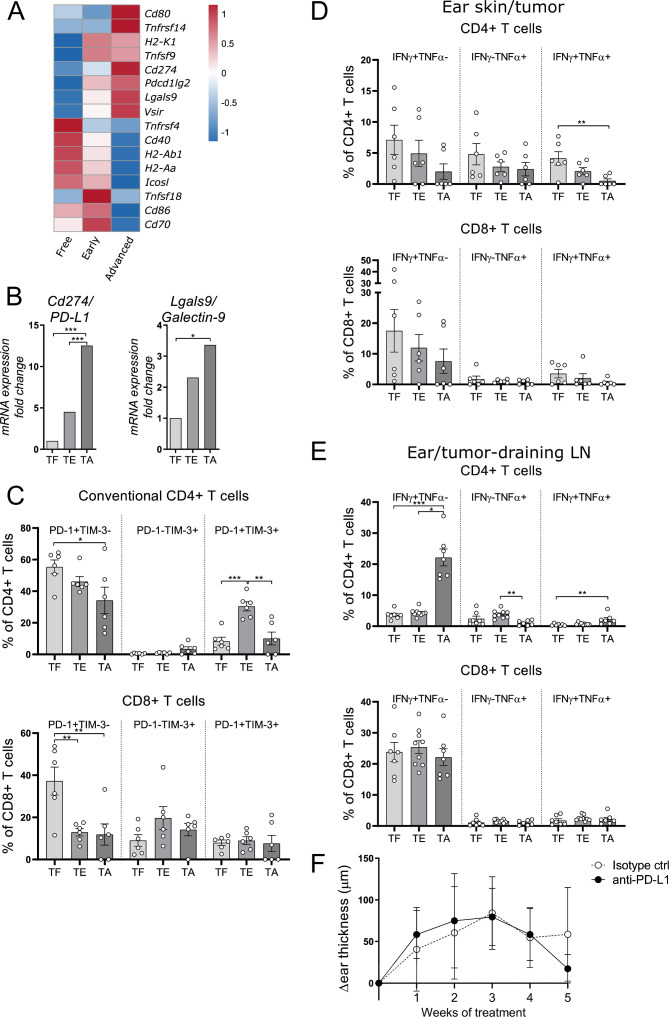
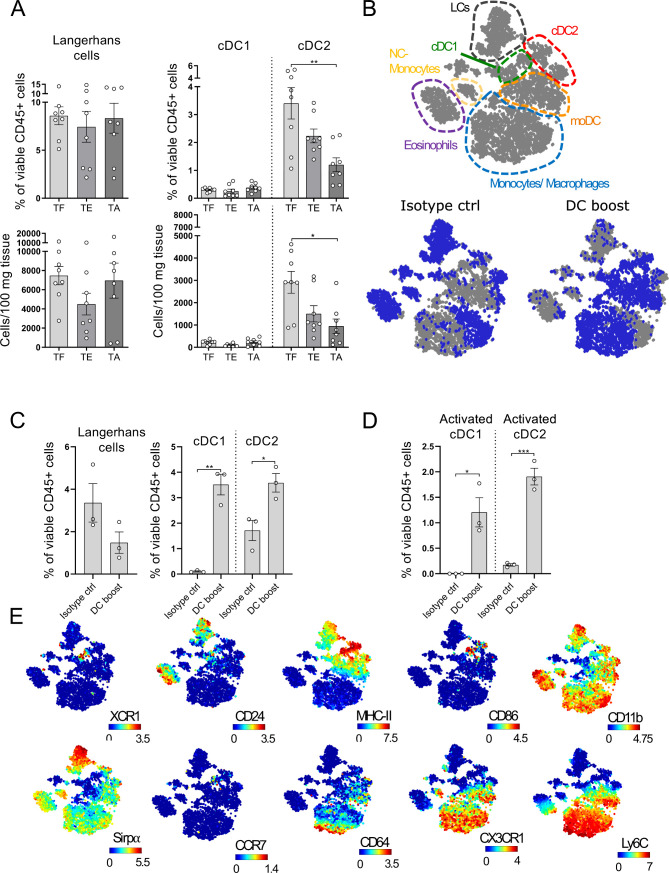
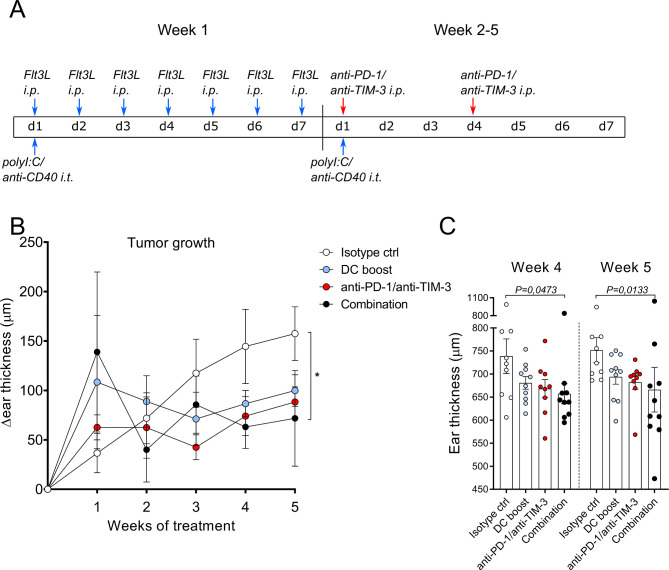
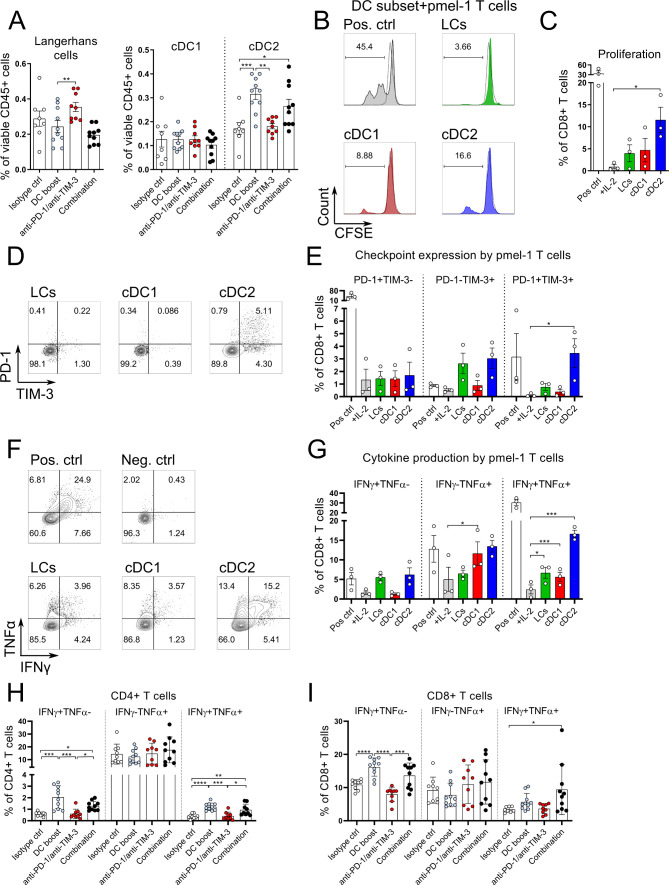
Methods: We used the transgenic tg(Grm1)EPv melanoma mouse strain that develops spontaneous, slow-growing tumors to perform immunological analysis during tumor progression. With flow cytometry, the frequencies of DCs and T cells at different tumor stages and the expression of the inhibitory molecules programmed cell death protein-1 (PD-1) and T-cell immunoglobulin and mucin-domain containing-3 (TIM-3) on T cells were analyzed. This was complemented with RNA-sequencing (RNA-seq) and real-time quantitative PCR (RT-qPCR) analysis to investigate the immune status of the tumors. To boost DC numbers and function, we administered Fms-related tyrosine 3 ligand (Flt3L) plus an adjuvant mix of polyI:C and anti-CD40. To enhance T cell function, we tested several checkpoint blockade antibodies. Immunological alterations were characterized in tumor and tumor-draining lymph nodes (LNs) by flow cytometry, CyTOF, microarray and RT-qPCR to understand how immune cells can control tumor growth. The specific role of migratory skin DCs was investigated by coculture of sorted DC subsets with melanoma-specific CD8+ T cells.

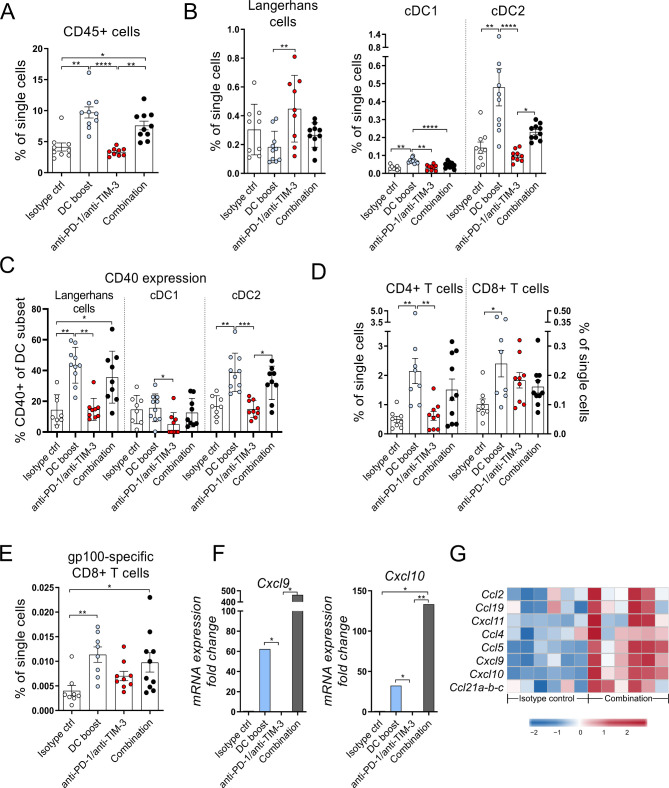
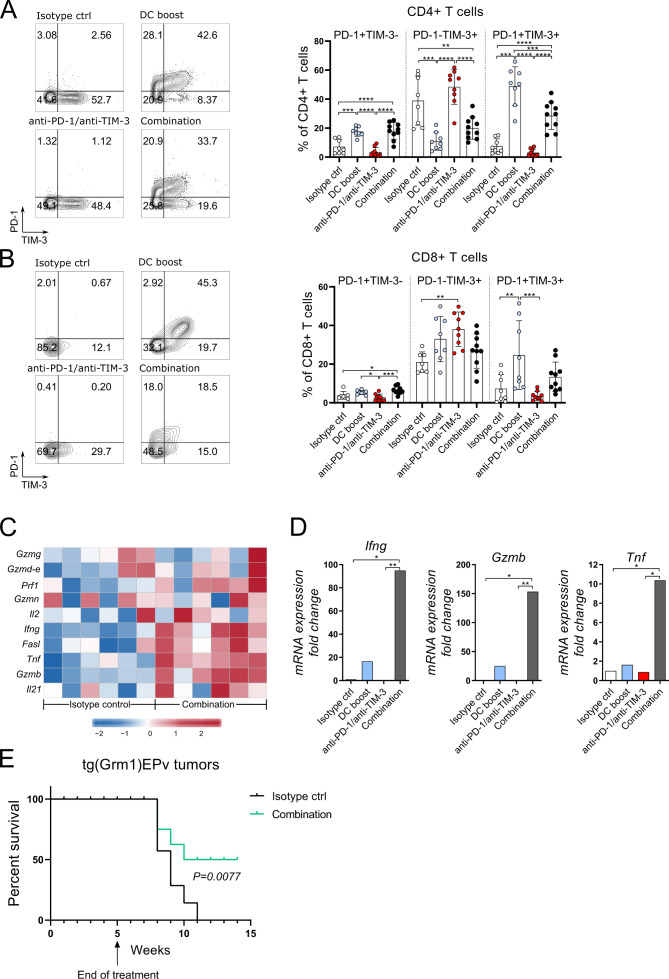
Results: Our study revealed that tumor progression is characterized by upregulation of checkpoint molecules and a gradual loss of the dermal conventional DC (cDC) 2 subset. Monotherapy with checkpoint blockade could not restore antitumor immunity, whereas boosting DC numbers and activation increased tumor immunogenicity. This was reflected by higher numbers of activated cDC1 and cDC2 as well as CD4+ and CD8+ T cells in treated tumors. At the same time, the DC boost approach reinforced migratory dermal DC subsets to prime gp100-specific CD8+ T cells in tumor-draining LNs that expressed PD-1/TIM-3 and produced interferon γ (IFNγ)/tumor necrosis factor α (TNFα). As a consequence, the combination of the DC boost with antibodies against PD-1 and TIM-3 released the brake from T cells, leading to improved function within the tumors and delayed tumor growth.

Conclusions: Our results set forth the importance of skin DC in cancer immunotherapy, and demonstrates that restoring DC function is key to enhancing tumor immunogenicity and subsequently responsiveness to checkpoint blockade therapy.

Keywords: dendritic cells; immunomodulation; immunotherapy; melanoma; tumor microenvironment.


Conflict of interest statement

Competing interests: None declared.

Figures

Figure 1
Figure 1
Immunosuppressive molecules increase with tumor progression. (A) RNA-seq analysis was performed with ear skin/tumor tissue from TF (tumor-free), tumor-early (TE) and TA (tumor-advanced) tg(Grm1)EPv mice. The heatmap depicts normalized and relative expression (z-score) levels of several checkpoint ligands. Mean expression for three mice per group is shown. (B) The mRNA levels of programmed death ligand-1 (PD-L1) and Galectin-9 from ear skin/tumors of TF, TE, TA mice were quantified by real-time quantitative PCR. Fold change in comparison to the TF stage is shown for five to six mice per group from one to two independent experiments. (C) Percentages of PD-1+ and TIM-3+ conventional CD4+ and CD8+ T cells from ear skin/tumors of TF, TE, TA tg(Grm1)EPv mice were determined by flow cytometry. Summary graph for seven mice per group from four independent experiments is shown. (D, E) Cell suspensions from ear skin/tumors (D) and draining lymph nodes (LNs) (E) were restimulated in vitro with anti-CD3/anti-CD28 mAbs. The percentages of interferon γ (IFNγ) and tumor necrosis factor α (TNFα) producing CD4+ and CD8+ T cells were analyzed by flow cytometry. Results are from three independent experiments with six to eight mice per group. (F) Tg(Grm1)EPv mice at the transition from TE to TA stage (6.5–7 months old) were treated intraperitoneally with anti-PD-L1 mAb twice per week. Tumor growth was determined by measuring ear thickness changes over time. Results for six mice per group from two independent experiments are shown. Statistical significance was determined using one-way analysis of variance or Kruskal-Wallis analysis (B–E) and two-tailed unpaired Student’s t-test (F). Graphs show the mean ± SE. *p<0.05; **p<0.01; ***p<0.001.
Figure 2
Figure 2
Dendritic cells (DCs) gradually decrease in melanoma lesions and can be restored by a DC boost approach. (A) Ear skin/tumors of TF (tumor-free), tumor-early (TE) and tumor-advanced (TA) tg(Grm1)EPv mice were analyzed by flow cytometry for the percentages of skin DC subsets (gating strategy shown in online supplemental figure S2A). Results from six to eight to 8 mice per group from five independent experiments are shown. (B) tg(Grm1)EPv mice at the transition from TE to TA stage (6.5–7 months old) were treated as illustrated in online supplemental figure S2C. Changes in the myeloid cells were determined by mass cytometry. Top panel: the different populations shown in the viSNE map were identified by manual gating (online supplemental figure S2D). Bottom panels: In blue, the distribution of the identified cells for isotype control (left) and DC boost (right) treated mice are shown. (C) The frequencies of the different skin DC subsets in isotype and DC boost treated mice were determined. (D) The frequencies of activated cDC1 and cDC2 as determined by CD86 expression are shown. (E) Surface expression of XCR1, CD24, MHC-II, CD86, CD11b, Sirpα, CCR7, CD64, CX3CR1 and Ly6C by the various myeloid subsets are shown on the viSNE plots. For (B)–(E) results for three mice from two independent measurements are shown. Statistical significance was determined using one-way analysis of variance or Kruskal-Wallis analysis (A) and two-tailed unpaired Student’s t-test (C and D). Graphs show the mean ± SE. *p<0.05; **p<0.01; ***p<0.001.
Figure 3
Figure 3
Boosting dendritic cell (DC) numbers and function facilitates responsiveness to checkpoint blockade. (A) The treatment scheme for isotype control, DC boost, checkpoint blockade and combination therapies over 5 weeks is depicted. DC boost consisted of daily injections of 10 µg Fms-related tyrosine 3 ligand (Flt3L) intraperitoneally (i.p.) during the first week of treatment and weekly intratumoral injections of polyI:C and anti-CD40 (25 µg each per mouse). Checkpoint blockade consisted of i.p. injections of 100 µg/mouse of both anti-PD-1 and anti-TIM-3 blocking mAbs and was administered twice per week starting from the second week. Blue arrows indicate DC boost interventions and red arrows indicate checkpoint blockade. Mice in the combination group received treatment with DC boost and checkpoint blockade. Isotype control therapy consisted of PBS instead of Flt3L and polyI:C and isotype control antibodies for anti-CD40, anti-PD-1/anti-TIM-3. (B) Tg(Grm1)EPv mice at the transition from tumor-early (TE) to tumor-advanced (TA) stage were treated and ear thickness changes for 8–10 mice per group from two independent experiments were measured weekly. *p<0.05. (C) Ear thickness measured at weeks 4 and 5 is shown. Statistical significance was determined using the Kruskal-Wallis analysis for (B) and (C). PD-1, programmed cell death protein-1; TIM-3, T-cell immunoglobulin and mucin-domain containing-3.
Figure 4
Figure 4
The DC boost results in increased infiltration of activated dendritic cells (DCs) and T cells into tumors. Tg(Grm1)EPv mice at the transition from tumor-early (TE) to tumor-advanced (TA) stage were treated for 5 weeks as described in figure 3A. (A–E) Frequencies of the CD45+ immune cells (A), skin DC subsets (B), CD40 expression on DC subsets (C), CD4+ and CD8+ tumor-infiltrating T cells (D) and gp100-specific CD8+ T cells (E) were determined by flow cytometry. For (A)–(E), n=8–10 mice per group from two independent experiments. (F) The mRNA levels for Cxcl9 and Cxcl10 were quantified by real-time quantitative PCR. Fold change in comparison to the isotype control is shown for n=4–6 mice per group from three independent experiments. (G) Tumor RNA from isotype control and combination therapy treated mice was analyzed by microarray. Heatmap from microarray data displaying the normalized and relative expression (z-score) of genes associated with lymphocyte trafficking. n=6 mice per group from two independent experiments. For (A)–(F), statistical significance was determined using one-way analysis of variance or Kruskal-Wallis analysis. Graphs show the mean ± SE. *p<0.05; **p<0.01; ***p<0.001; ****p<0.0001. PD-1, programmed cell death protein-1; TIM-3, T-cell immunoglobulin and mucin-domain containing-3.
Figure 5
Figure 5
DC boost treatment improves antitumor immune responses in the draining lymph node. (A) Tg(Grm1)EPv mice at the transition from tumor-early (TE) to tumor-advanced (TA) stage were treated for 5 weeks as described in figure 3A. Percentages of migratory skin dendritic cell (DC) subsets were determined by flow cytometry in the tumor draining lymph nodes (LNs). (B–G) Tg(Grm1)EPv/Langerin-EGFP mice at the transition from TE to TA stage were treated with the DC boost regimen as in online supplemental figure S2C. The three main migratory skin DC subsets (LCs, cDC1, cDC2) were sorted from the tumor-draining LNs (see online supplemental figure S4C for sorting strategy). Sorted DCs were cocultured with gp100-specific CD8+ T cells isolated from pmel-1 mice in a ratio of DCs:T cells 1:3 for 3 days. As a negative control, T cells were cultured without stimulation but with IL-2 only (+IL-2). T cells cocultured with gp100 peptide loaded DCs served as positive control (Pos ctrl). (B) Representative histograms showing carboxyfluorescein succinimidyl ester (CFSE) dilution of CD8+ T cells in response to the different DC subsets. (C) Percentages of proliferated CD8+ T cells from three independent experiments. (D) Representative dot plots showing the expression of PD-1 and TIM-3 on the CD8+ T cells after 3 days of coculture with the different DC subsets. (E) Percentages of PD-1+ and TIM-3+ CD8+ T cells from three experiments. (F) At day 3 of coculture, CD8+ T cells were restimulated with anti-CD3/anti-CD28 mAbs and production of IFNγ and TNFα was measured by intracellular flow cytometry. Representative dot plots showing cytokine production by T cells in response to the different DC subsets. (G) Percentages of IFNγ+ and of TNFα+ CD8+ T cells from three experiments are shown. (H and I) LN cell suspensions of Tg(Grm1)EPv mice at the transition from TE to TA stage that were treated for 5 weeks as described in figure 3A were restimulated in vitro with anti-CD3/anti-CD28 mAbs. Percentages of IFNγ+ and TNFα+ CD4+ T cells (H) and CD8+ T cells (I) were analyzed by flow cytometry. Statistical significance was determined using one-way analysis of variance (ANOVA) or Kruskal-Wallis analysis (A, H, I), Friedman test (C and E) and repeated-measures one-way ANOVA (G). Graphs show the mean ± SE. *p<0.05; **p<0.01; ***p<0.001; ****p<0.0001. IFNγ, interferon γ; PD-1, programmed cell death protein-1; TIM-3, T-cell immunoglobulin and mucin-domain containing-3; TNFα, tumor necrosis factor α.
Figure 6
Figure 6
Combination of DC boost with checkpoint blockade of programmed cell death protein-1 (PD-1) and T-cell immunoglobulin and mucin-domain containing-3 (TIM-3) results in a higher cytotoxic activity in the tumor. Tg(Grm1)EPv mice at the transition from tumor-early (TE) to tumor-advanced (TA) stage were treated for 5 weeks as described in figure 3A. Representative contour plots and summary graphs depicting PD-1 and TIM-3 expression of CD4+ (A) and CD8+ (B) T cells from tumors of mice from different treatment groups. n=8–10 mice per group from two independent experiments. (C) Tumor RNA from isotype control and combination therapy treated mice was analyzed by microarray. The heatmap depicts the normalized and relative expression (z-score) of genes associated with immune-mediated cytotoxicity for six mice per group from two experiments. (D) The mRNA levels for Ifng, Tnf and GzmB were quantified by real-time quantitative PCR. Fold change in comparison to the isotype control is shown for four to six mice per group from three independent experiments. (E) Long-term survival of tg(Grm1)EPv mice after cessation of treatment at week five in isotype control and combination treatment groups (treatment scheme in figure 3A). Six mice per group from one experiment are shown. Statistical significance was determined with one-way analysis of variance or Kruskal-Wallis analysis (A, B and D) or log-rank (Mantel-Cox) test (E). Graphs in (A), (B) and (D) show the mean±SE. *p<0.05; **p<0.01; ***p<0.001; ****p<0.0001.

Similar articles

Cited by

References

    1. Bray F, Ferlay J, Soerjomataram I, et al. . Global cancer statistics 2018: GLOBOCAN estimates of incidence and mortality worldwide for 36 cancers in 185 countries. CA Cancer J Clin 2018;68:394–424. 10.3322/caac.21492 - DOI - PubMed
    1. Ribas A, Wolchok JD. Cancer immunotherapy using checkpoint blockade. Science 2018;359:1350–5. 10.1126/science.aar4060 - DOI - PMC - PubMed
    1. Sharma P, Allison JP. Immune checkpoint targeting in cancer therapy: toward combination strategies with curative potential. Cell 2015;161:205–14. 10.1016/j.cell.2015.03.030 - DOI - PMC - PubMed
    1. Joyce JA, Fearon DT. T cell exclusion, immune privilege, and the tumor microenvironment. Science 2015;348:74–80. 10.1126/science.aaa6204 - DOI - PubMed
    1. Garris CS, Arlauckas SP, Kohler RH, et al. . Successful anti-PD-1 cancer immunotherapy requires T Cell-Dendritic cell crosstalk involving the cytokines IFN-γ and IL-12. Immunity 2018;49:1148–61. 10.1016/j.immuni.2018.09.024 - DOI - PMC - PubMed

Publication types

MeSH terms

LinkOut - more resources