. 2021 May;101(5):661-676.
doi: 10.1038/s41374-020-00518-w. Epub 2021 Jan 6.

Large-scale, three-dimensional tissue cytometry of the human kidney: a complete and accessible pipeline

Collaborators, Affiliations

Large-scale, three-dimensional tissue cytometry of the human kidney: a complete and accessible pipeline

Michael J Ferkowicz et al. Lab Invest. 2021 May.

Abstract

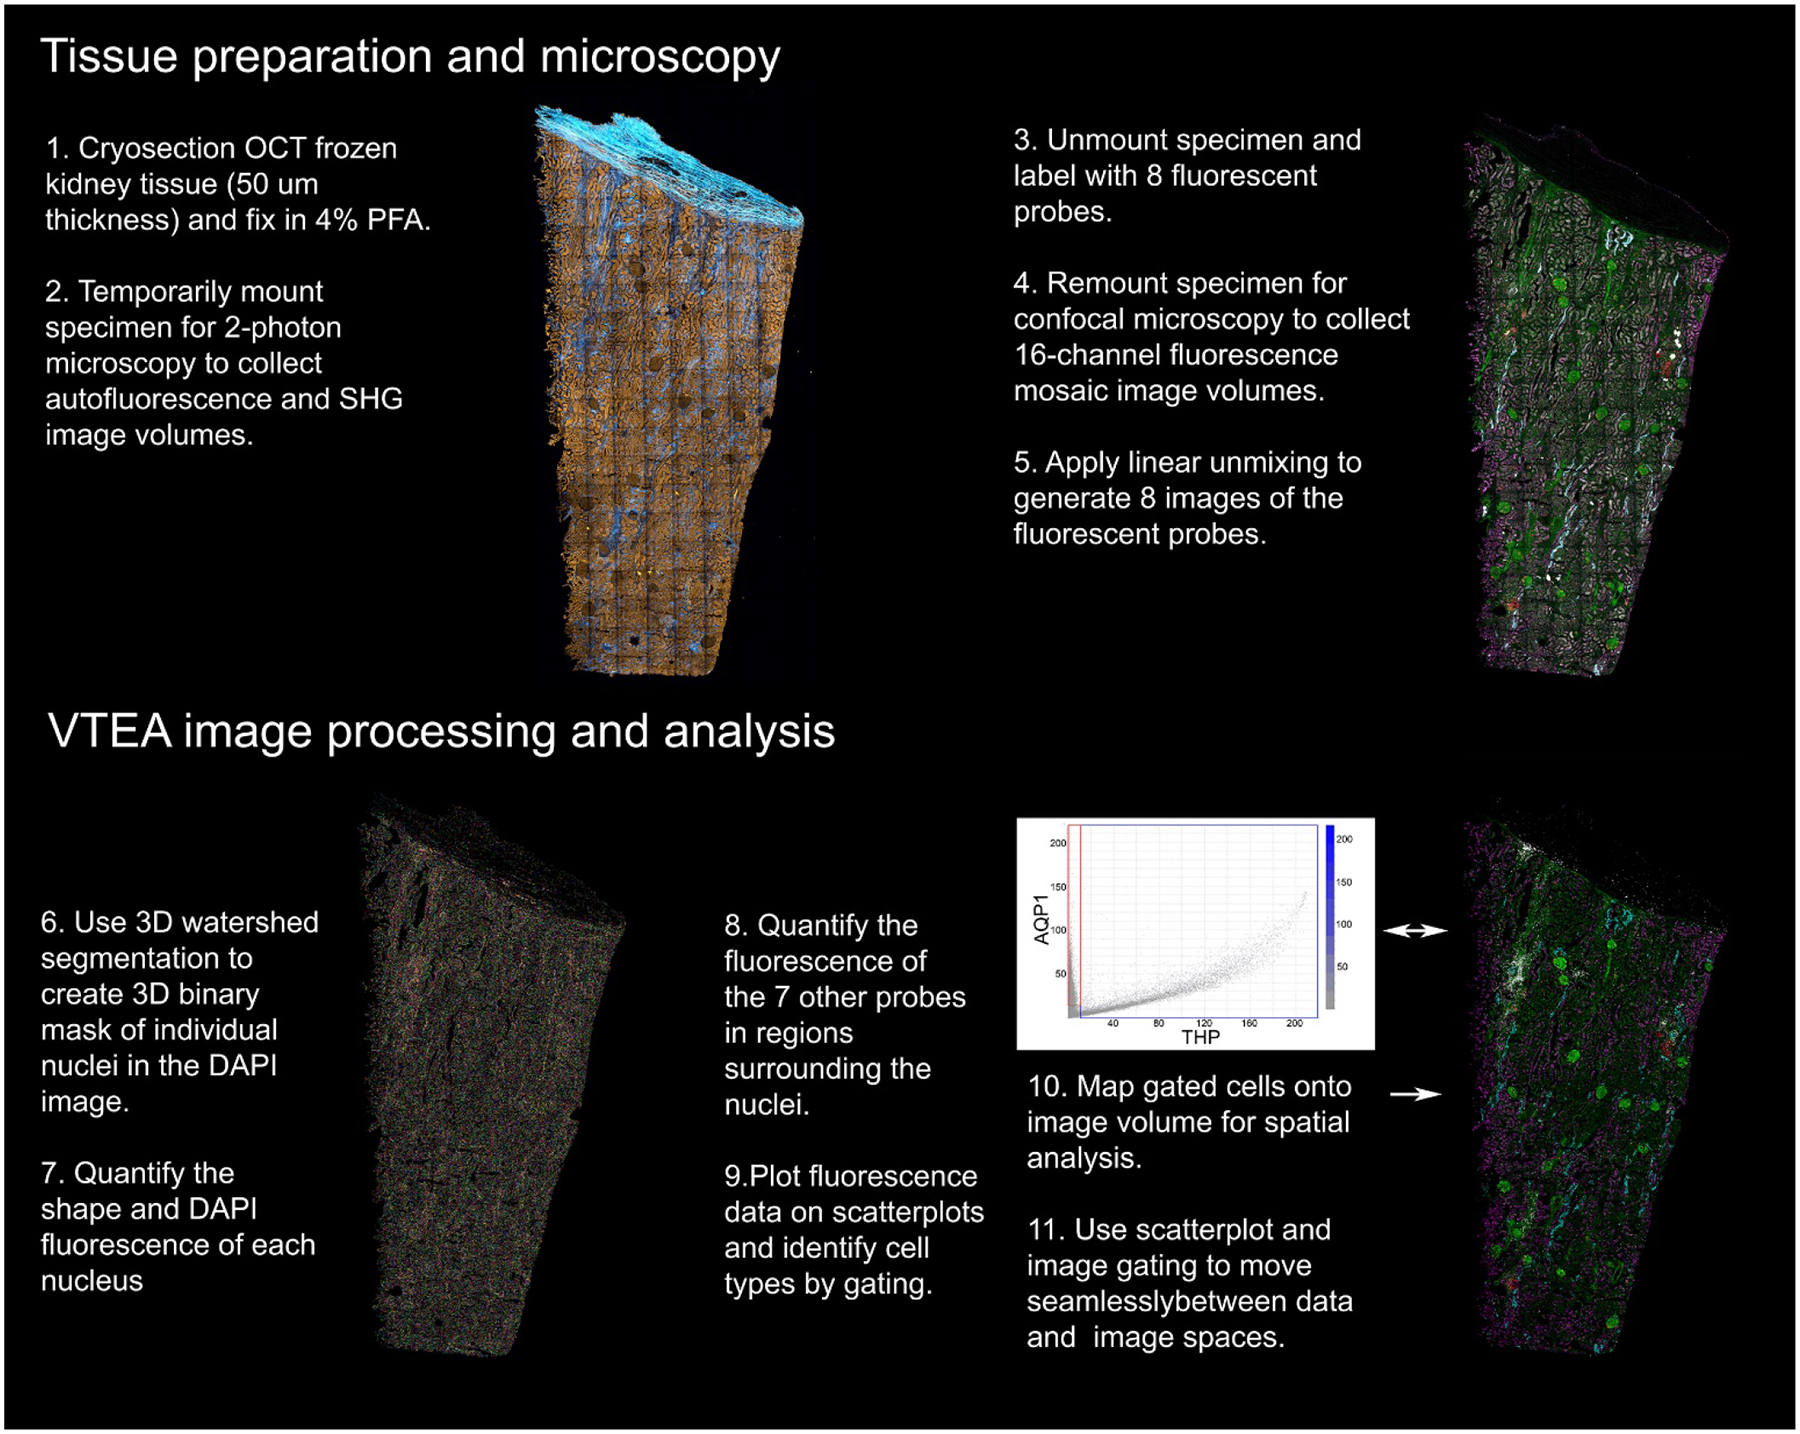
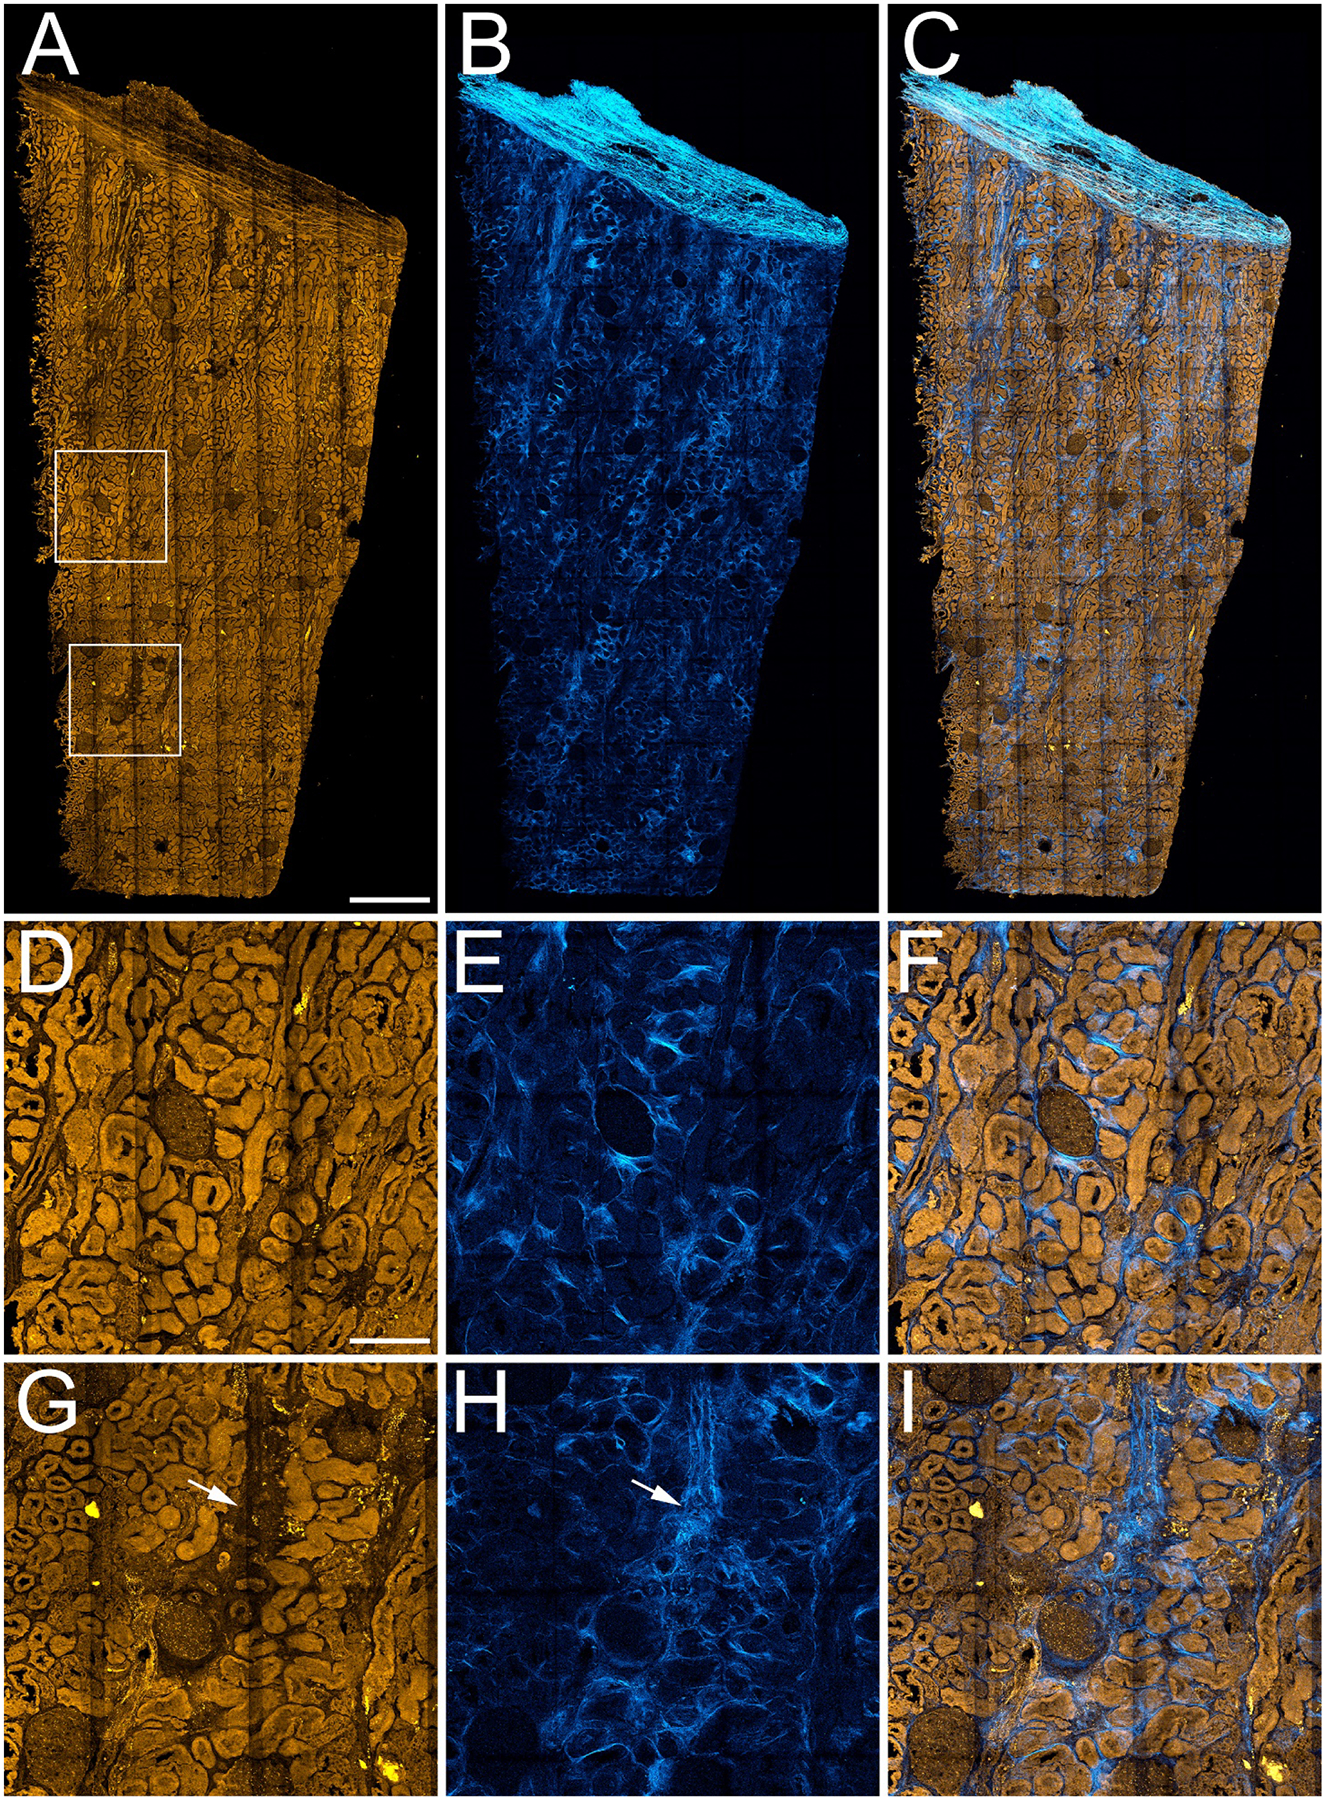
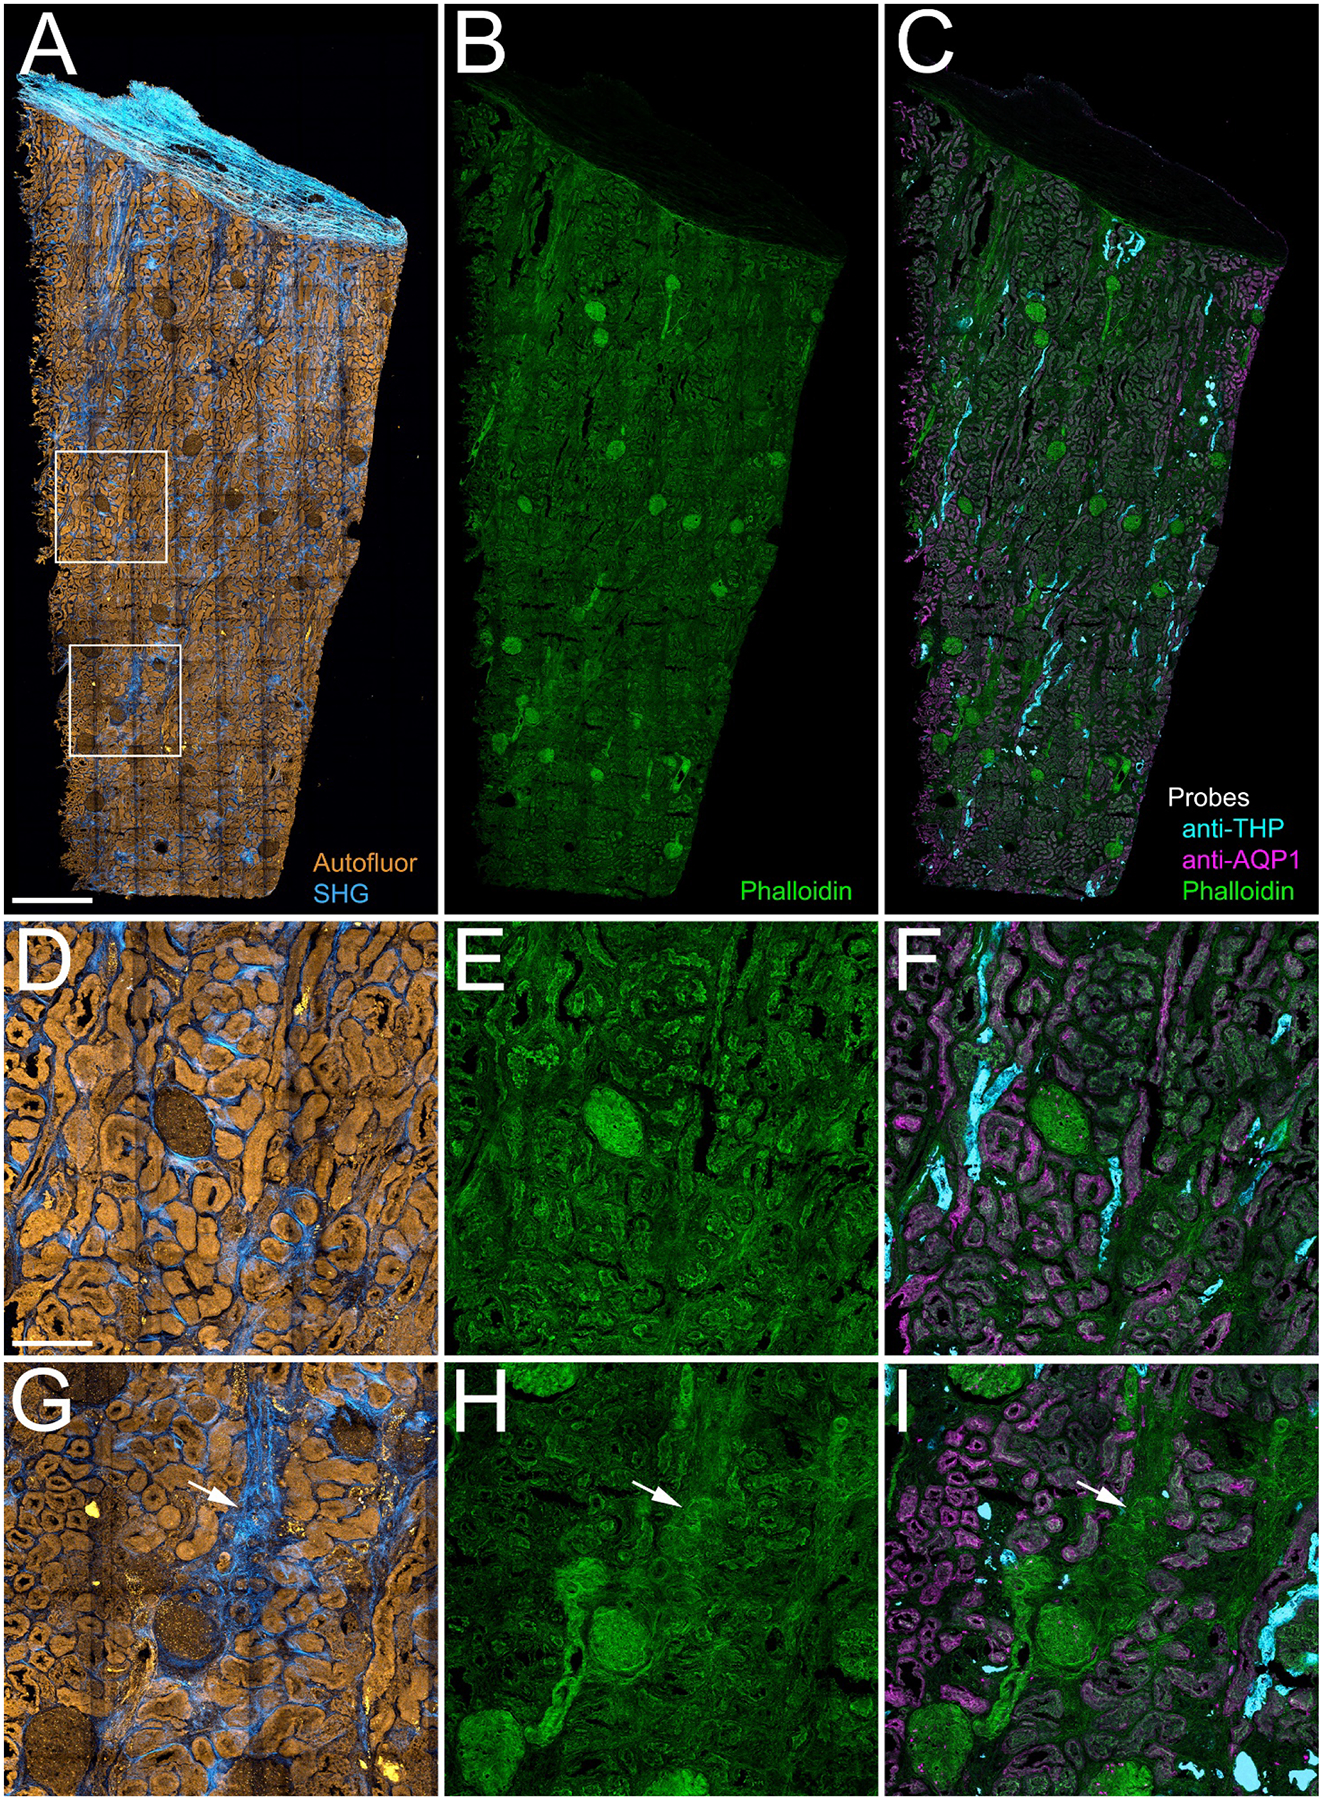
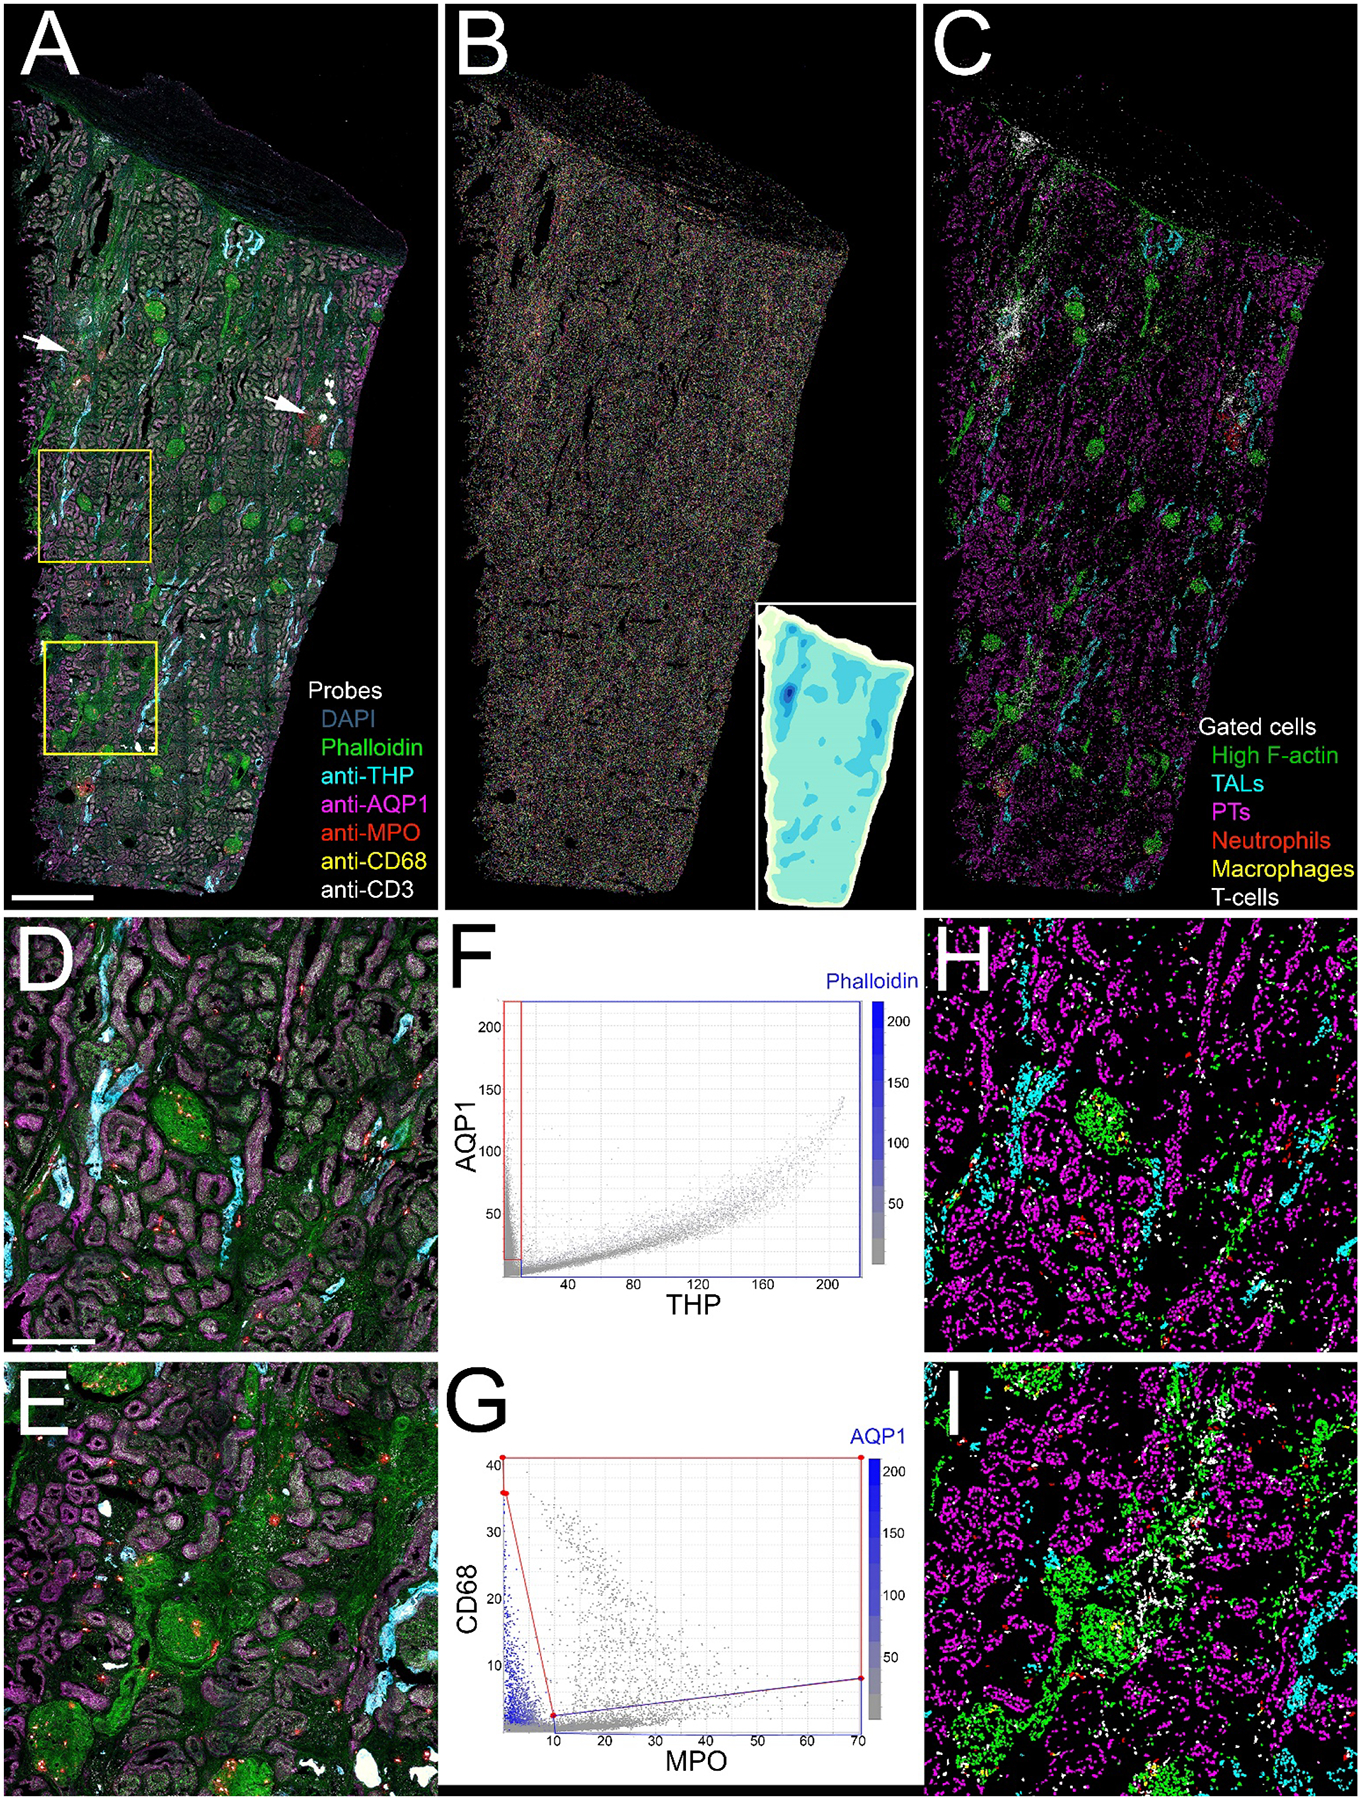
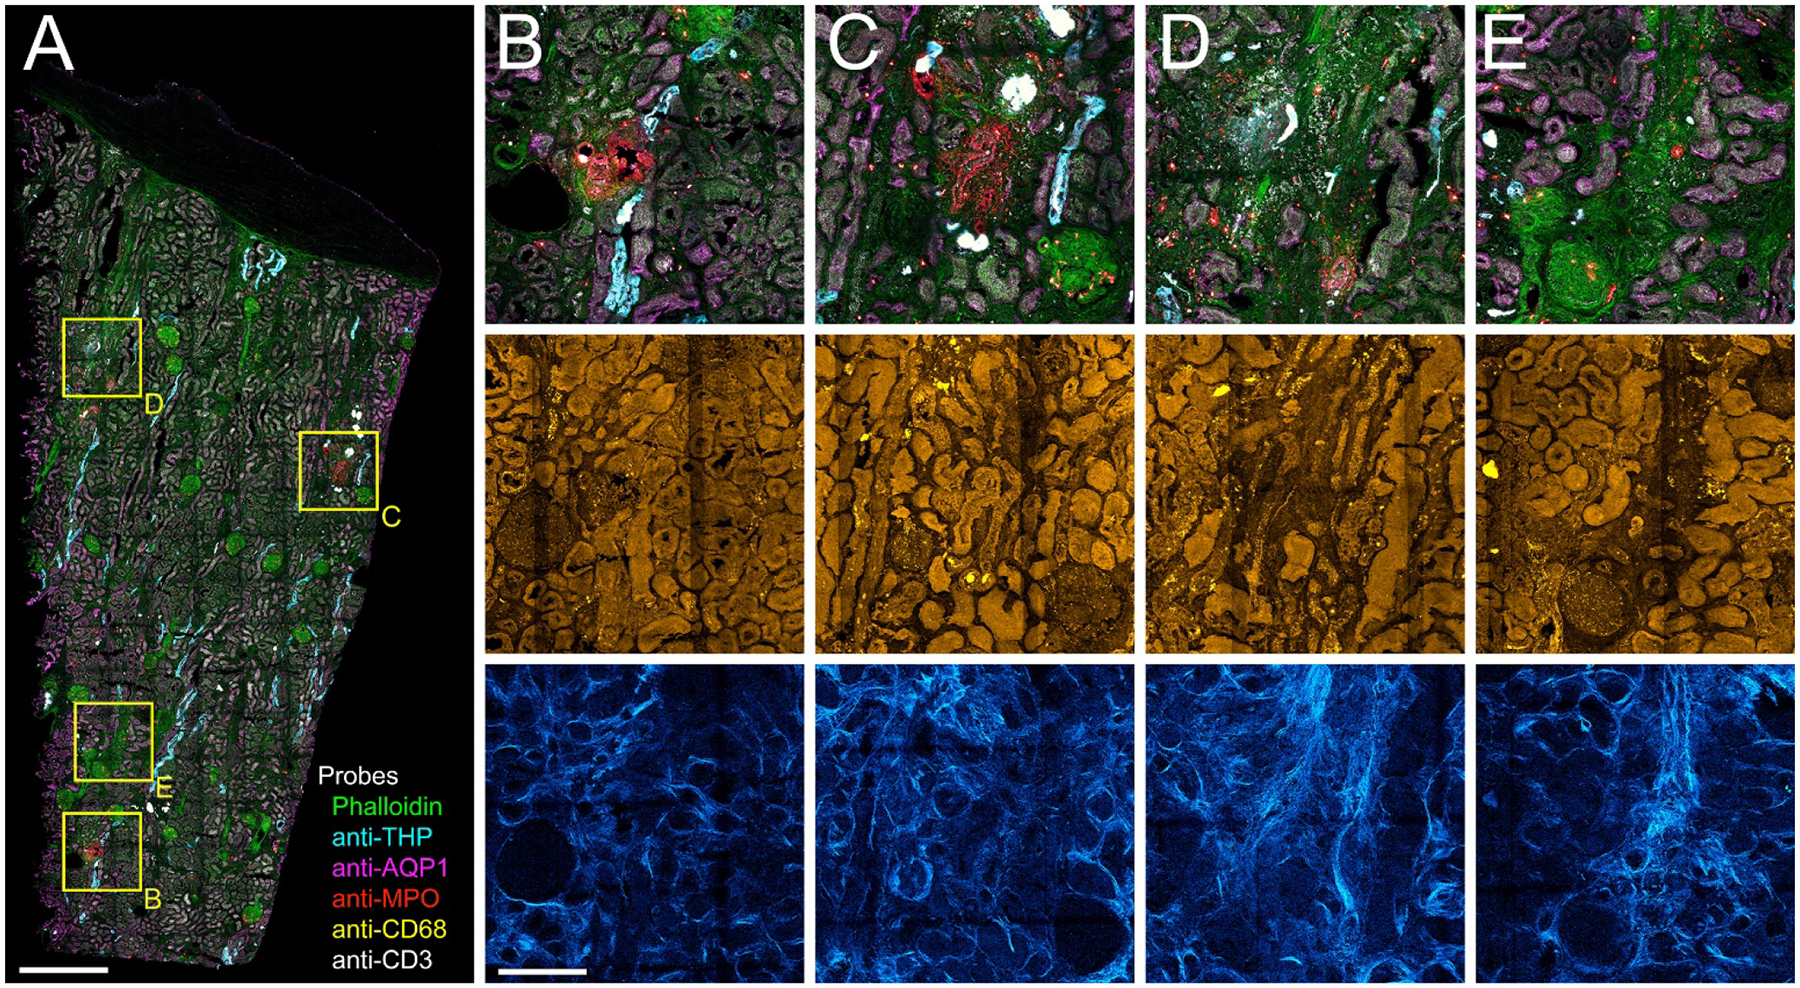
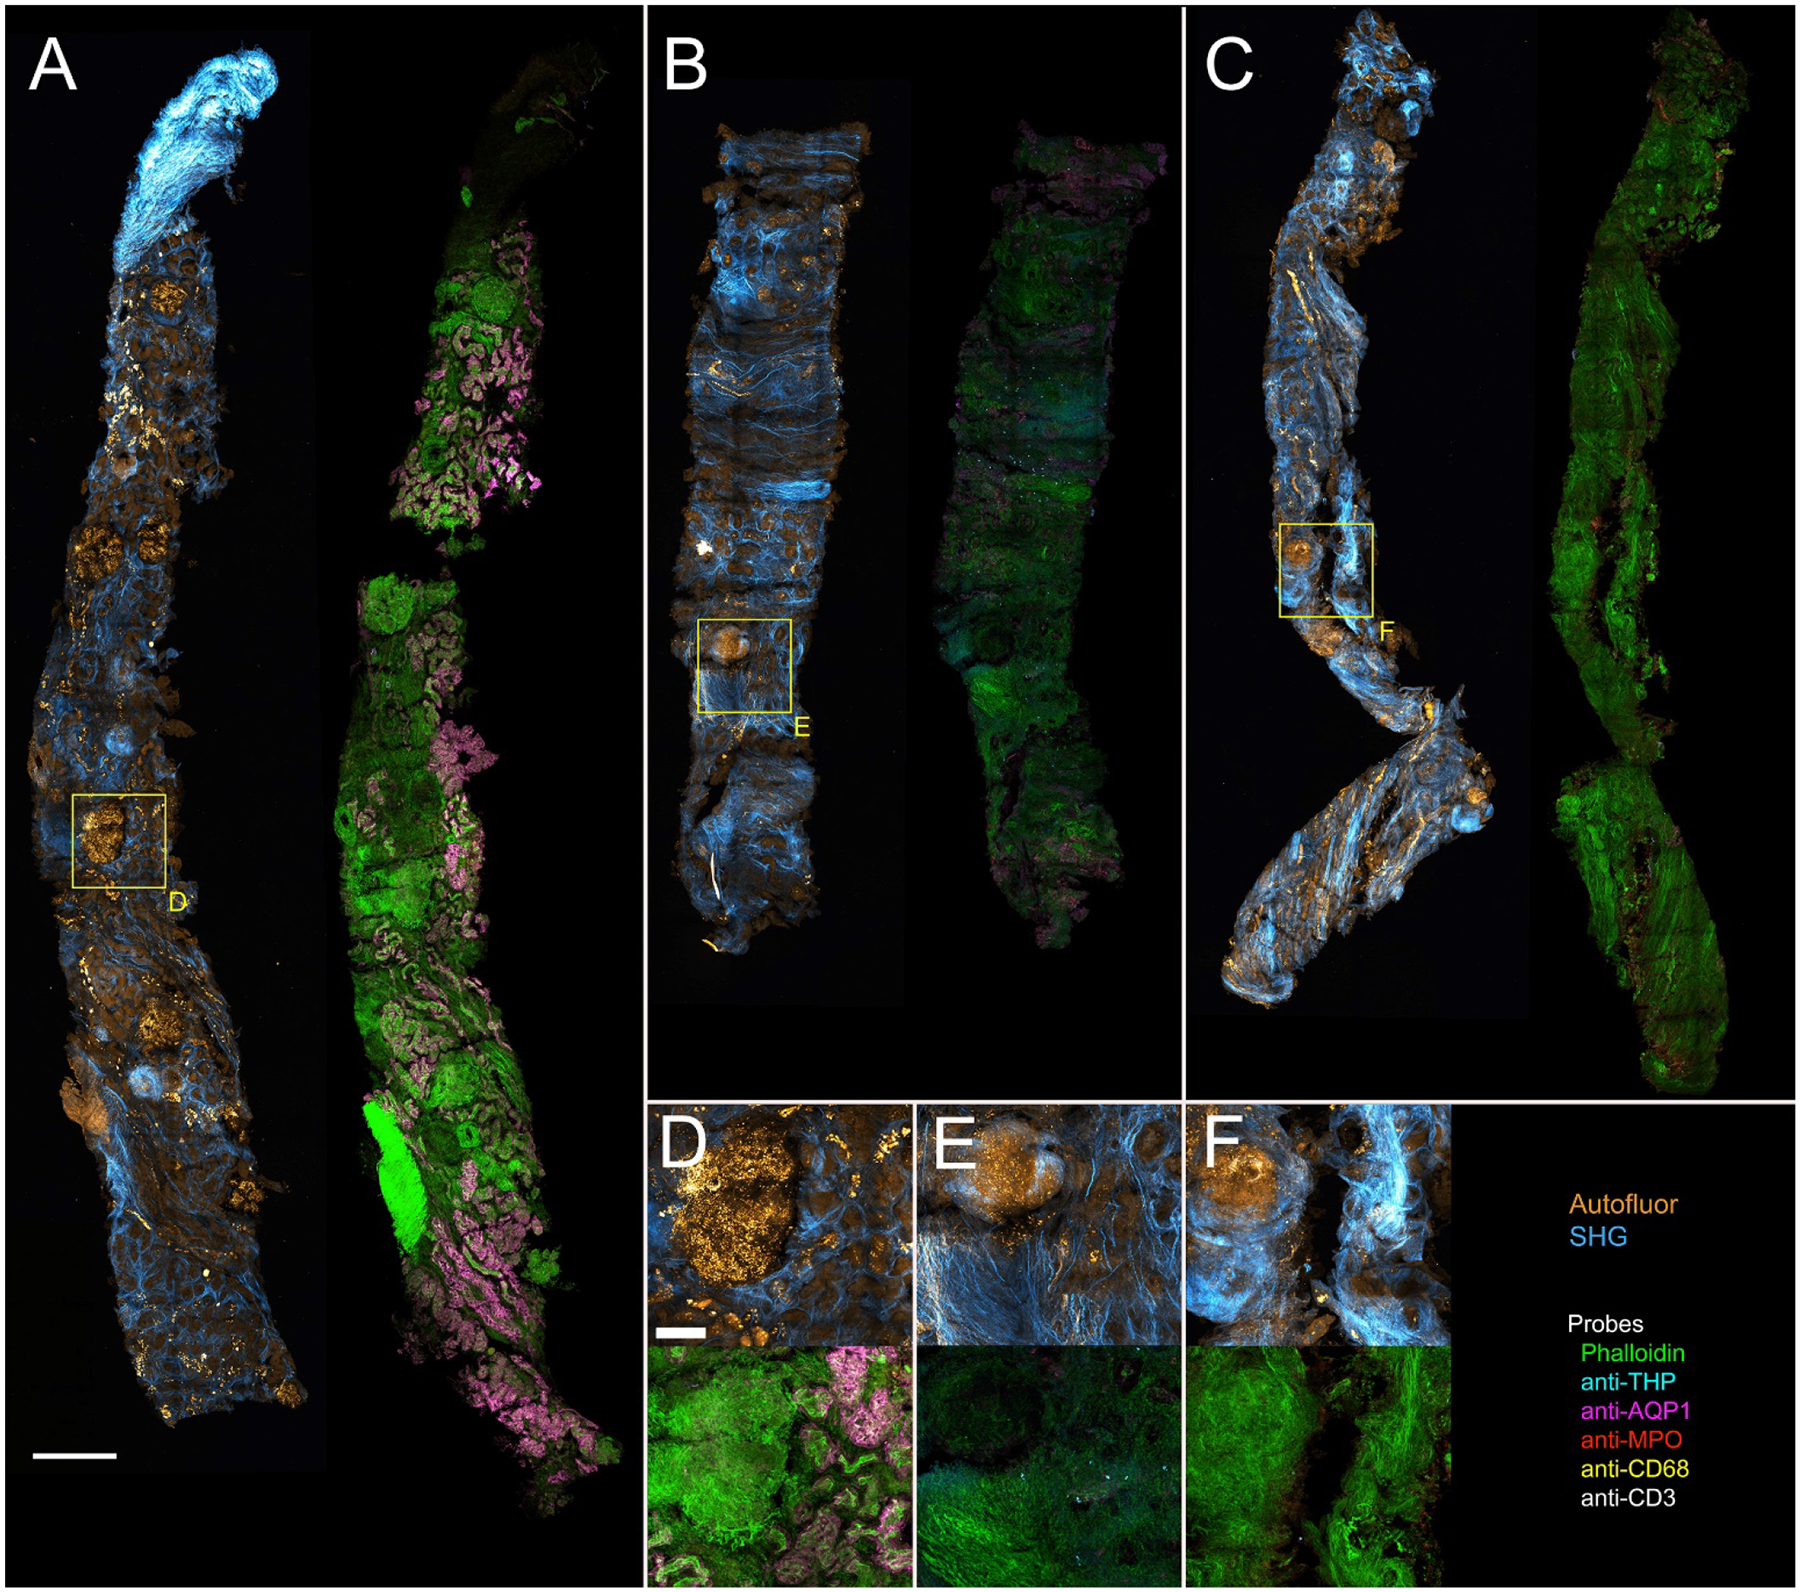
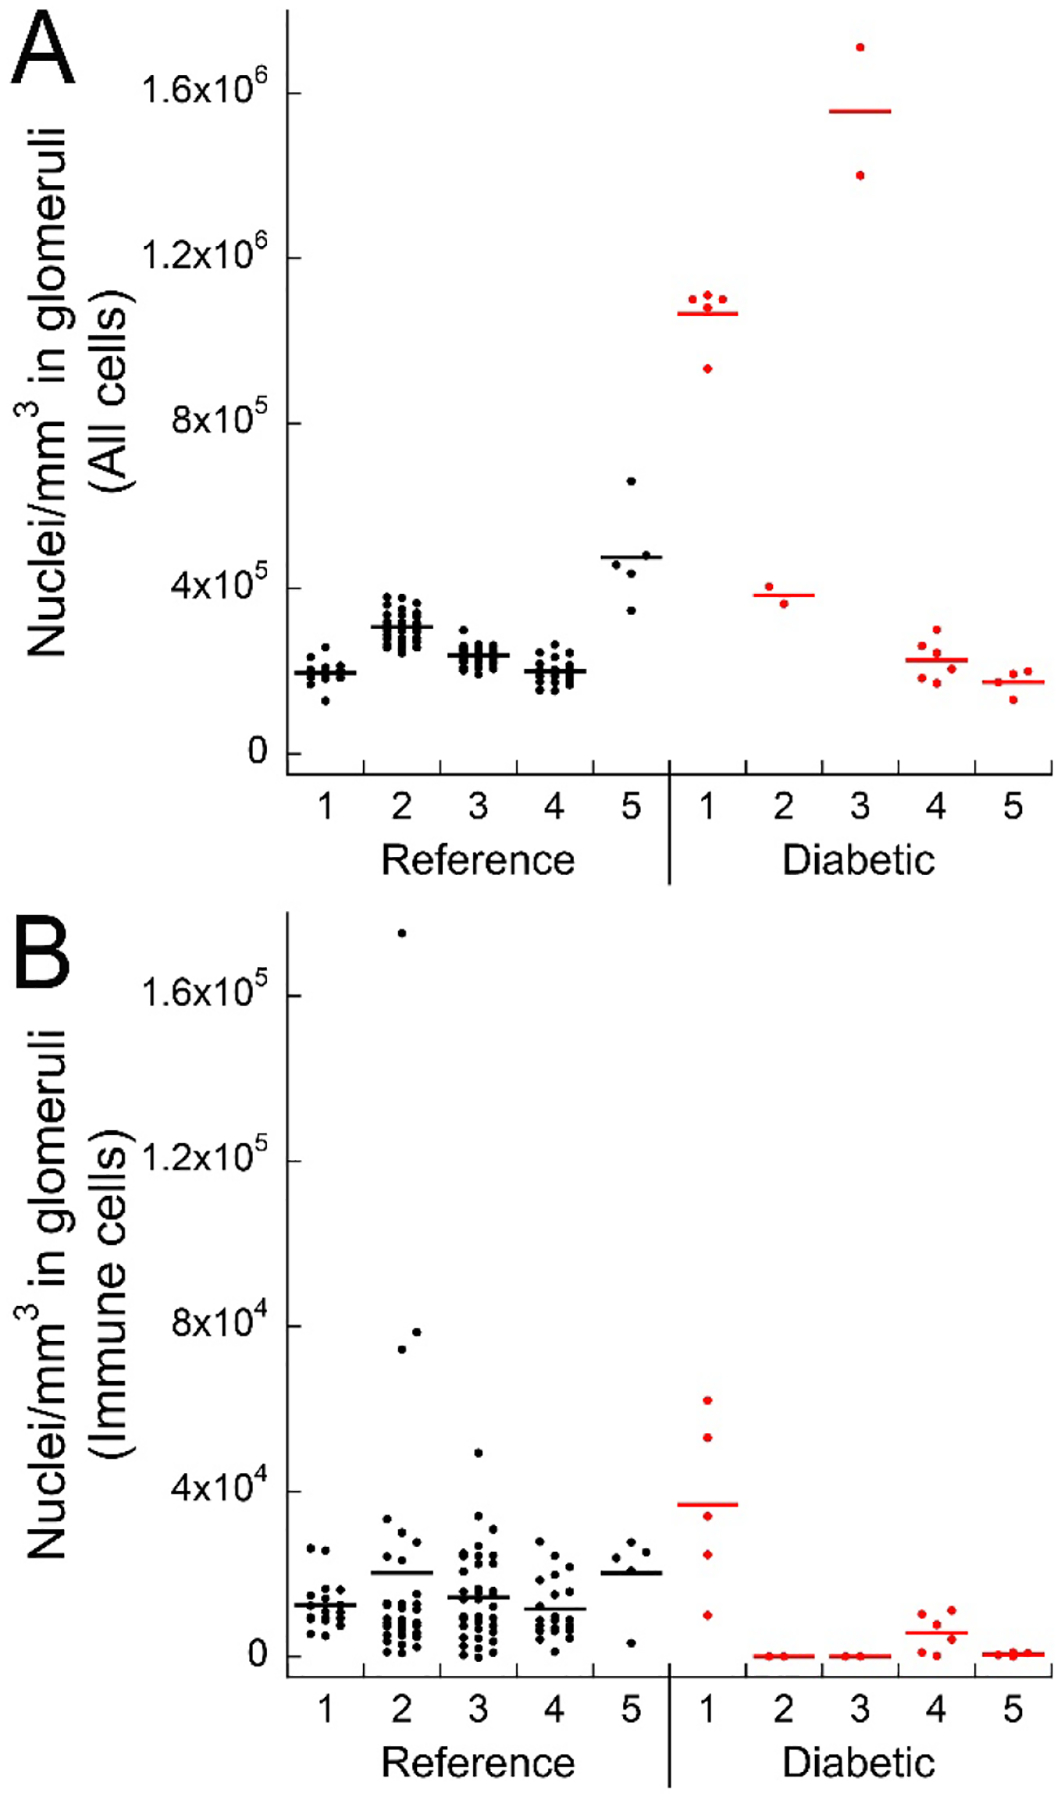
The advent of personalized medicine has driven the development of novel approaches for obtaining detailed cellular and molecular information from clinical tissue samples. Tissue cytometry is a promising new technique that can be used to enumerate and characterize each cell in a tissue and, unlike flow cytometry and other single-cell techniques, does so in the context of the intact tissue, preserving spatial information that is frequently crucial to understanding a cell's physiology, function, and behavior. However, the wide-scale adoption of tissue cytometry as a research tool has been limited by the fact that published examples utilize specialized techniques that are beyond the capabilities of most laboratories. Here we describe a complete and accessible pipeline, including methods of sample preparation, microscopy, image analysis, and data analysis for large-scale three-dimensional tissue cytometry of human kidney tissues. In this workflow, multiphoton microscopy of unlabeled tissue is first conducted to collect autofluorescence and second-harmonic images. The tissue is then labeled with eight fluorescent probes, and imaged using spectral confocal microscopy. The raw 16-channel images are spectrally deconvolved into 8-channel images, and analyzed using the Volumetric Tissue Exploration and Analysis (VTEA) software developed by our group. We applied this workflow to analyze millimeter-scale tissue samples obtained from human nephrectomies and from renal biopsies from individuals diagnosed with diabetic nephropathy, generating a quantitative census of tens of thousands of cells in each. Such analyses can provide useful insights that can be linked to the biology or pathology of kidney disease. The approach utilizes common laboratory techniques, is compatible with most commercially-available confocal microscope systems and all image and data analysis is conducted using the VTEA image analysis software, which is available as a plug-in for ImageJ.


Conflict of interest statement

Disclosures/Conflicts of Interest

The authors declare that they have no conflicts of interest

Figures

Figure 1.
Figure 1.. Overview of the tissue cytometry workflow.
Major steps involved in the tissue imaging and analysis pipeline.
Figure 2.
Figure 2.. 3D multiphoton microscopy of unlabeled nephrectomy.
Mosaic of high-resolution image volumes collected from a 4 mm by 9 mm, 50 micron thick section of paraformaldehyde-fixed human nephrectomy tissue. Panel A – Maximum projection image of 3D volume of tissue autofluorescence. Panel B- Maximum projection of 3D volume of second harmonic generation (SHG) images. Panel C – Overlay of autofluorescence and SHG. Panels D-F show corresponding 4X magnification images of the region indicated in the upper box in panel A, and panels G-I show corresponding 4X magnification images of the region indicated in the lower box in panel A. Arrows in panels G and H indicate regions of apparent tubular dropout and fibrosis. Scale bar in panel A represents 1 mm. Scale bar in panel D represents 250 microns in D-I.
Figure 3.
Figure 3.. 3D confocal immunofluorescence of structural markers.
Panel A - Maximum projection of combined autofluorescence and SHG images. Panel B - Maximum projection of mosaic of confocal fluorescence image volumes of Oregon-Green phalloidin. Panel C - Overlay of maximum projection confocal fluorescence images of phalloidin (green) and antibodies to Tamm-Horsfall Protein (THP, cyan) and aquaporin-1 (AQP1, magenta). Panels D-F show corresponding 4X magnification images of the region indicated in the upper box in panel A, and panels G-I show corresponding 4X magnification images of the region indicated in the lower box in panel A. Arrows in panels G-I indicate regions of fibrosis and apparent tubular dropout. Scale bar in panel A represents 1 mm. Scale bar in panel D represents 250 microns.
Figure 4.
Figure 4.. 3D confocal fluorescence microscopy and cytometry of structural and immune cell markers.
Panel A - Maximum projection of combined fluorescence images of DAPI (grey), phalloidin (green) and antibodies to THP (cyan), AQP1 (magenta), myeloperoxidase (MPO, red), CD68 (yellow) and CD3 (white). Arrows indicate two regions of immune cell infiltrates. (A video of a volume rendering of this volume is presented in Supplementary Video 1). Panel B - Projection of 3D image volume of binary map of nuclei following image segmentation using VTEA. Each segmented nucleus is presented in an arbitrary color. Inset is an isomap of cell density with darker colors depicting higher cell densities. Panel C - Distribution of different cell types following scatterplot gating. Green – phalloidin, Cyan – thick ascending limb, Magenta – proximal tubules. Red – neutrophils, Yellow – macrophages, White – T-cells. Panels D and E show corresponding 4X magnification images of the regions indicated in the two boxes shown in panel A. Panels F and G show scatterplots of the fluorescence intensity of THP vs. AQP1 and MPO vs. CD68, respectively. In each scatterplot, the color of each point represents the fluorescence intensity of a third probe (phalloidin and AQP1, respectively were chosen for these examples). Panels H and I show the locations of the different cell types in the regions shown in panels F and G, respectively, as determined by scatterplot gating. Scale bar in panel A represents 1 mm and 250 microns in panel D.
Figure 5.
Figure 5.. 3D confocal fluorescence and multiphoton autofluorescence/SHG microscopy of regions of apparent injury.
Panel A - Maximum projection of combined 3D fluorescence image volume of phalloidin (green) and antibodies to THP (cyan), AQP1 (magenta), myeloperoxidase (MPO, red), CD68 (yellow) and CD3 (white). Panels B-E - 4X magnifications of regions indicated in boxes in panel A. Top row – confocal fluorescence images. Middle row – corresponding autofluorescence images. Bottom row – corresponding SHG images. Scale bar in panel A represents 1 mm and in panel B 250 um for B-E.
Figure 6.
Figure 6.. 3D Multiphoton autofluorescence/SHG and confocal immunofluorescence microscopy of diabetic renal biopsies.
Gallery of 50 um sections of diabetic biopsies. Panels A–C - Maximum projections of combined 3D label-free autofluorescence and SHG images (Autofluor/SHG) (left0 and immunofluorescence confocal images (right). Phalloidin (green), THP (cyan), AQP1 (magenta), myeloperoxidase (MPO, red), CD68 (yellow) and CD3 (white). Panels D-F - insets from biopsies representing highlighted regions in panels A through C, respectively. The top row shows maximum projections of combined autofluorescence and SHG images and the bottom row shows corresponding immunofluorescence images. Scale bar in panel A represents 2 mm and in panel D represents 100 microns (D-F)
Figure 7.
Figure 7.. Scatterplots of glomerular nuclear density and immune cell density.
Panel A - Total cell densities for 5 reference (black dots) and 5 diabetic (red dots) cases. Panel B - Density of all probed immune cells (myeloperoxidase (MPO), CD68, CD3 and SIGLEC8 positive cells) from the same samples. Each dot represents a single glomerulus.

References

    1. Malone AF, Wu H, Humphreys BD. Bringing Renal Biopsy Interpretation Into the Molecular Age With Single-Cell RNA Sequencing. Semin Nephrol. 2018;38:31–9. - PMC - PubMed
    1. Park J, Liu CL, Kim J, Susztak K. Understanding the kidney one cell at a time. Kidney Int. 2019; 96:862–870. - PMC - PubMed
    1. Petrovas C, Ferrando-Martinez S, Gerner MY, Casazza JP, Pegu A, Deleage C, et al.Follicular CD8 T cells accumulate in HIV infection and can kill infected cells in vitro via bispecific antibodies. Sci Transl Med. 2017;9:eaag2285. - PMC - PubMed
    1. Im SJ, Hashimoto M, Gerner MY, Lee J, Kissick HT, Burger MC, et al.Defining CD8+ T cells that provide the proliferative burst after PD-1 therapy. Nature. 2016;537:417–21. - PMC - PubMed
    1. Liu Z, Gerner MY, Van Panhuys N, Levine AG, Rudensky AY, Germain RN. Immune homeostasis enforced by co-localized effector and regulatory T cells. Nature. 2015;528:225–30. - PMC - PubMed

Publication types

Substances